无论是小尺度(少量)的序列集,还是大尺度(大量)的序列集,无论是基因片段的突变分析,还是全基因组的突变分析。
又或者,序列为非编码基因,或非编码基因+编码基因,或单纯的编码基因,或是蛋白质的氨基酸序列。一图一个软件应该够了。
BioAider的基因突变分析功能
This function could be used for analysis of themutations characteristicson on large numbers of sequenced strains. The sequence datas for analysis needs to be aligned in advance, and they could be nucleotides, proteins(amino acid) sequences or simply coding gene fragments. For nucleotides and proteins sequences, BioAider could summarizes all the mutation sites with corresponding frequency and strains. Of course, if the datas is codon gene, BioAider provides multiple sets of different codon tables for users, and could scan each condon sites in aligned sequence datasets, and identifies the type of mutation, including synonymous, non-synonymous, insertions and deletions and early termination. Finally, BioAider will automatically summarize and output the relevant analysis results.
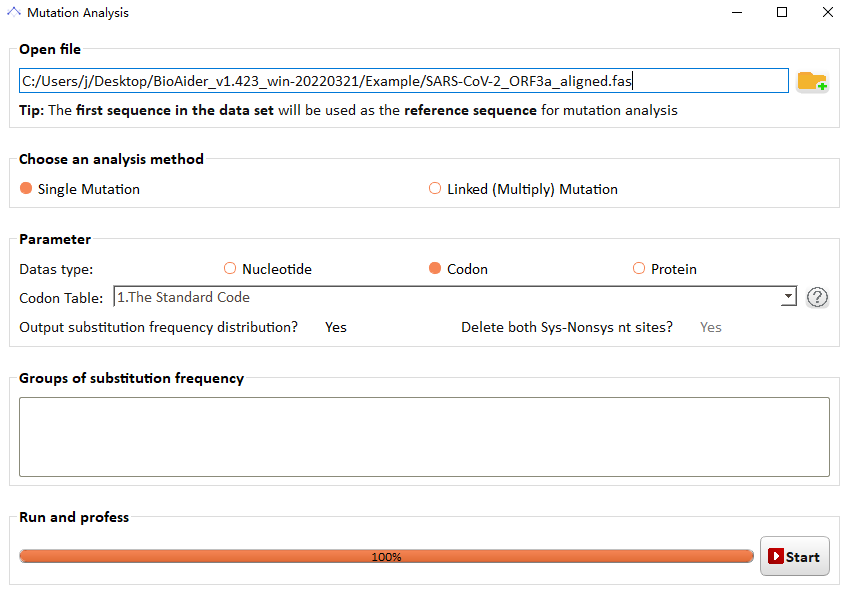
Note: The codon gene sequences for mutations analysis have to be aligned by translation-alignment methon in advance, It is worth mentioning that BioAider packed three multiple-sequence-alignment software (mafft, muscle and clsutal-omega) in the graphical interface, and provided translation-alignment additionally. Whether it’s nucleotides or amino acids or coding genes, BioAider could plot the frequency distribution graph for mutation sites through specifing groups of substitution frequencey in custom. Eaxmple of mutations analysis for aligned SARS-CoV-2 ORF3a gene sequences(an aligned coding gene sequence). First, Drag the sequence to be analyzed to the input box, and select “Codon” single button in “Datas type”:

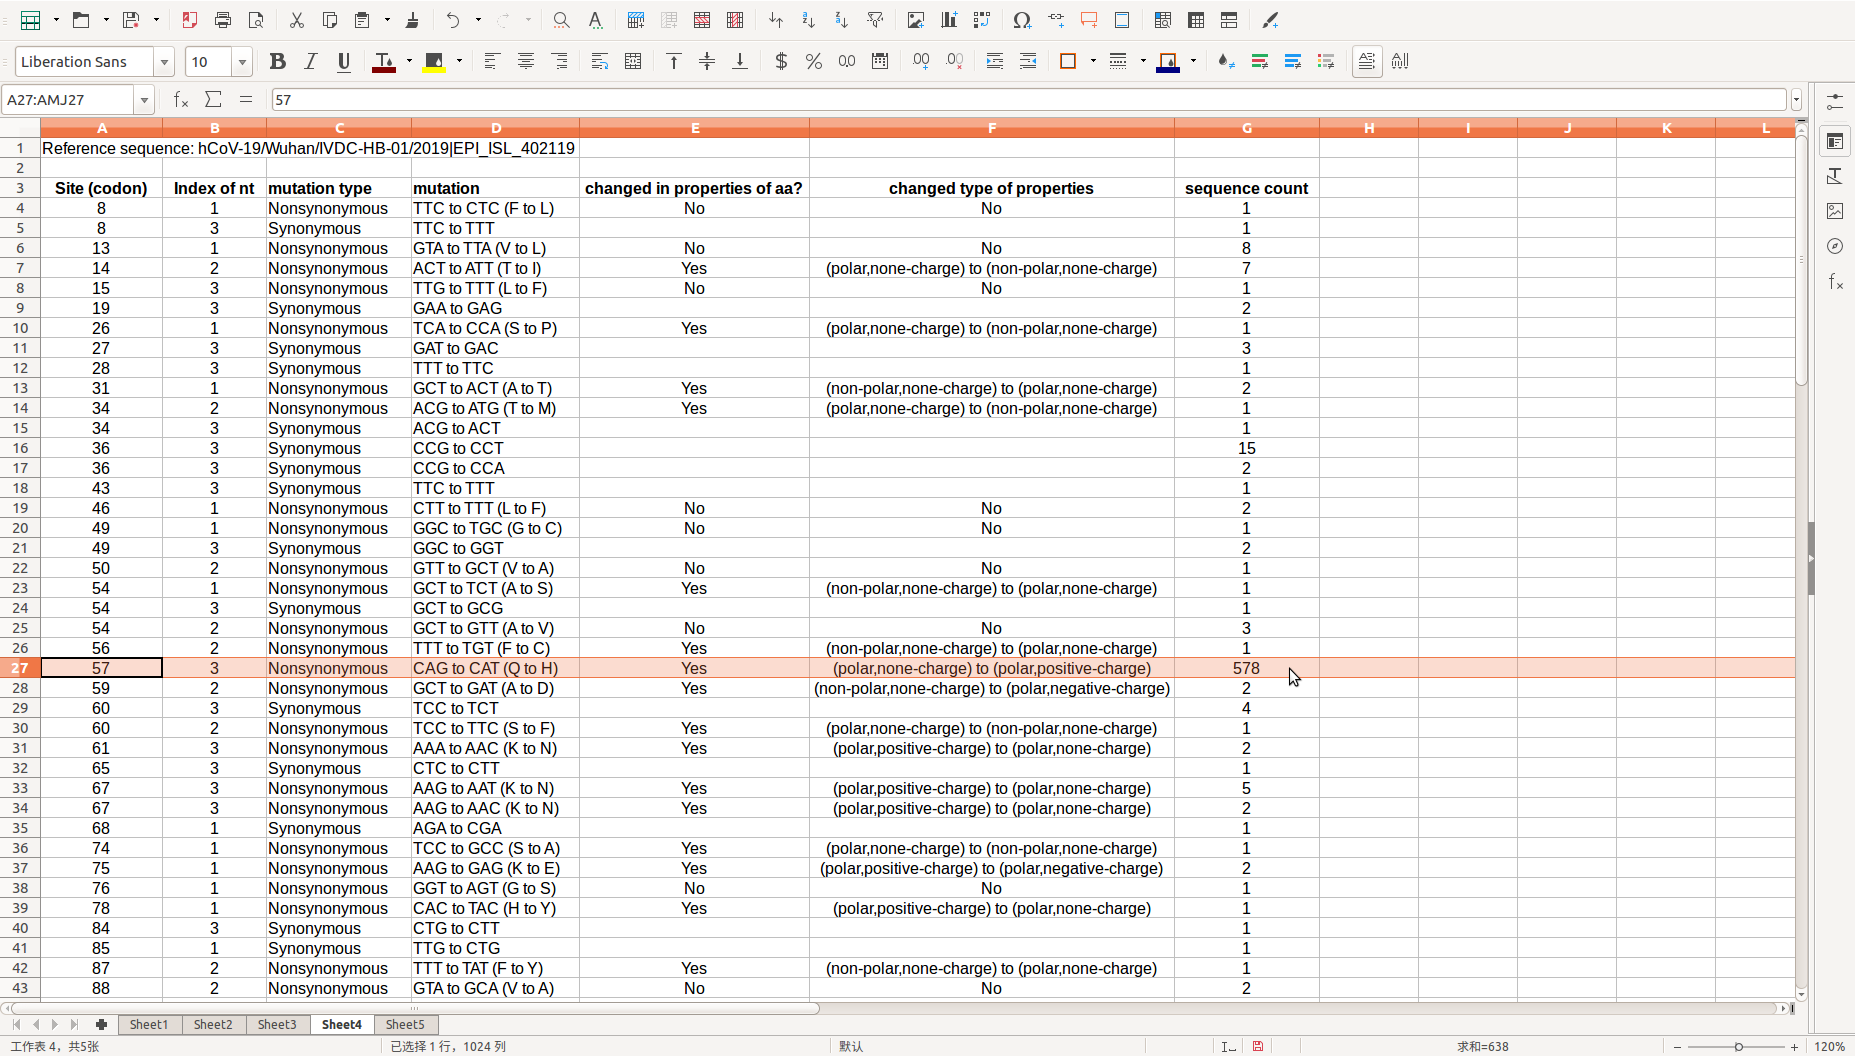
After the run is over, these analysis result could be found in the directory where the source file is located, you could scan the *_mutation site summary file then know the overall variation and mutation hotspots.

Codon-wise statistics on synonymous and non-synonymous substitutions are also provided in “Statistics in codons” directory:
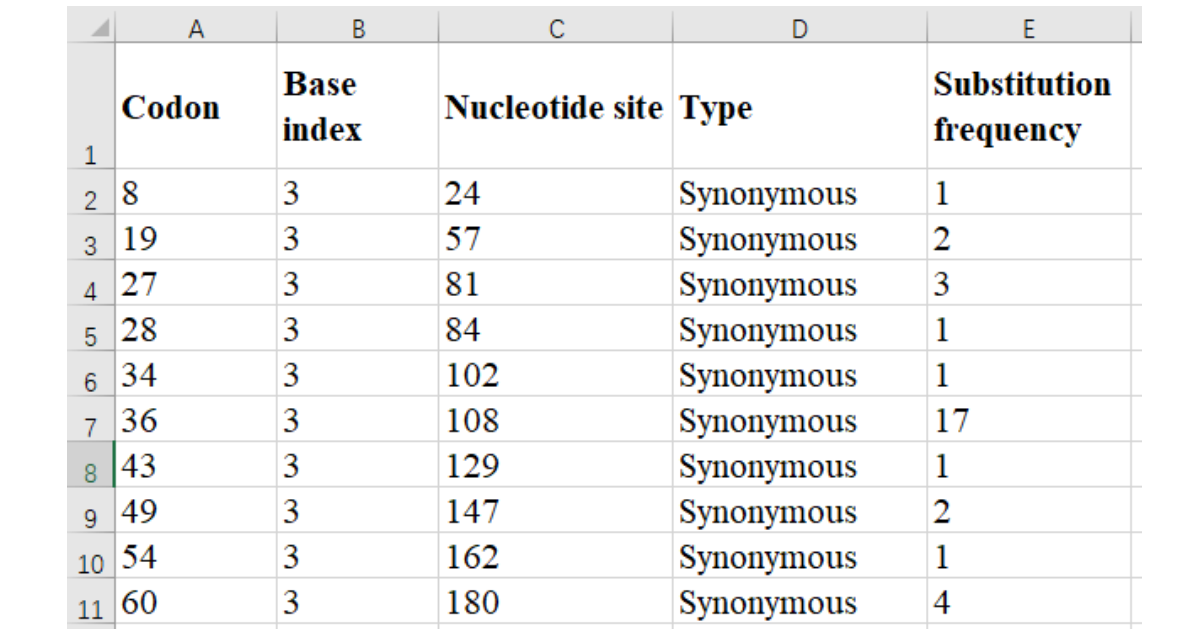
Besides, BioAider uniquely provides statistical synonymous and non-synonymous substitution nucleotide positions in “base” units :

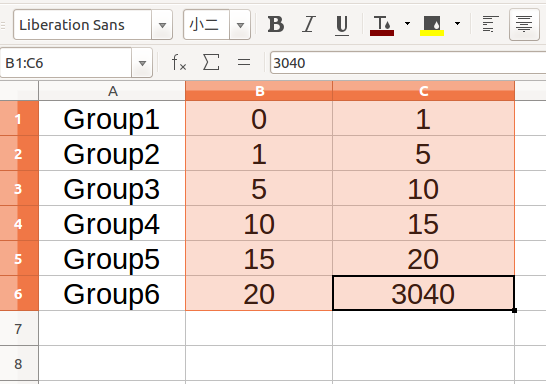
If you also need to plot the distribution of synonymous/non-synonymous substitution bases, you can prepare a grouping table first:

The each groups of substitution frequencey contains start value and end value which are separated by tab symbol. Note,the start value of each group is not included in the range of frequency, and the frequencies of different groups need to be consecutive integers. Then copy them to the textedit box of BioAider,
You could also konw the number of mutation nucleotide site under each mutation frequency group through view *_substitution frequency distribution.png.

It is not difficult to find that more than half of the mutation sites only appear in a single strain, although there are many mutation sites in ORF3a gene. Of course, BioAider additionally provides vector graphics (*_substitution frequency distribution.pdf), users can edit them and facilitate publication.
Besides, users could obtain the corresponding mutant strains of these variant sites in the detailed *_log.txt file. Of note,if these sequences are much divergent, such as from different family enver order and contain a lot of gaps (“-“) in the aligned sequence, I usually don’t recommend using them for mutation analysis. On the one hand, they would make a lot of calculations, on the other hand, they are inherently highly variable and have no value of analysis. But if you still want to study their variation, it is recommended to use the following function of “Site Counter”.
附BioAider下载地址:https://github.com/ZhijianZhou01/BioAider


