参考资料:时间序列中的异常
例子:
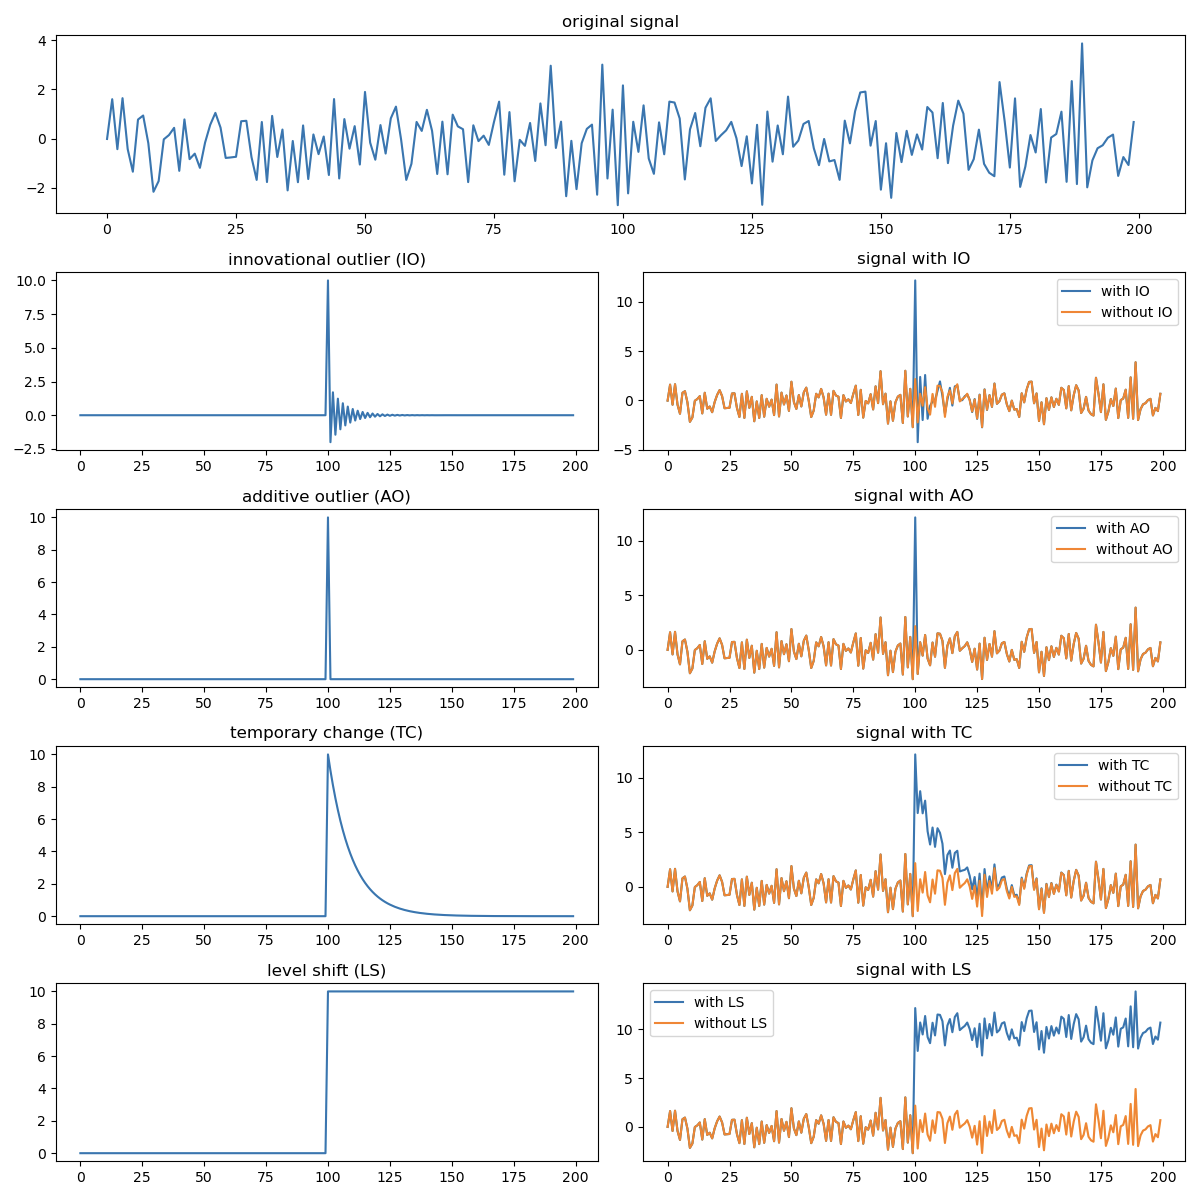
import numpy as npimport pandas as pdimport matplotlib.pyplot as pltfrom scipy.signal import lfilter, unit_impulsedef arma_process(ar, ma, size=200, scale=1., e=None):if e is None:e = np.random.normal(size=size)return lfilter(ma, ar, scale*e)# 考虑一个 ARMA(1, 1) 模型ar = [1, 0.85]ma = [1, 0.65]sample = arma_process(ar, ma)io = arma_process(ar, ma, e=10*unit_impulse(200, 100))ao = 10*unit_impulse(200, 100)tc = arma_process([1, -0.9], [1], e=10*unit_impulse(200, 100))ls = arma_process([1, -1], [1], e=10*unit_impulse(200, 100))x = range(200)plt.figure(figsize=(12, 12))plt.subplot(511)plt.plot(x, sample)plt.title('original signal')plt.subplot(523)plt.plot(x, io)plt.title('innovational outlier (IO)')plt.subplot(524)plt.plot(x, sample+io, label='with IO')plt.plot(x, sample, label='without IO')plt.title('signal with IO')plt.legend()plt.subplot(525)plt.plot(x, ao)plt.title('additive outlier (AO)')plt.subplot(526)plt.plot(x, sample+ao, label='with AO')plt.plot(x, sample, label='without AO')plt.title('signal with AO')plt.legend()plt.subplot(527)plt.plot(x, tc)plt.title('temporary change (TC)')plt.subplot(528)plt.plot(x, sample+tc, label='with TC')plt.plot(x, sample, label='without TC')plt.title('signal with TC')plt.legend()plt.subplot(529)plt.plot(x, ls)plt.title('level shift (LS)')plt.subplot(5,2,10)plt.plot(x, sample+ls, label='with LS')plt.plot(x, sample, label='without LS')plt.title('signal with LS')plt.legend()plt.tight_layout()plt.show()

若有收获,就点个赞吧
0 人点赞
