本章节我们学习如何将账单列表,以可视化数据的新形势展示,本章节我们会通过 Echart 插件,对数据进行可视化展示。
页面布局如下所示: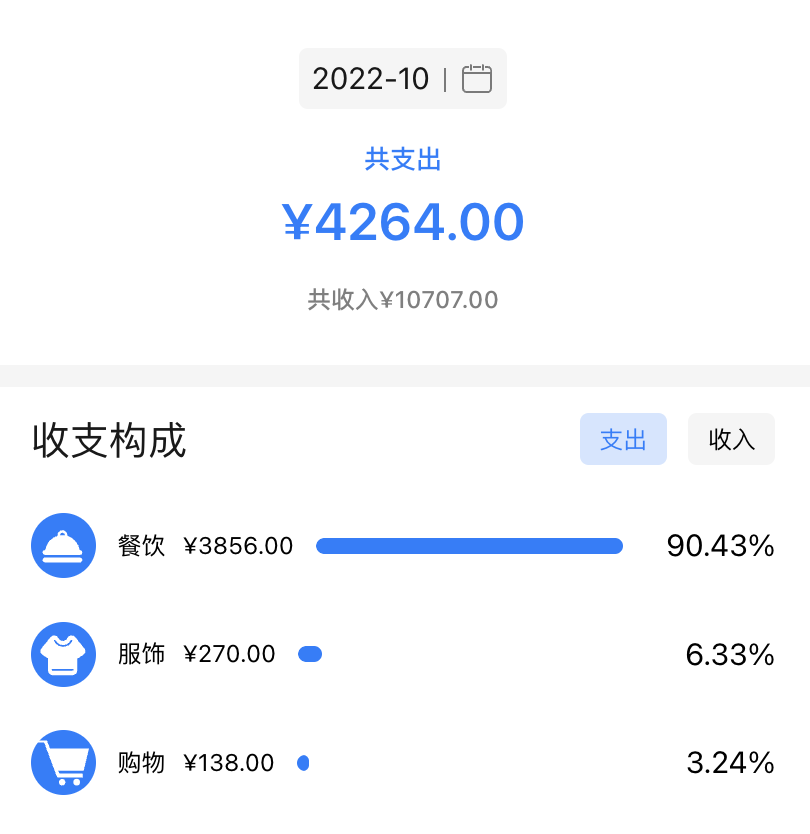
头部筛选和数据实现
当你看到顶部的时间筛选项的时候,你会再一次体会到当初把时间筛选功能封装成公用组件的好处,于是我们打开 Data/index.jsx,添加如下代码:
import React, { useEffect, useRef, useState } from 'react';import { Icon, Progress } from 'zarm';import cx from 'classnames';import dayjs from 'dayjs';import { get, typeMap } from '@/utils'import CustomIcon from '@/components/CustomIcon'import PopupDate from '@/components/PopupDate'import s from './style.module.less';const Data = () => {return <div className={s.data}><div className={s.total}><div className={s.time}><span>2021-06</span><Icon className={s.date} type="date" /></div><div className={s.title}>共支出</div><div className={s.expense}>¥1000</div><div className={s.income}>共收入¥200</div></div></div>}export default Data
样式部分有一个小技巧需要注意,日期后面的小竖线,如下所示: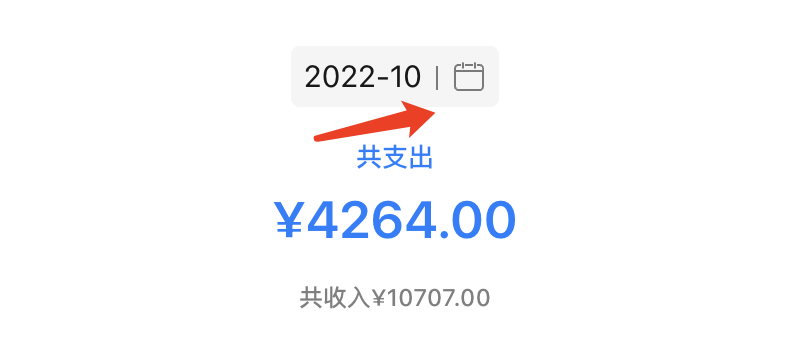
在业务中,类似这样的需求非常多,这里我们可以使用伪类 ::before 或 ::after 去实现,减少在页面中再添加一些多余的标签。上述代码实现的逻辑是在日期的 span 上加上 ::after,如下所示:
span:nth-of-type(1)::after {content: '';position: absolute;top: 9px;bottom: 8px;right: 28px;width: 1px;background-color: rgba(0, 0, 0, .5);}
点击如期按钮,弹出底部弹窗,这里使用到了之前写好的 PopupDate 组件,代码如下:
const Data = () => {const monthRef = useRef();const [currentMonth, setCurrentMonth] = useState(dayjs().format('YYYY-MM'));// 月份弹窗开关const monthShow = () => {monthRef.current && monthRef.current.show();};const selectMonth = (item) => {setCurrentMonth(item);};return <div className={s.data}><div className={s.total}><div className={s.time} onClick={monthShow}><span>{currentMonth}</span><Icon className={s.date} type="date" /></div><div className={s.title}>共支出</div><div className={s.expense}>¥1000</div><div className={s.income}>共收入¥200</div></div><PopupDate ref={monthRef} mode="month" onSelect={selectMonth} /></div>}
账单单项排名制作
我们将账单排名部分的结构搭建出来,通过请求数据接口,将数据展示在页面上,代码如下:
const Data = () => {...const [totalType, setTotalType] = useState('expense'); // 收入或支出类型const [totalExpense, setTotalExpense] = useState(0); // 总支出const [totalIncome, setTotalIncome] = useState(0); // 总收入const [expenseData, setExpenseData] = useState([]); // 支出数据const [incomeData, setIncomeData] = useState([]); // 收入数据useEffect(() => {getData()}, [currentMonth]);// 获取数据详情const getData = async () => {const { data } = await get(`/api/bill/data?date=${currentMonth}`);// 总收支setTotalExpense(data.total_expense);setTotalIncome(data.total_income);// 过滤支出和收入const expense_data = data.total_data.filter(item => item.pay_type == 1).sort((a, b) => b.number - a.number); // 过滤出账单类型为支出的项const income_data = data.total_data.filter(item => item.pay_type == 2).sort((a, b) => b.number - a.number); // 过滤出账单类型为收入的项setExpenseData(expense_data);setIncomeData(income_data);};return <div className={s.data}>...<div className={s.structure}><div className={s.head}><span className={s.title}>收支构成</span><div className={s.tab}><span onClick={() => changeTotalType('expense')} className={cx({ [s.expense]: true, [s.active]: totalType == 'expense' })}>支出</span><span onClick={() => changeTotalType('income')} className={cx({ [s.income]: true, [s.active]: totalType == 'income' })}>收入</span></div></div><div className={s.content}>{(totalType == 'expense' ? expenseData : incomeData).map(item => <div key={item.type_id} className={s.item}><div className={s.left}><div className={s.type}><span className={cx({ [s.expense]: totalType == 'expense', [s.income]: totalType == 'income' })}><CustomIcontype={item.type_id ? typeMap[item.type_id].icon : 1}/></span><span className={s.name}>{ item.type_name }</span></div><div className={s.progress}>¥{ Number(item.number).toFixed(2) || 0 }</div></div><div className={s.right}><div className={s.percent}><Progressshape="line"percent={Number((item.number / Number(totalType == 'expense' ? totalExpense : totalIncome)) * 100).toFixed(2)}theme='primary'/></div></div></div>)}</div></div>...</div>}
上述是账单排名部分的代码部分,通过 getData 方法获取账单数据,接口字段分析: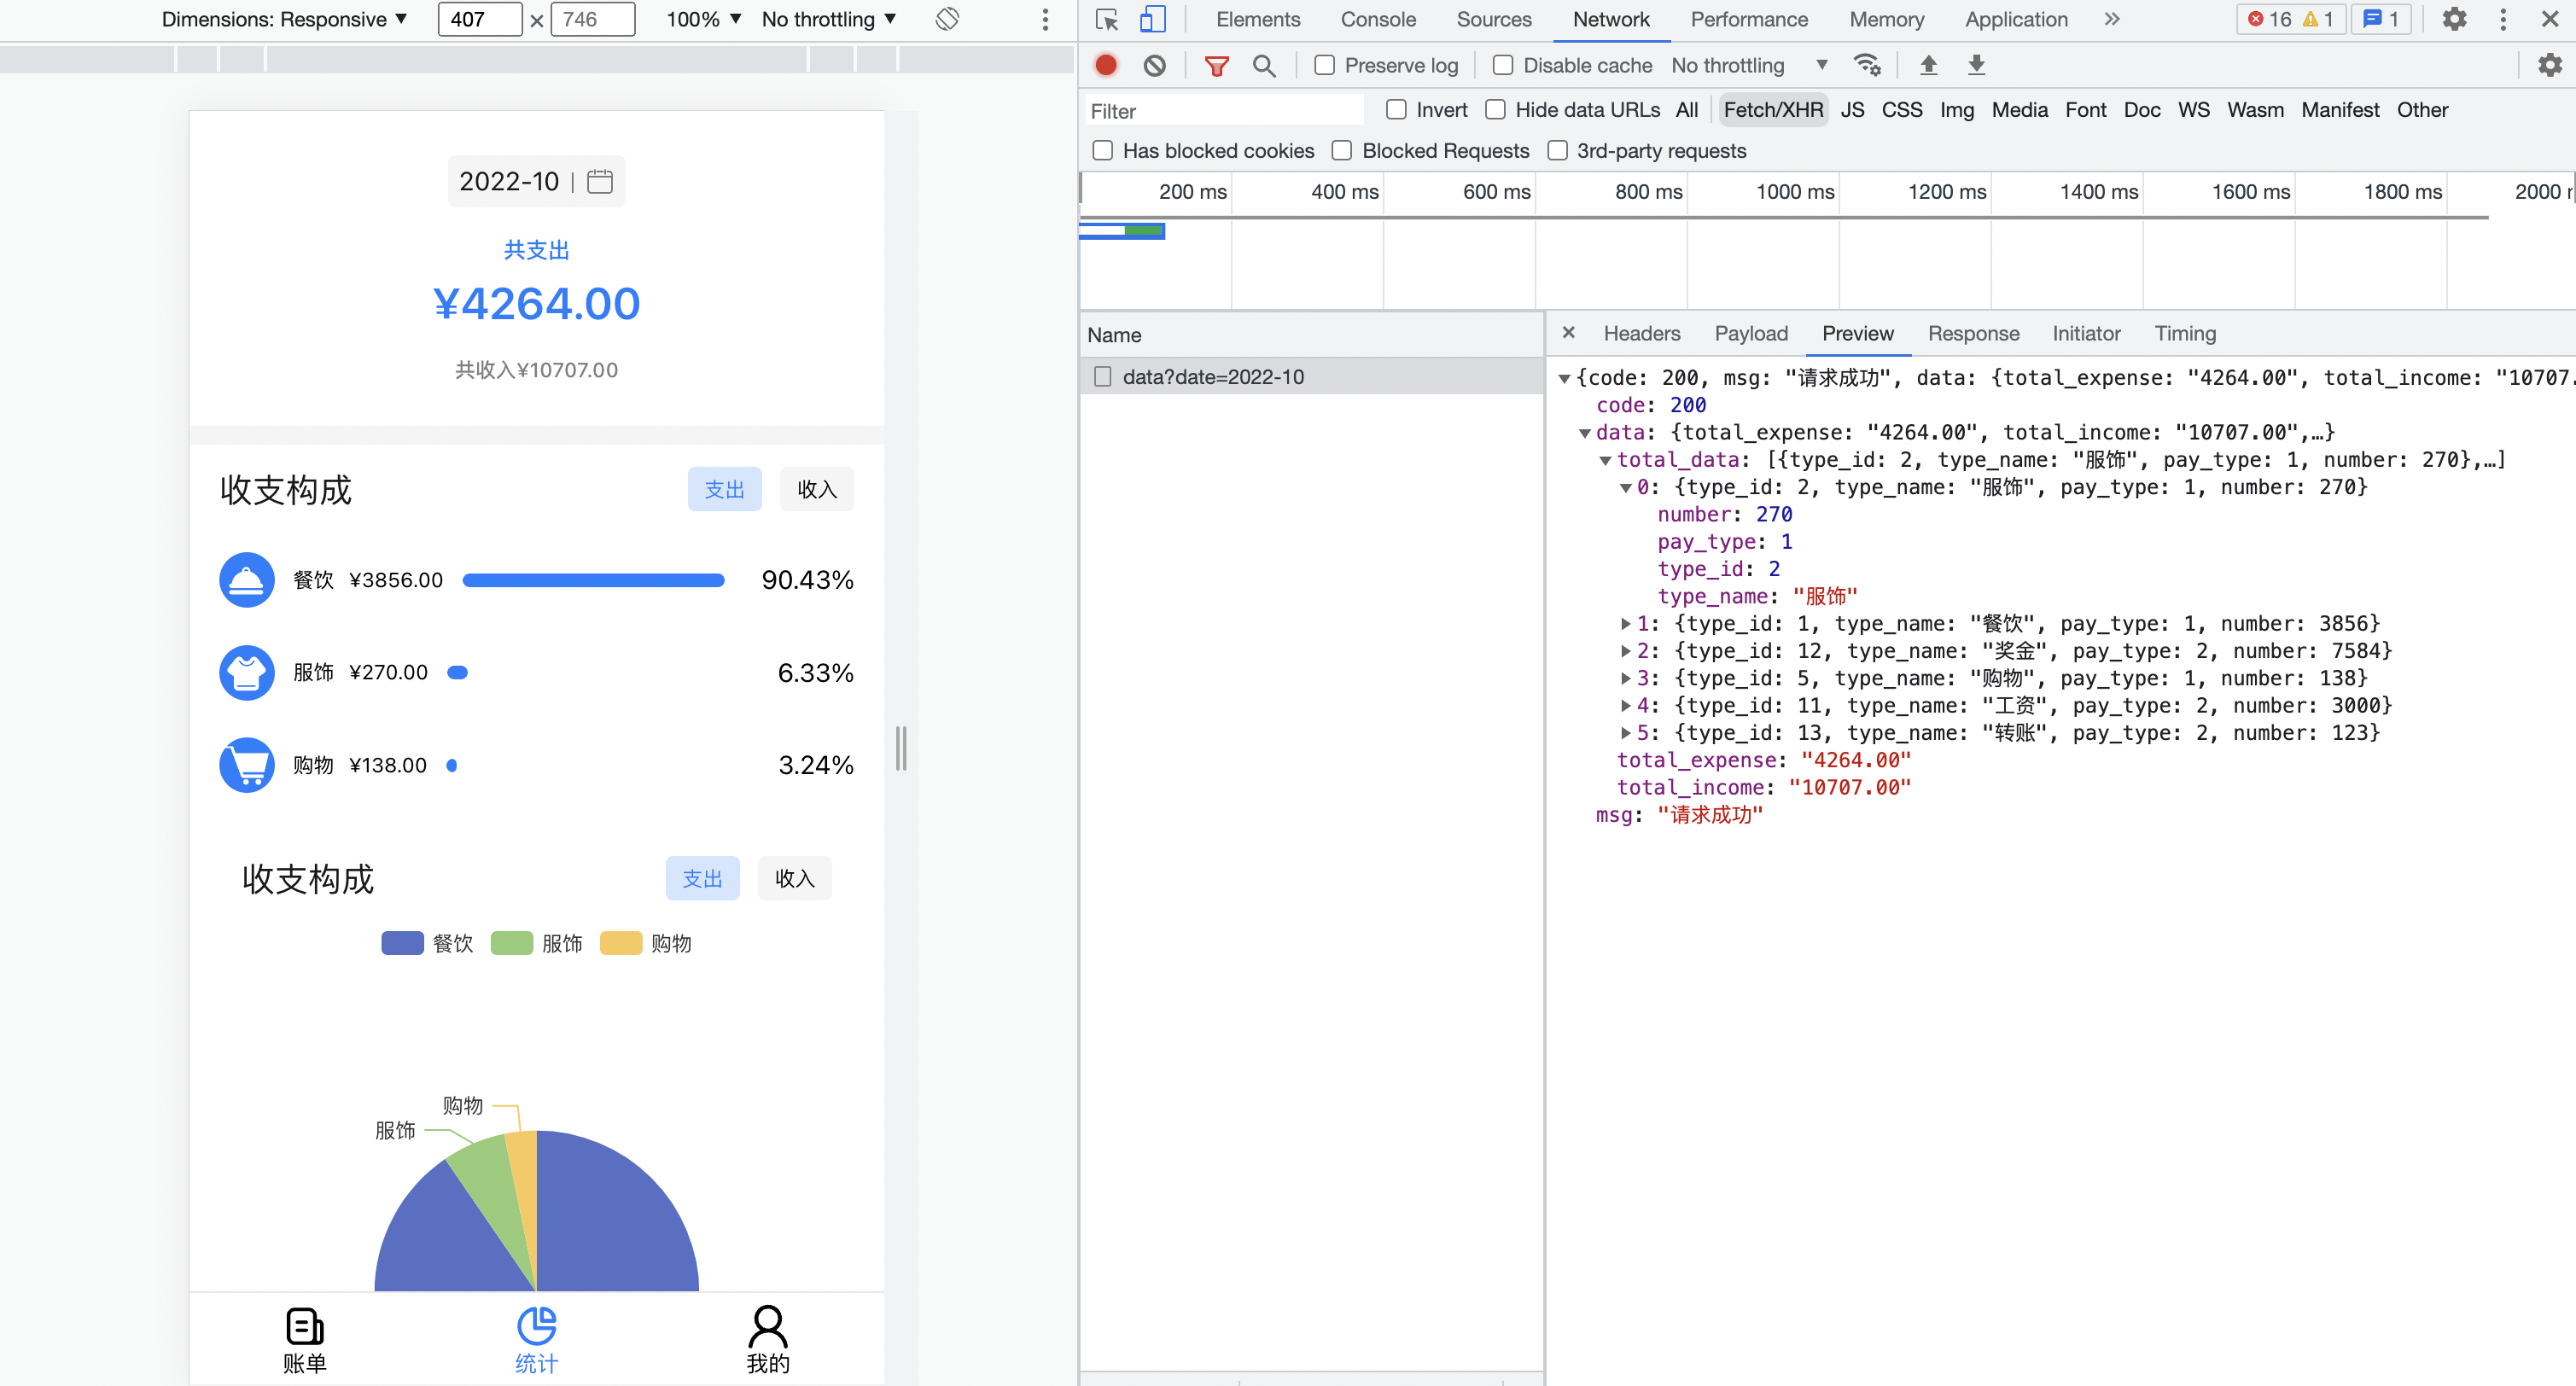
首先我们需要传递日期参数 date,才能正常获取该月份的数据。
并将数据进行二次处理,将「收入」和「支出」分成两个数组保存。
通过 changeTotalType 方法,切换展示「收入」或「支出」。
通过对 Progress 组件的样式二次修改,样式代码如下:
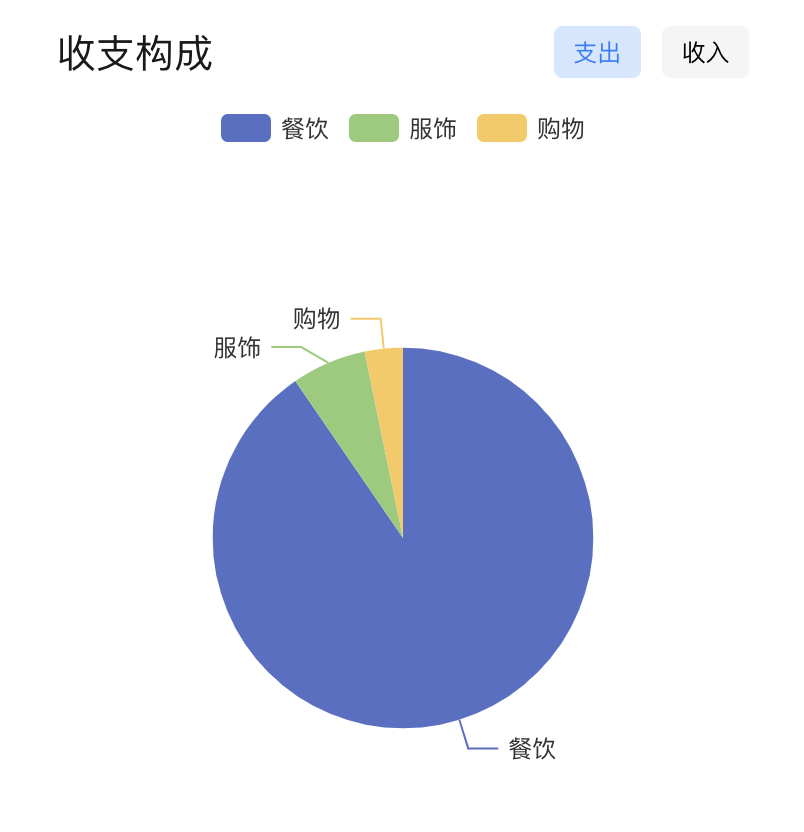
饼图制作
接下来我们尝试引入 Echart,我们不通过 npm 引入它,我们尝试引入它的静态资源,找到根目录下的 index.html,添加如下代码:
<!DOCTYPE html><html lang="en"><head><meta charset="UTF-8" /><link rel="icon" sizes="32x32" href="https://p1-jj.byteimg.com/tos-cn-i-t2oaga2asx/gold-assets/favicons/v2/favicon-32x32.png~tplv-t2oaga2asx-image.image"><meta name="viewport" content="width=device-width, initial-scale=1.0" /><title>掘掘手札</title></head><body><div id="root"></div><script src="//s.yezgea02.com/1609305532675/echarts.js"></script><script type="module" src="/src/main.jsx"></script></body></html>
这种引入方式,不会将 echart 打包到最终的入口脚本里。有同学会说可以按需引入,但是就算是按需引入,脚本也会变得很大,本身 echart 这类可视化工具库就非常大,因为内部使用了大量绘制图形的代码。
完成上述操作之后,我们尝试在 /Data/index.jsx 添加如下代码:
let proportionChart = null; // 用于存放 echart 初始化返回的实例const Data = () => {...const [pieType, setPieType] = useState('expense'); // 饼图的「收入」和「支出」控制useEffect(() => {getData();return () => {// 每次组件卸载的时候,需要释放图表实例。clear 只是将其清空不会释放。proportionChart.dispose();};}, [currentMonth]);// 绘制饼图方法const setPieChart = (data) => {if (window.echarts) {// 初始化饼图,返回实例。proportionChart = echarts.init(document.getElementById('proportion'));proportionChart.setOption({tooltip: {trigger: 'item',formatter: '{a} <br/>{b} : {c} ({d}%)'},// 图例legend: {data: data.map(item => item.type_name)},series: [{name: '支出',type: 'pie',radius: '55%',data: data.map(item => {return {value: item.number,name: item.type_name}}),emphasis: {itemStyle: {shadowBlur: 10,shadowOffsetX: 0,shadowColor: 'rgba(0, 0, 0, 0.5)'}}}]})};};// 获取数据详情const getData = async () => {// ...// 绘制饼图setPieChart(pieType == 'expense' ? expense_data : income_data);};// 切换饼图收支类型const changePieType = (type) => {setPieType(type);// 重绘饼图setPieChart(type == 'expense' ? expenseData : incomeData);}return <div className={s.data}>...<div className={s.structure}><div className={s.proportion}><div className={s.head}><span className={s.title}>收支构成</span><div className={s.tab}><span onClick={() => changePieType('expense')} className={cx({ [s.expense]: true, [s.active]: pieType == 'expense' })}>支出</span><span onClick={() => changePieType('income')} className={cx({ [s.income]: true, [s.active]: pieType == 'income' })}>收入</span></div></div>{/* 这是用于放置饼图的 DOM 节点 */}<div id="proportion"></div></div></div></div>}
切换饼图「收入」和「支出」这里,使用了一个小技巧,每次调用 setPieChart 的时候,会将数据重新传入,此时的数据是经过 changePieType 接收的参数进行筛选的,如果形参 type 的值为 expense,那么给 setPieChart 传的参数为 expenseData,反之则为 incomeData。
注意,在页面销毁前,需要将实例清除。在 useEffect 内 return 一个函数,该函数就是在组件销毁时执行,在函数内部执行 proportionChart.dispose(); 对实例进行销毁操作。
最后,我们将头部的数据补上,如下所示:
<div className={s.expense}>¥{ totalExpense }</div><div className={s.income}>共收入¥{ totalIncome }</div>
以上就是账单统计的全部实现

若有收获,就点个赞吧
0 人点赞
