构建高性能服务起因
日常开发中,多数通过pm2部署node应用,pm2会默认启动多个进程。
pm2的实现原理是基于Cluster模式的封装。
由于node是单线程,有一个线程出现错误,就会引起整个进程奔溃,也即是整个服务宕机。
node可以通过cluster模块创建多个子进程,利用服务器的多核cpu启动多个子进程,当一个进程出现错误停掉,会调用其他进程,来保障服务的稳定性。
创建web服务
新建app.js,通过http模块创建web服务。
const http = require("http");const server = http.createServer((req, res) => {Math.random() > 0.95 ? err() : "random";res.end("hello world!");});const err = ()=>{console.error("error")throw new Error("出现错误")}// !module.parent在没有require的情况下执行运行下面代码,有被require则运行elseif (!module.parent) {server.listen(3000, () => {console.log("listen on port 3000");});} else {module.exports = server;}
创建web服务,端口3000。
然后通过axios定时循环访问该端口。
创建test.js测试文件
const axios = require("axios");setInterval(async function () {const response = await axios.get("http://localhost:3000");console.log("请求的返回值", response.data);}, 1000);
node的cluster模块
cluster模块可以创建多个工作线程共享同一个TCP连接。
cluster.fork创建的工作线程可以共享同一个端口,node在底层处理了net网络模块进行判断,如果是cluster创建的线程会进行兼容。
但是child_process模块的fork,无法共享同一端口。
cluster会创建一个主master,根据指定的数量创建多个server app,它们内部通过IPC通道与工作线程之间进行通信,并使用内置的负载均衡处理线程直接的压力,该负载均衡使用了Round-robin算法。
当使用Round-robin调度策略时,master接收所有传入的连接请求,然后将相应的TCP请求处理发送给选中的工作线程。
创建cluster.js
const cluster = require("cluster");const os = require("os");// 判断服务器有多少核cpuconst cpuNum = os.cpus().length;const process = require("process");const workers = {};// 初始创建主进程if (cluster.isMaster) {for (let i = 0; i < cpuNum; i++) {// 根据cpu数量,fork出多个子进程const worker = cluster.fork();workers[worker.process.pid] = worker;console.log("工作进程启动", worker.process.pid);}// 监听子进程的状态,如果出错退出,则删除该进程pidcluster.on("exit", (worker, code, signal) => {console.log("工作进程close", worker.process.pid);delete workers[worker.process.pid];worker = cluster.fork();workers[worker.process.pid] = worker;});} else {// 通过子进行启动端口为3000的服务,cluster.fork的进程可以共享端口const app = require("./app.js");app.listen(3000);}// SIGTERM表示结束主进程,相当于ctrl+c结束程序,process.on("SIGTERM", () => {for (var pid in workers) {process.kill(pid);}// 正常退出,code为0process.exit(0);});// 调用test,通过axios重复不断访问http://localhost:3000/require("./test.js");
运行node cluster.js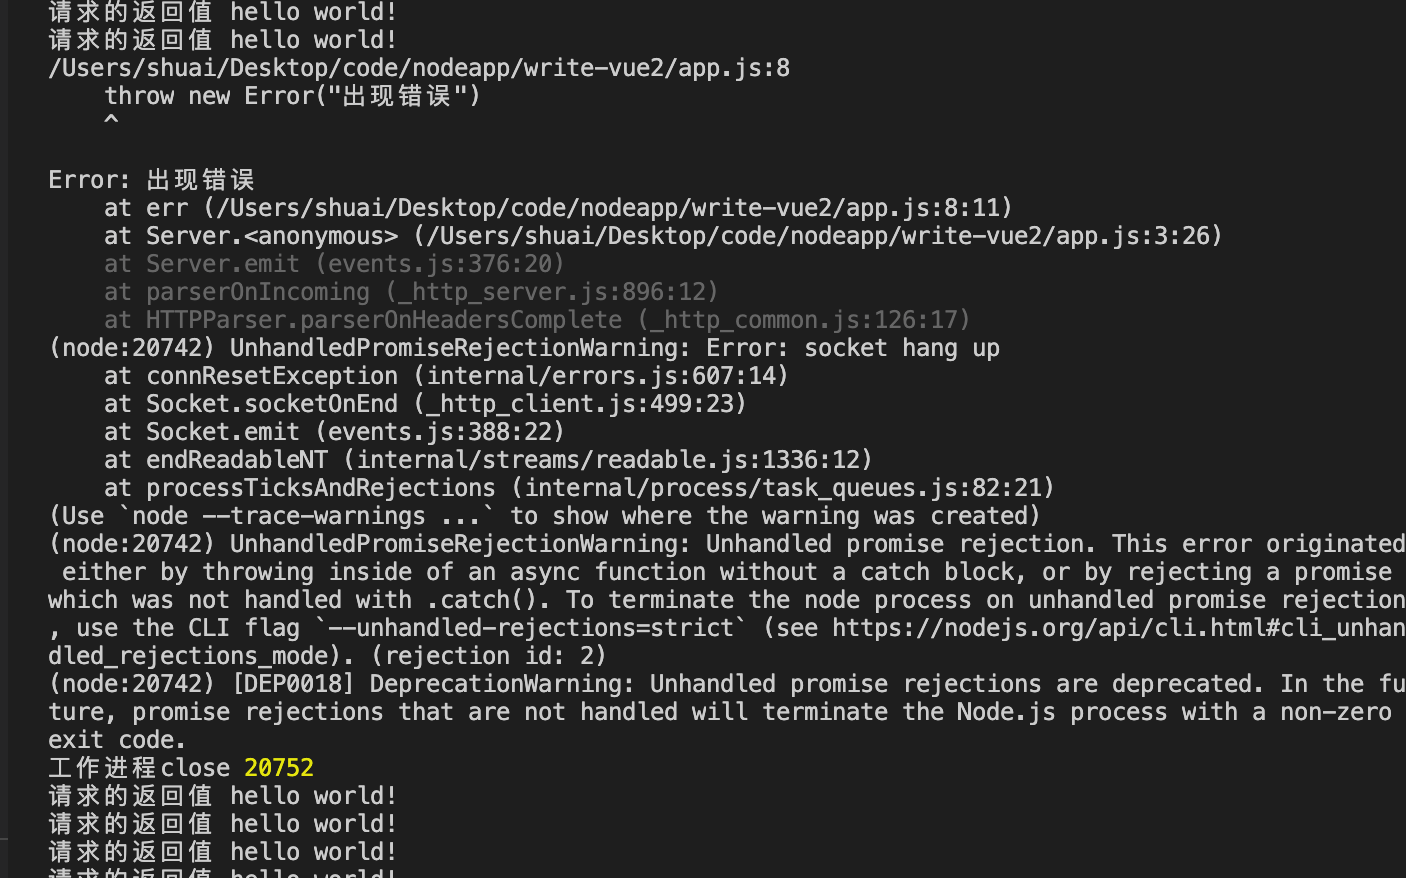
即使一个进程出现错误,还有其它进程在执行。这样就可以解决node单线程出现错误无法访问的问题,并且还能提高并发数。
使用ab进行压力测试
ab -n2000 -c200 "http://10.21.102.0:3000/"
进行ab测试,需要调整下代码
- 注释掉cluster.js的38行,不引用test文件
- 注释掉app.js第3行,不抛出错误
使用PM2启动node服务
PM2是node进程管理工具,可以利用它来简化很多node应用管理的繁琐任务,如性能监控、自动重启、负载均衡等
PM2常用操作命令
$ pm2 start app.js # ⭐️ 启动app.js应用程序$ pm2 start app.js -i 4 # ⭐️ cluster mode 模式启动4个app.js的应用实例# 4个应用程序会自动进行负载均衡$ pm2 start app.js --name="api" # 启动应用程序并命名为 "api"$ pm2 start app.js --watch # 当文件变化时自动重启应用$ pm2 start script.sh # 启动 bash 脚本$ pm2 list # 列表 PM2 启动的所有的应用程序$ pm2 monit # 显示每个应用程序的CPU和内存占用情况$ pm2 show [app-name] # 显示应用程序的所有信息$ pm2 logs # 显示所有应用程序的日志$ pm2 logs [app-name] # 显示指定应用程序的日志$ pm2 flush$ pm2 stop all # 停止所有的应用程序$ pm2 stop 0 # 停止 id为 0的指定应用程序$ pm2 restart all # 重启所有应用$ pm2 reload all # 重启 cluster mode下的所有应用$ pm2 gracefulReload all # Graceful reload all apps in cluster mode$ pm2 delete all # 关闭并删除所有应用$ pm2 delete 0 # 删除指定应用 id 0$ pm2 scale api 10 # ⭐️把名字叫api的应用扩展到10个实例$ pm2 reset [app-name] # 重置重启数量$ pm2 startup # ⭐️创建开机自启动命令$ pm2 save # ⭐️保存当前应用列表$ pm2 resurrect # 重新加载保存的应用列表$ pm2 update # Save processes, kill PM2 and restore processes$ pm2 generate # Generate a sample json configuration file
开启http服务
创建server.js文件,通过http模块启动一个web服务
const http = require('http')http.createServer((req, res) => {for (let i = 0; i < 1e7; i++) { }res.writeHead(200)res.end('hello')}).listen(3333)
通过PM2启动服务
pm2 start server.js -i 4
-i
通过PM2启动的node服务不用担心服务停掉,如果一个线程出现问题,其它线程会立即重启。
实时扩展集群
pm2 scale server +2
使用ab工具进行测试
先是不开启多线程,命令行输入node server.js
用ab压测 ab -n 1000 -c 100 http://localhost:3333/,这条测试命令的意思是一共发送1000个请求,每秒100并发
得到如下结果
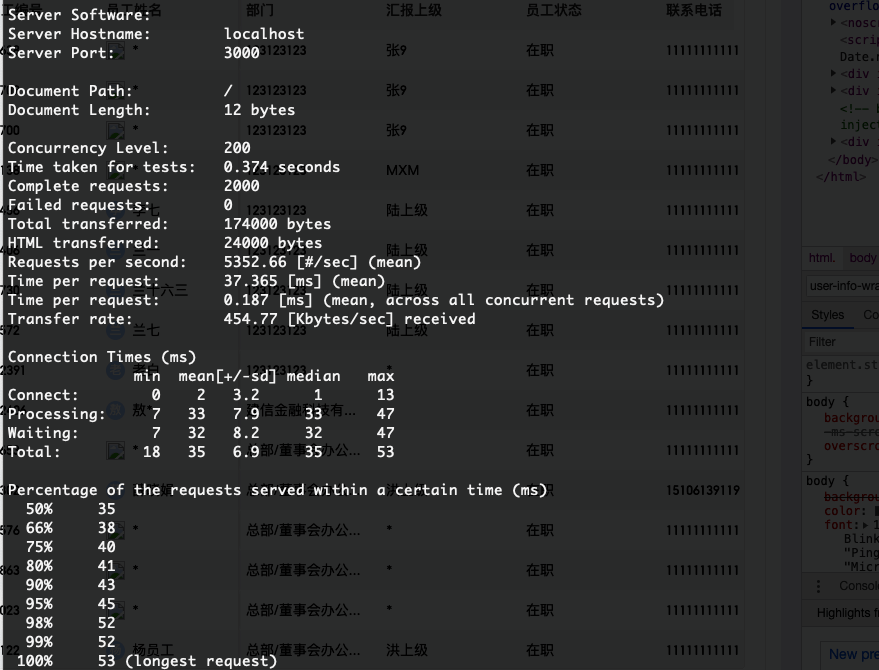
Server Software:Server Hostname: localhostServer Port: 3333Document Path: ///第一个成功返回的文档的字节大小Document Length: 11 bytes// 并发数Concurrency Level: 200// 从建立连接到最后接受完成总时间Time taken for tests: 6.643 seconds// 完成请求数Complete requests: 2000Failed requests: 0// 从服务器接收的字节总数Total transferred: 172000 bytes// HTML接收字节数,减去了Total transferred中HTTP响应数据中的头信息的长度HTML transferred: 22000 bytes// 吞吐率:每秒请求数(总请求数/总时间,相当于LR中的每秒事务数TPS)Requests per second: 301.07 [#/sec] (mean)// 用户平均请求等待时间Time per request: 664.303 [ms] (mean)// 服务器处理每个请求平均响应时间,mean表示为平均值Time per request: 3.322 [ms] (mean, across all concurrent requests)// 这些请求在单位时间内从服务器获取的数据长度Transfer rate: 25.28 [Kbytes/sec] received// 连接消耗时间分解Connection Times (ms)min mean[+/-sd] median max最小值 平均值 标准差 中间值 最大值Connect: 0 14 128.0 1 1288Processing: 26 626 173.3 619 1240Waiting: 15 361 137.7 350 844Total: 26 641 216.2 621 1929Percentage of the requests served within a certain time (ms)// 50%请求完成时间的最大值是621毫秒50% 62166% 63075% 64580% 665// 90%请求完成时间的最大值是914毫秒90% 91495% 107698% 124099% 1928// 100%请求完成时间的最大值是1929毫秒(最长请求100% 1929 (longest request)
看到服务端的QPS【Requests per second】是301左右
进行扩容
pm2 start server.js -i max
Server Software:Server Hostname: localhostServer Port: 3333Document Path: /Document Length: 11 bytesConcurrency Level: 200Time taken for tests: 1.946 secondsComplete requests: 2000Failed requests: 0Total transferred: 172000 bytesHTML transferred: 22000 bytesRequests per second: 1027.97 [#/sec] (mean)Time per request: 194.559 [ms] (mean)Time per request: 0.973 [ms] (mean, across all concurrent requests)Transfer rate: 86.33 [Kbytes/sec] receivedConnection Times (ms)min mean[+/-sd] median maxConnect: 0 6 19.1 0 72Processing: 33 178 31.4 187 227Waiting: 17 168 36.3 180 217Total: 34 184 19.3 187 228Percentage of the requests served within a certain time (ms)50% 18766% 19175% 19580% 19790% 20295% 20698% 21399% 217100% 228 (longest request)
服务端的QPS1027提升3倍多,启动的8核进程。

若有收获,就点个赞吧
0 人点赞
