作者:Zuguang Gu8
编译:Steven Shen
原文:Heatmap Decoration
第六章 热图装饰
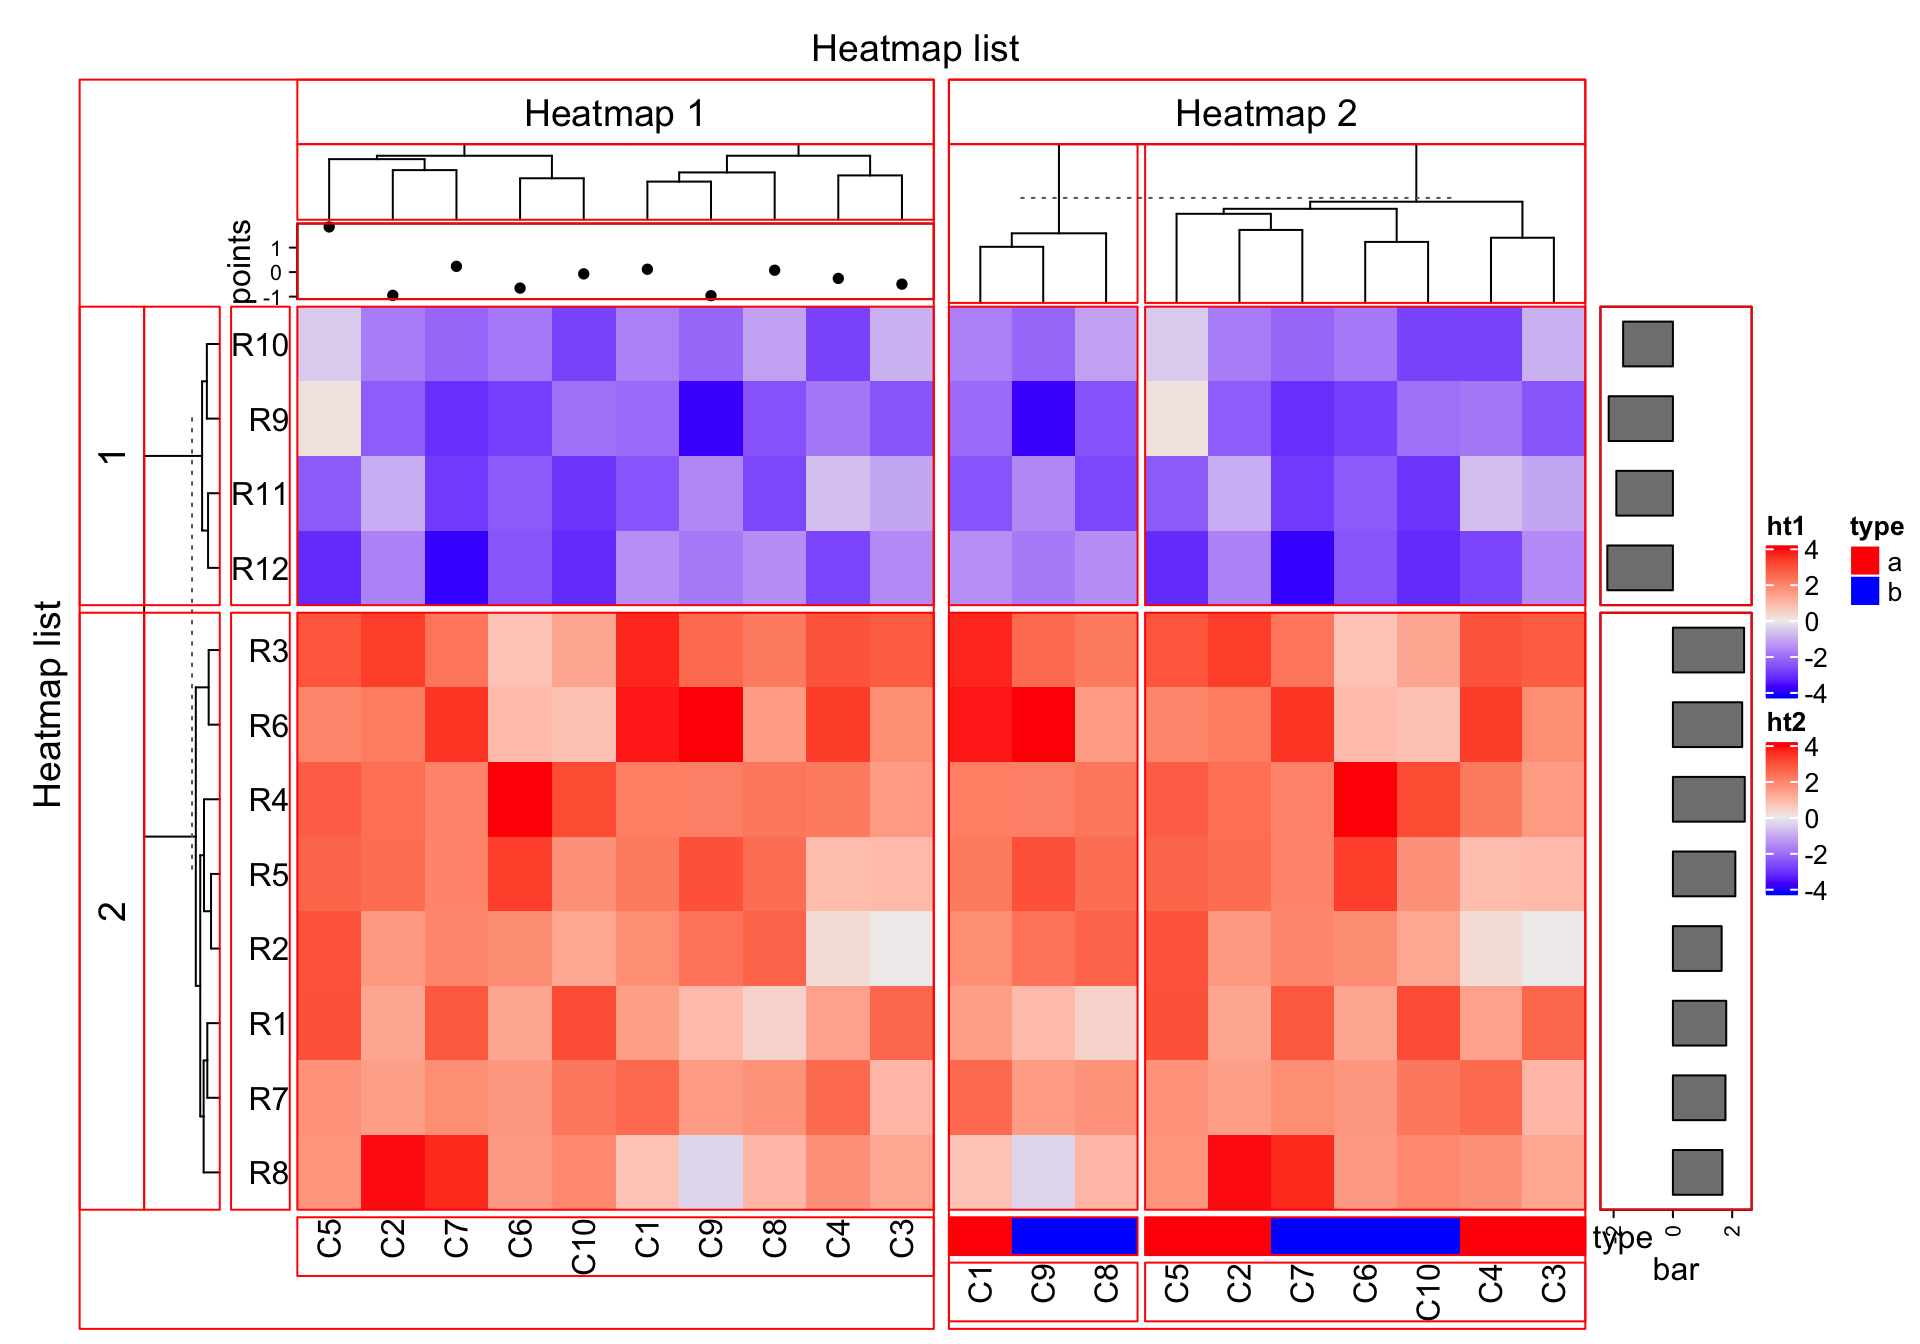
The plotting region for each heatmap component is still kept after the heatmaps are made, so it is possible to go back to the original places to add more graphics there. First let’s generate a figure that almost contains all types of heatmap components.
list_components()lists the names of the heatmap/annotation components (or the name of the viewport).
set.seed(123)mat = matrix(rnorm(80, 2), 8, 10)mat = rbind(mat, matrix(rnorm(40, -2), 4, 10))rownames(mat) = paste0("R", 1:12)colnames(mat) = paste0("C", 1:10)ha_column1 = HeatmapAnnotation(points = anno_points(rnorm(10)),annotation_name_side = "left")ht1 = Heatmap(mat, name = "ht1", km = 2, column_title = "Heatmap 1",top_annotation = ha_column1, row_names_side = "left")ha_column2 = HeatmapAnnotation(type = c(rep("a", 5), rep("b", 5)),col = list(type = c("a" = "red", "b" = "blue")))ht2 = Heatmap(mat, name = "ht2", row_title = "Heatmap 2", column_title = "Heatmap 2",bottom_annotation = ha_column2, column_km = 2)ht_list = ht1 + ht2 +rowAnnotation(bar = anno_barplot(rowMeans(mat), width = unit(2, "cm")))draw(ht_list, row_title = "Heatmap list", column_title = "Heatmap list")list_components()## [1] "ROOT" "global"## [3] "global_layout" "global-heatmaplist"## [5] "main_heatmap_list" "heatmap_ht1"## [7] "ht1_heatmap_body_wrap" "ht1_heatmap_body_1_1"## [9] "ht1_heatmap_body_2_1" "ht1_column_title_1"## [11] "ht1_row_title_1" "ht1_row_title_2"## [13] "ht1_dend_row_1" "ht1_dend_row_2"## [15] "ht1_dend_column_1" "ht1_row_names_1"## [17] "ht1_row_names_2" "ht1_column_names_1"## [19] "annotation_points_1" "heatmap_ht2"## [21] "ht2_heatmap_body_wrap" "ht2_heatmap_body_1_1"## [23] "ht2_heatmap_body_1_2" "ht2_heatmap_body_2_1"## [25] "ht2_heatmap_body_2_2" "ht2_column_title_1"## [27] "ht2_dend_column_1" "ht2_dend_column_2"## [29] "ht2_column_names_1" "ht2_column_names_2"## [31] "annotation_type_1" "annotation_type_2"## [33] "heatmap_heatmap_annotation_2" "annotation_bar_1"## [35] "annotation_bar_2" "global-column_title_top"## [37] "global_column_title" "global-row_title_left"## [39] "global_row_title" "global-heamap_legend_right"## [41] "heatmap_legend" "global-annotation_legend_right"## [43] "annotation_legend"

Basically the red regions in above plot can be revisited by
decorate_*()functions.

