作者:Zuguang Gu8
编译:Steven Shen
原文:Vertical concatenation
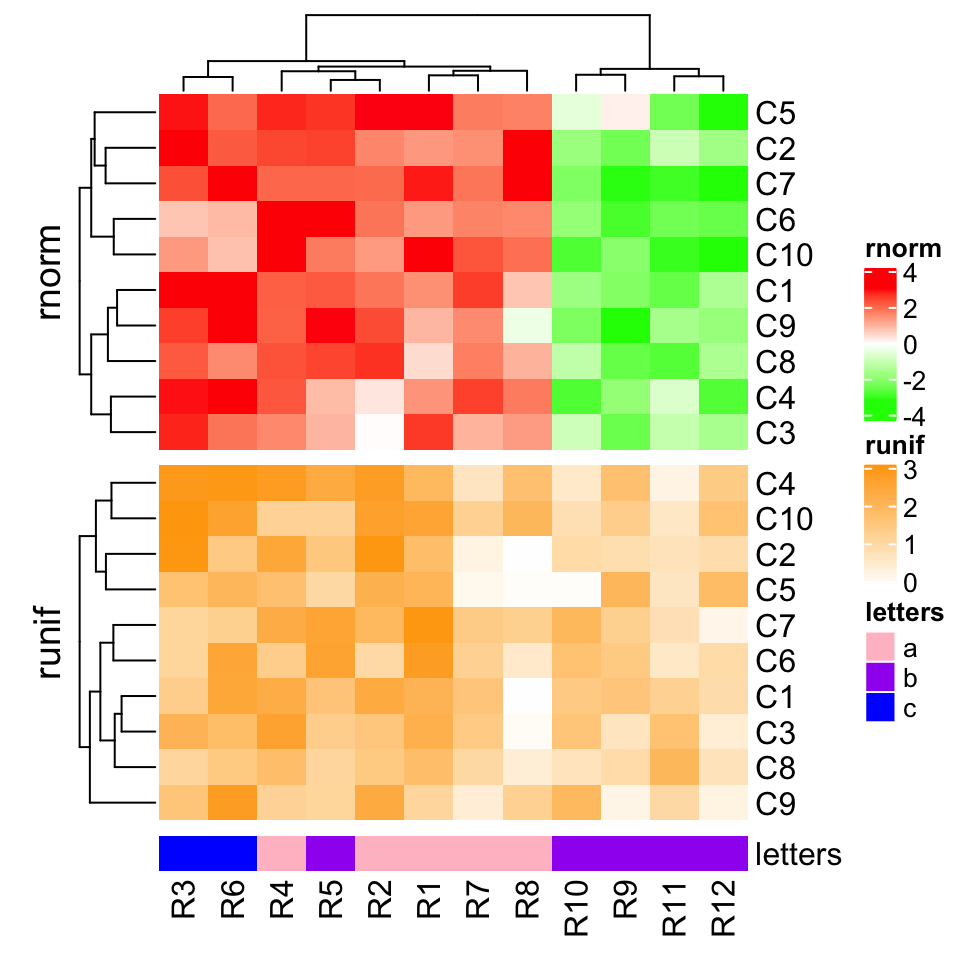
Heatmaps and annotations (now it is column annotation) can be concatenated vertically by the
%v%operator. All the relatated settings and adjustments are very similar as the horizontal concatenation. Please check following examples.
mat1t = t(mat1)mat2t = t(mat2)ht1 = Heatmap(mat1t, name = "rnorm", col = col_rnorm, row_title = "rnorm")ht2 = Heatmap(mat2t, name = "runif", col = col_runif, row_title = "runif")ht3 = Heatmap(rbind(letters = le), name = "letters", col = col_letters)ht_list = ht1 %v% ht2 %v% ht3draw(ht_list)
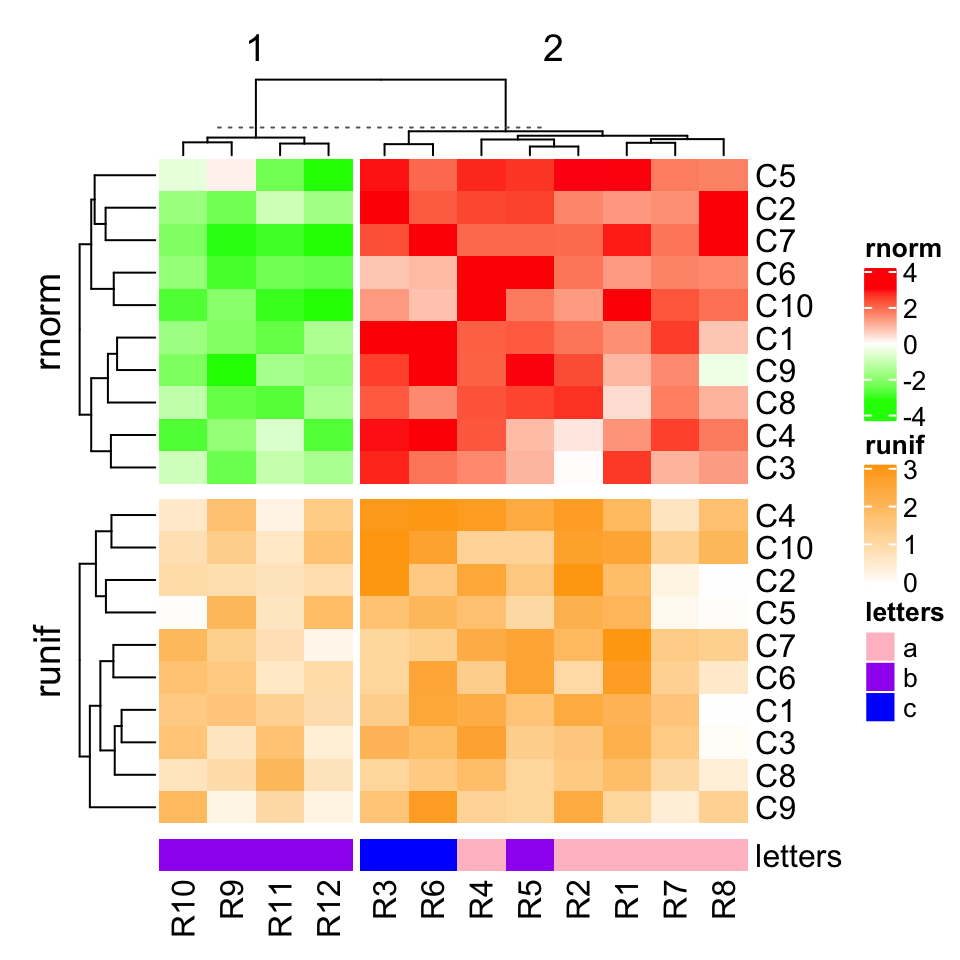
draw(ht_list, column_km = 2)
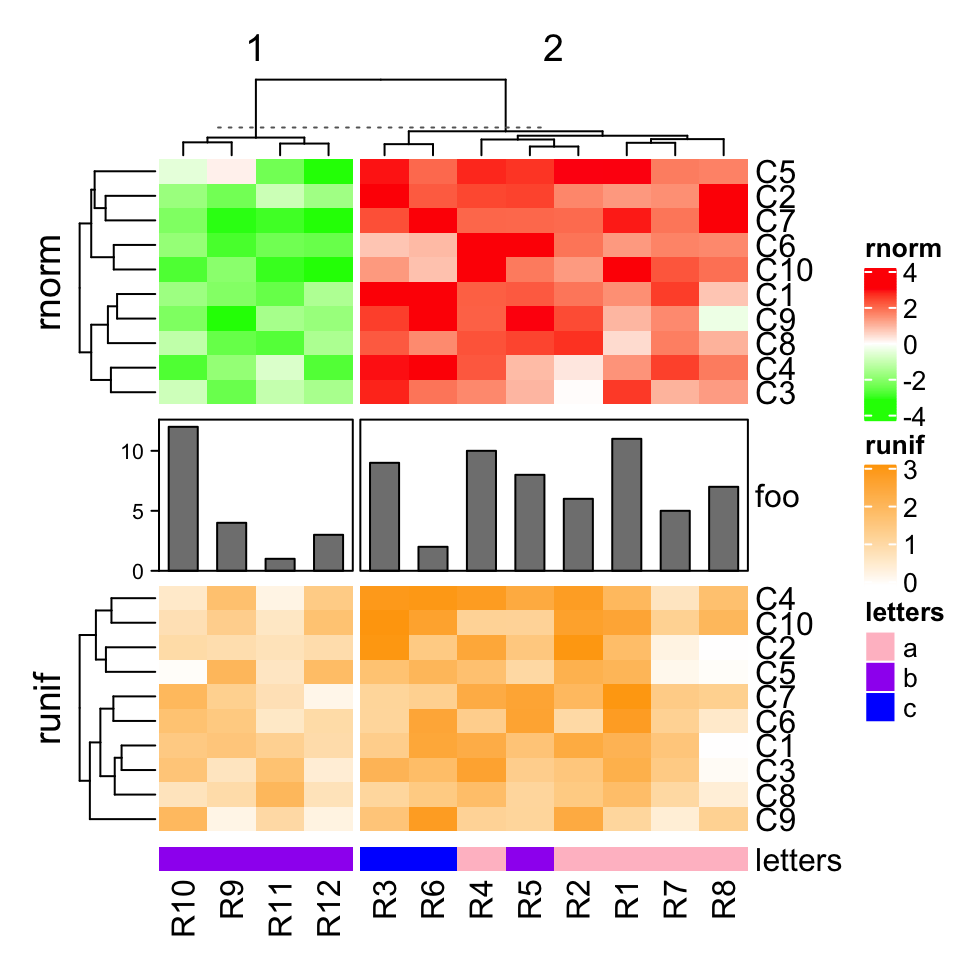
ha = HeatmapAnnotation(foo = anno_barplot(1:12, height = unit(2, "cm")))ht_list = ht1 %v% ha %v% ht2 %v% ht3draw(ht_list, column_km = 2)
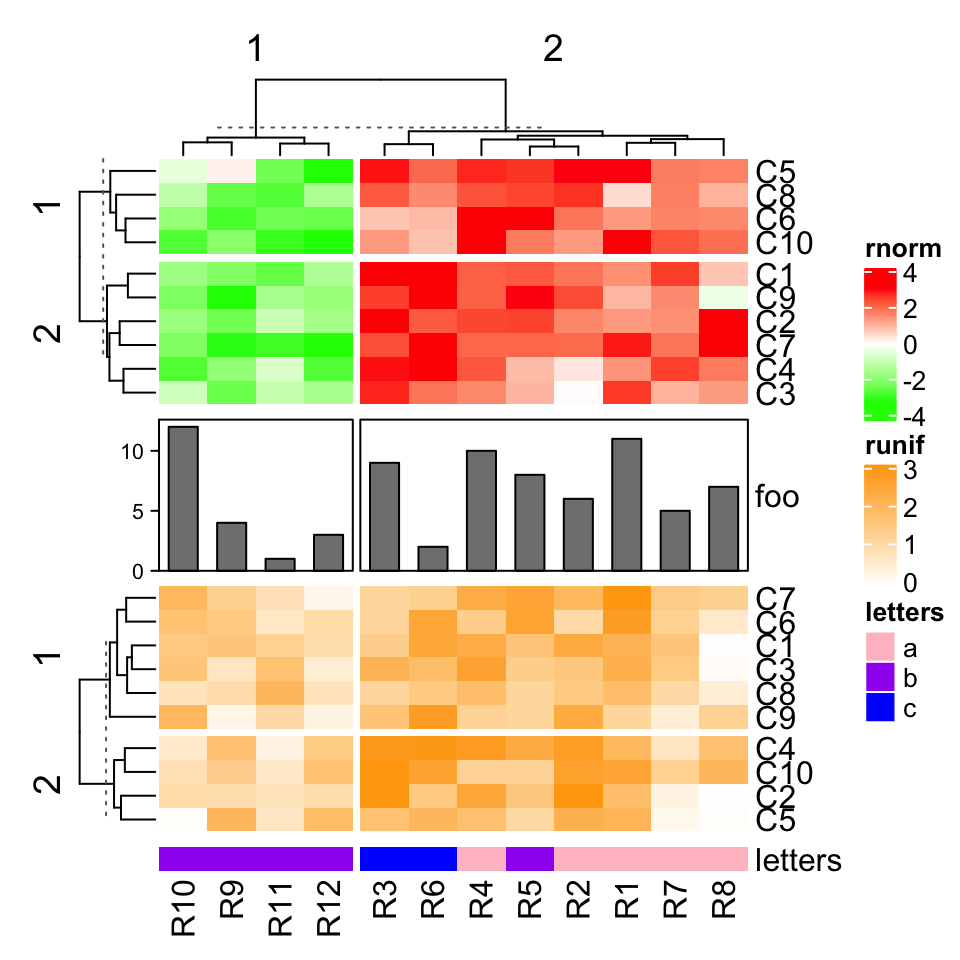
ht1 = Heatmap(mat1t, name = "rnorm", col = col_rnorm, row_km = 2)ht2 = Heatmap(mat2t, name = "runif", col = col_runif, row_km = 2)ht3 = Heatmap(rbind(letters = le), name = "letters", col = col_letters)ha = HeatmapAnnotation(foo = anno_barplot(1:12, height = unit(2, "cm")))ht_list = ht1 %v% ha %v% ht2 %v% ht3draw(ht_list, column_km = 2)
For the vertical heatmap list, now row annotations should be the heatmap components (by
right_annotationandleft_annotation) and they are adjusted just like column annotations for the horizontal heatmap list.
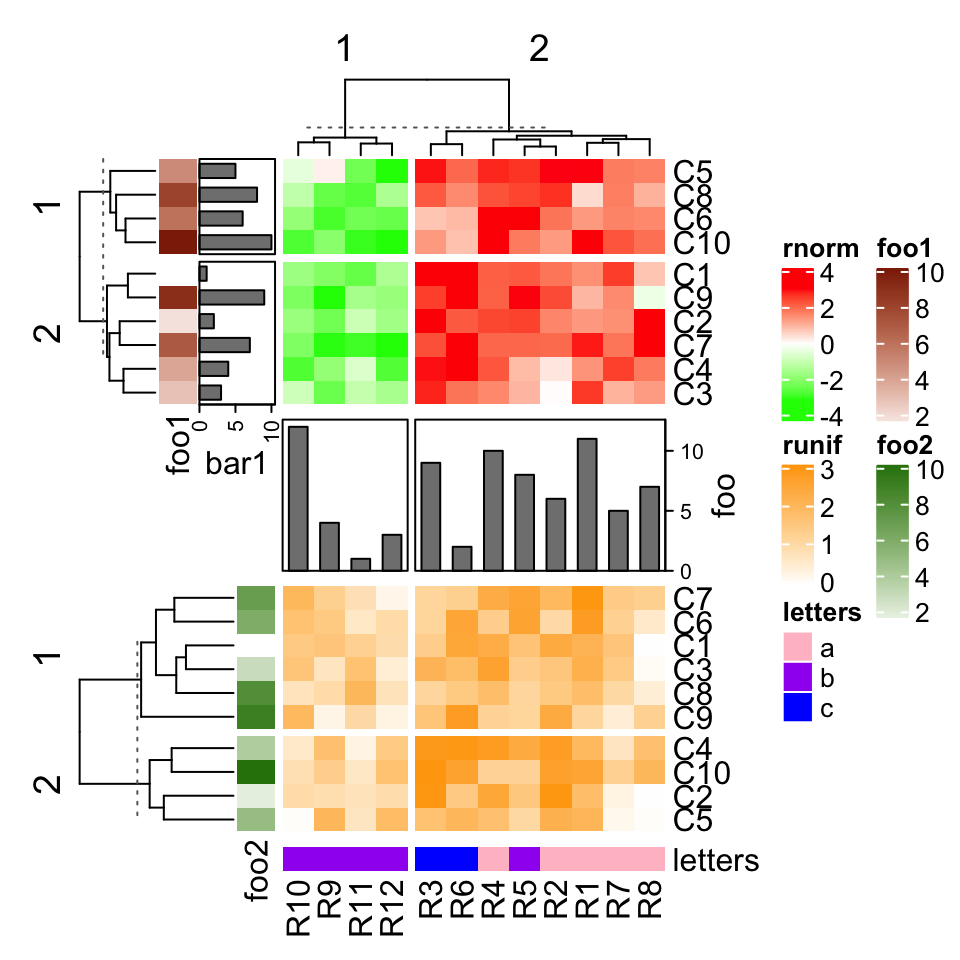
ht1 = Heatmap(mat1t, name = "rnorm", col = col_rnorm, row_km = 2,left_annotation = rowAnnotation(foo1 = 1:10, bar1 = anno_barplot(1:10)))ha = HeatmapAnnotation(foo = anno_barplot(1:12, height = unit(2, "cm"),axis_param = list(side = "right")))ht2 = Heatmap(mat2t, name = "runif", col = col_runif, row_km = 2,left_annotation = rowAnnotation(foo2 = 1:10))ht3 = Heatmap(rbind(letters = le), name = "letters", col = col_letters)ht_list = ht1 %v% ha %v% ht2 %v% ht3draw(ht_list, column_km = 2)
Since
rowAnnotation()allows arbitary number of annotations, the way showed above is the only way to expand the heatmap list horizontally and vertically at the same time.

若有收获,就点个赞吧
0 人点赞
