作者:Zuguang Gu8
编译:Steven Shen
原文:3.1 Simple annotation
A so-called “simple annotation” is the most used style of annotations which is heatmap-like or grid-like graphics where colors are used to map to the anntation values. To generate a simple annotation, you just simply put the annotation vector in
HeatmapAnnotation()with a specific name.
ha = HeatmapAnnotation(foo = 1:10)

Or a discrete annotation:
ha = HeatmapAnnotation(bar = sample(letters[1:3], 10, replace = TRUE))

You can use any strings as annotation names except those pre-defined arguments in
HeatmapAnnotation().If colors are not specified, colors are randomly generated. To set the colors for annotation,
colneeds to be set as a named list. For continuous values, the color mapping should be a color mapping function generated bycirclize::colorRamp2().
library(circlize)col_fun = colorRamp2(c(0, 5, 10), c("blue", "white", "red"))ha = HeatmapAnnotation(foo = 1:10, col = list(foo = col_fun))

And for discrete annotations, the color should be a named vector where names correspond to the levels in the annotation.
ha = HeatmapAnnotation(bar = sample(letters[1:3], 10, replace = TRUE),col = list(bar = c("a" = "red", "b" = "green", "c" = "blue")))

If you specify more than one vectors, there will be multiple annotations (
fooandbarin following example). Also you can see howcolis set whenfooandbarare all put into a singleHeatmapAnnotation(). Maybe now you can understand the names in the color list is actually used to map to the annotation names. Values incolwill be used to construct legends for simple annotations.
ha = HeatmapAnnotation(foo = 1:10,bar = sample(letters[1:3], 10, replace = TRUE),col = list(foo = col_fun,bar = c("a" = "red", "b" = "green", "c" = "blue")))

The color for
NAvalue is controlled byna_colargument.
ha = HeatmapAnnotation(foo = c(1:4, NA, 6:10),bar = c(NA, sample(letters[1:3], 9, replace = TRUE)),col = list(foo = col_fun,bar = c("a" = "red", "b" = "green", "c" = "blue")),na_col = "black")

gpmainly controls the graphic parameters for the borders of the grids.
ha = HeatmapAnnotation(foo = 1:10,bar = sample(letters[1:3], 10, replace = TRUE),col = list(foo = col_fun,bar = c("a" = "red", "b" = "green", "c" = "blue")),gp = gpar(col = "black"))

The simple annotation can also be a matrix (numeric or character) that all the columns in the matrix share a same color mapping schema. Note columns in the matrix correspond to the rows in the column annotation. Also the column names of the matrix are used as the annotation names.
ha = HeatmapAnnotation(foo = cbind(a = runif(10), b = runif(10)))

If the matrix has no column name, the name of the annotation is still used, but drawn in the middle of the annotation.
ha = HeatmapAnnotation(foo = cbind(runif(10), runif(10)))

As simple annotations can be in different modes (e.g. numeric, or character), they can be combined as a data frame and send to
dfargument. Imaging in your project, you might already have an annotation table, you can directly set it bydf.
anno_df = data.frame(foo = 1:10,bar = sample(letters[1:3], 10, replace = TRUE))ha = HeatmapAnnotation(df = anno_df,col = list(foo = col_fun,bar = c("a" = "red", "b" = "green", "c" = "blue")))

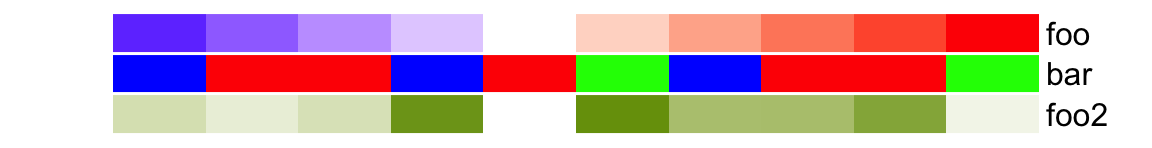
Single annotations and data frame can be mixed. In following example, colors for
foo2is not specified, random colors will be used.
ha = HeatmapAnnotation(df = anno_df,foo2 = rnorm(10),col = list(foo = col_fun,bar = c("a" = "red", "b" = "green", "c" = "blue")))
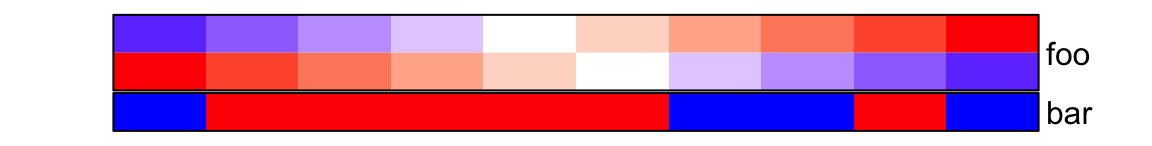
bordercontrols the border of every single annotation.
ha = HeatmapAnnotation(foo = cbind(1:10, 10:1),bar = sample(letters[1:3], 10, replace = TRUE),col = list(foo = col_fun,bar = c("a" = "red", "b" = "green", "c" = "blue")),border = TRUE)
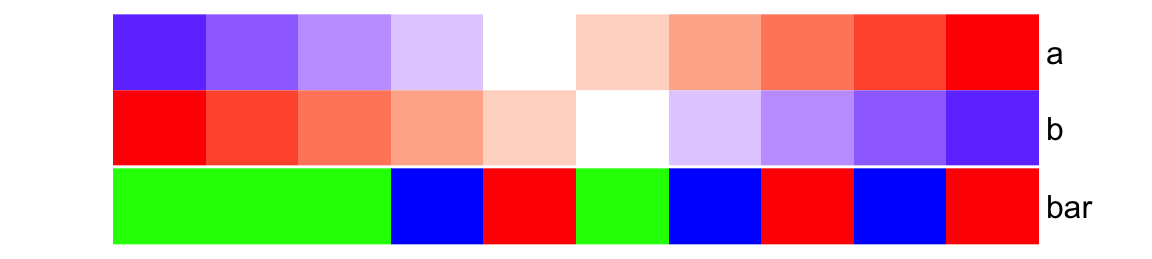
The height of the simple annotation is controlled by
simple_anno_sizeargument. Since all single annotations have same height, the value ofsimple_anno_sizeis a singleunitvalue. Note there are arguments likewidth,height,annotation_widthandannotation_height, but they are used to adjust the width/height for the complete heamtap annotations (which are always mix of several annotations). The adjustment of these four arguments will be introduced in Section 3.18.
ha = HeatmapAnnotation(foo = cbind(a = 1:10, b = 10:1),bar = sample(letters[1:3], 10, replace = TRUE),col = list(foo = col_fun,bar = c("a" = "red", "b" = "green", "c" = "blue")),simple_anno_size = unit(1, "cm"))
When you have multiple heatmaps and it is better to keep the size of simple annotations on all heatmaps with the same size.
ht_opt$simple_anno_sizecan be set to control the simple annotation size globally (It will be introduced in Section 4.13).

若有收获,就点个赞吧
0 人点赞
