作者:Zuguang Gu8
翻译:Steven Shen
原文:https://jokergoo.github.io/ComplexHeatmap-reference/book/oncoprint.html#define-the-alter-fun
alter_funis a list of functons which add graphics layer by layer (i.e. first draw forsnv, then forindel). Graphics can also be added in a grid-by-grid style by specifyingalter_funas a single function. The difference from the function list is nowalter_funshould accept a fifth argument which is a logical vector. This logical vector shows whether different alterations exist for current gene in current sample.Let’s assume in a grid there is only snv event, then
vfor this grid is:
## snv indel## TRUE FALSEoncoPrint(mat,alter_fun = function(x, y, w, h, v) {if(v["snv"]) grid.rect(x, y, w*0.9, h*0.9, # v["snv"] is a logical valuegp = gpar(fill = col["snv"], col = NA))if(v["indel"]) grid.rect(x, y, w*0.9, h*0.4, # v["indel"] is a logical valuegp = gpar(fill = col["indel"], col = NA))}, col = col)

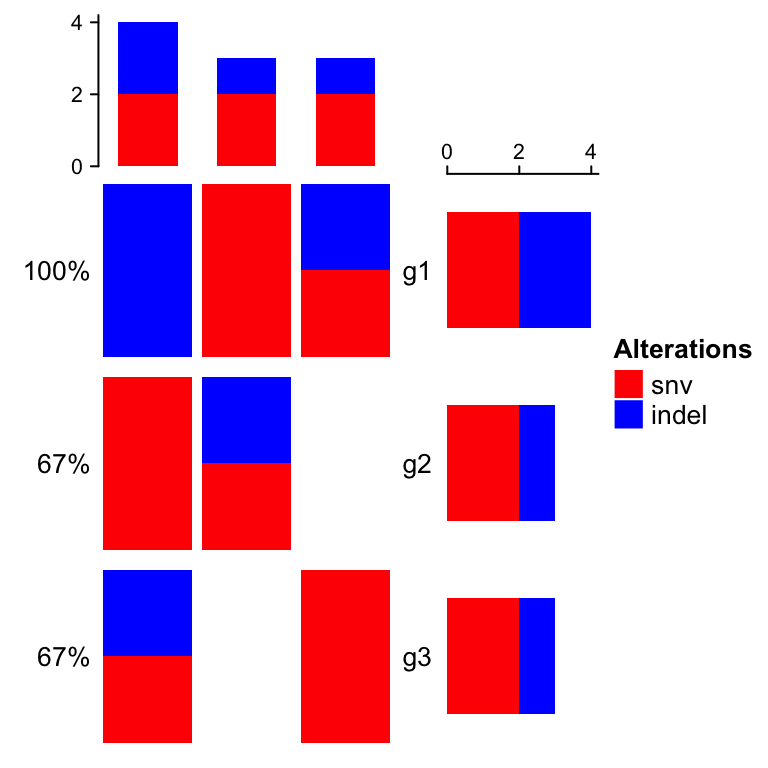
If alter_fun is set as a single function, customization can be more flexible. In following example, the blue rectangles can have different height in different grid.
oncoPrint(mat,alter_fun = function(x, y, w, h, v) {n = sum(v) # how many alterations for current gene in current sampleh = h*0.9# use `names(which(v))` to correctly map between `v` and `col`if(n) grid.rect(x, y - h*0.5 + 1:n/n*h, w*0.9, 1/n*h,gp = gpar(fill = col[names(which(v))], col = NA), just = "top")}, col = col)

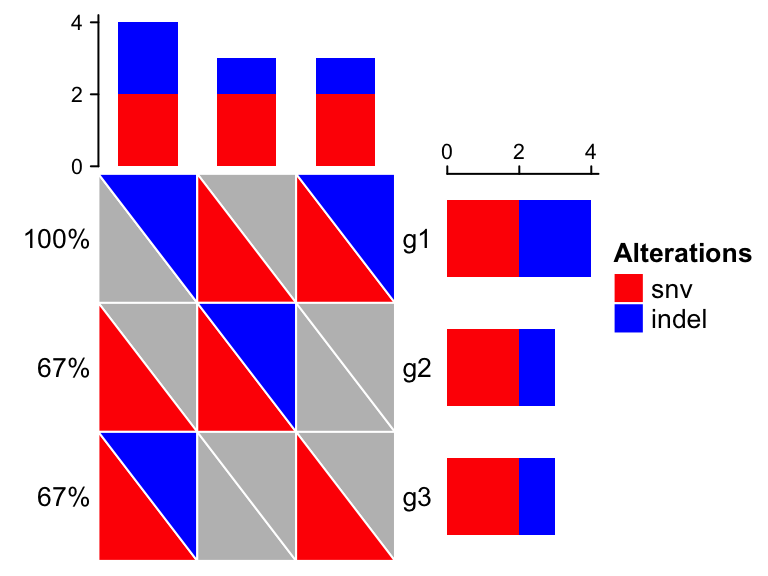
Following is a complicated example for alter_fun where triangles are used:
oncoPrint(mat,alter_fun = list(background = function(x, y, w, h) {grid.polygon(unit.c(x - 0.5*w, x - 0.5*w, x + 0.5*w),unit.c(y - 0.5*h, y + 0.5*h, y - 0.5*h),gp = gpar(fill = "grey", col = "white"))grid.polygon(unit.c(x + 0.5*w, x + 0.5*w, x - 0.5*w),unit.c(y + 0.5*h, y - 0.5*h, y + 0.5*h),gp = gpar(fill = "grey", col = "white"))},snv = function(x, y, w, h) {grid.polygon(unit.c(x - 0.5*w, x - 0.5*w, x + 0.5*w),unit.c(y - 0.5*h, y + 0.5*h, y - 0.5*h),gp = gpar(fill = col["snv"], col = "white"))},indel = function(x, y, w, h) {grid.polygon(unit.c(x + 0.5*w, x + 0.5*w, x - 0.5*w),unit.c(y + 0.5*h, y - 0.5*h, y + 0.5*h),gp = gpar(fill = col["indel"], col = "white"))}), col = col)

In some cases, you might need to define
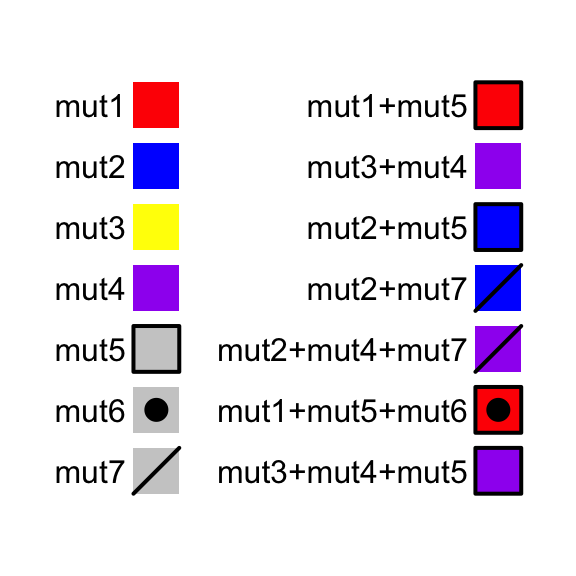
alter_funfor many alteration types. If you are not sure about the visual effect of youralter_fun, you can usetest_alter_fun()to test youralter_fun. In following example, we defined seven alteration functions:
alter_fun = list(mut1 = function(x, y, w, h)grid.rect(x, y, w, h, gp = gpar(fill = "red", col = NA)),mut2 = function(x, y, w, h)grid.rect(x, y, w, h, gp = gpar(fill = "blue", col = NA)),mut3 = function(x, y, w, h)grid.rect(x, y, w, h, gp = gpar(fill = "yellow", col = NA)),mut4 = function(x, y, w, h)grid.rect(x, y, w, h, gp = gpar(fill = "purple", col = NA)),mut5 = function(x, y, w, h)grid.rect(x, y, w, h, gp = gpar(fill = NA, lwd = 2)),mut6 = function(x, y, w, h)grid.points(x, y, pch = 16),mut7 = function(x, y, w, h)grid.segments(x - w*0.5, y - h*0.5, x + w*0.5, y + h*0.5, gp = gpar(lwd = 2)))test_alter_fun(alter_fun)## `alter_fun` is defined as a list of functions.## Functions are defined for following alteration types:## mut1, mut2, mut3, mut4, mut5, mut6, mut7

For the combination of alteration types,
test_alter_fun()randomly samples some of them.
test_alter_fun()works both foralter_funas a list and as a single function.

