作者:Zuguang Gu8
编译:Steven Shen
原文:2.2 Titles
The title of the heatmap basically tells what the plot is about. In ComplexHeatmap package, you can set heatmap title either by the row or/and by the column. Note at a same time you can only put e.g. column title either on the top or at the bottom of the heatmap.
热图的标题基本上说明了绘图的内容。在 ComplexHeatmap 包中,您可以按行 或/和 列设置热图标题。注意同时你只能把,例如,列标题位于热图的顶部或底部。
The graphic parameters can be set by row_title_gp and column_title_gp respectively. Please remember you should use gpar() to specify graphic parameters.
图形参数可以分别由 row_title_gp 和 column_title_gp 设置。请记住,您应该使用 gpar() 来指定图形参数。
Heatmap(mat, name = "mat", column_title = "I am a column title",row_title = "I am a row title")

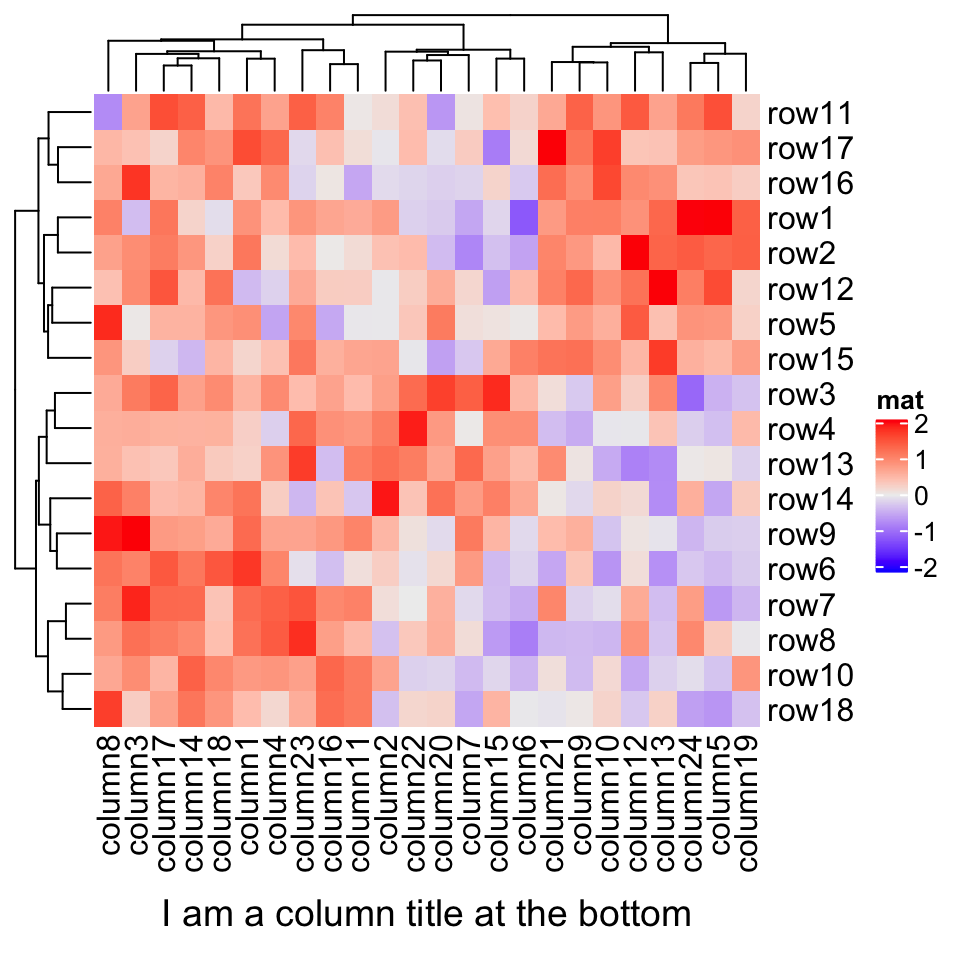
Heatmap(mat, name = "mat", column_title = "I am a column title at the bottom",column_title_side = "bottom")
Heatmap(mat, name = "mat", column_title = "I am a big column title",column_title_gp = gpar(fontsize = 20, fontface = "bold"))

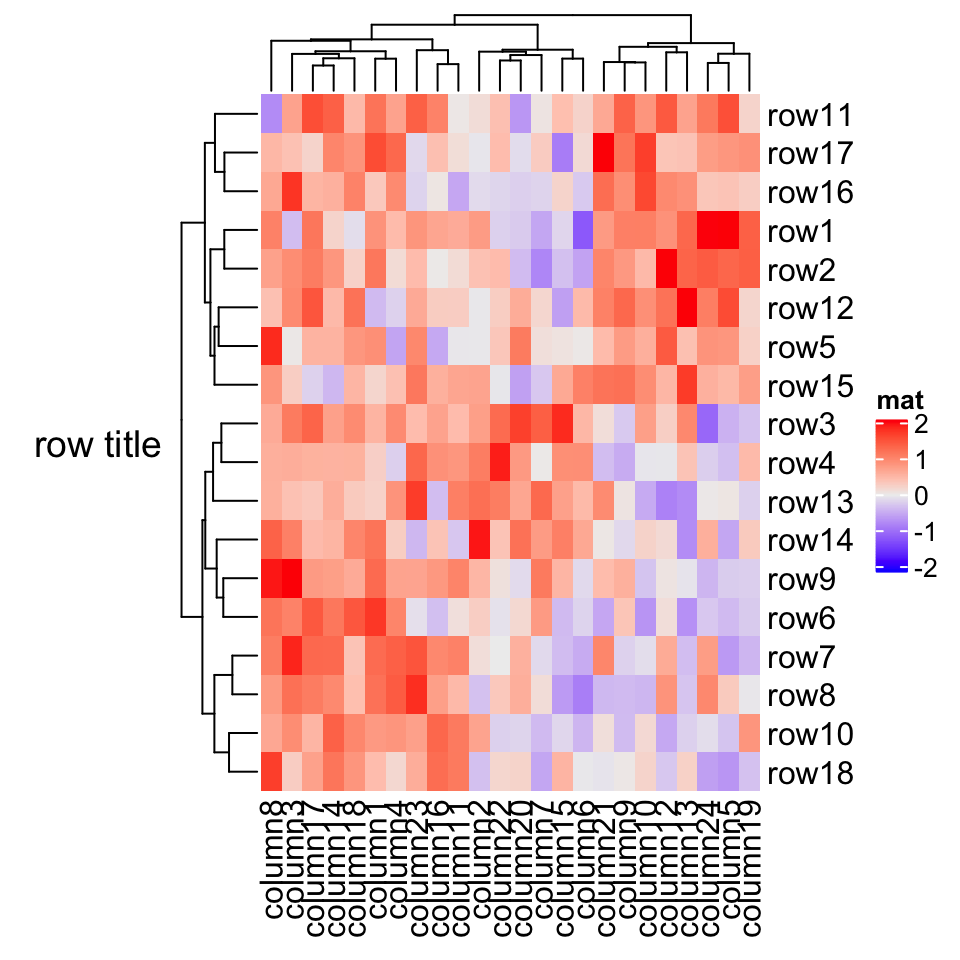
Rotations for titles can be set by row_title_rot and column_title_rot, but only horizontal and vertical rotations are allowed.
可以通过 row_title_rot 和 column_title_rot 设置标题的旋转,但只允许水平和垂直旋转。
Heatmap(mat, name = "mat", row_title = "row title", row_title_rot = 0)
Row or column title supports as a template which is used when rows or columns are split in the heatmap (because there will be multiple row/column titles). This functionality is introduced in Section 2.7. A quick example would be:
行或列标题可以作为模板提供支持,在热图中拆分行或列时使用该模板(因为将有多个行/列标题)。第 2.7节介绍了此功能。 一个简单的例子是:
# code only for demonstration# row title would be cluster_1 and cluster_2Heatmap(mat, name = "mat", row_km = 2, row_title = "cluster_%s")
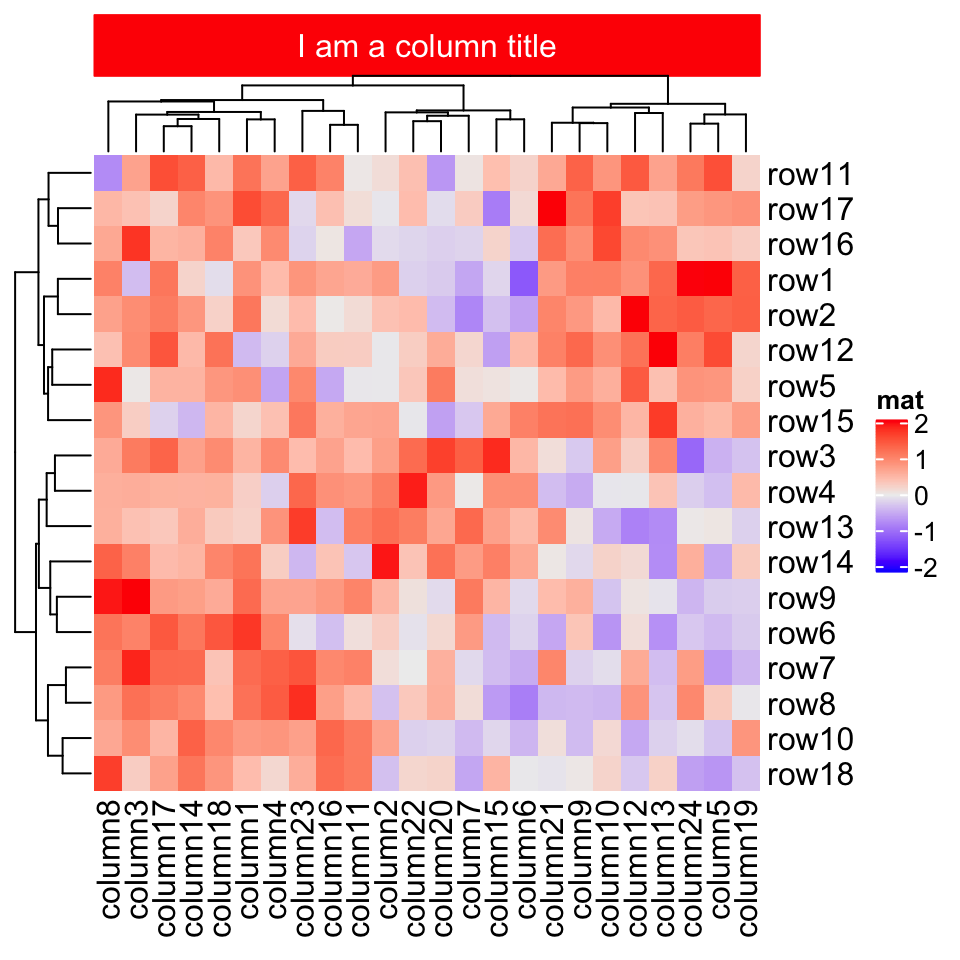
You can set fill parameter in row_title_gp and column_title_gp to set the background color of titles. Since col in e.g. row_title_gp controls the color of text, border is used to control the color of the background border.
您可以在 row_title_gp 和 column_title_gp 中设置 fill 参数以设置标题的背景颜色,因为 col 在,如 row_title_gp 中可以控制文本的颜色, border 用于控制背景边框的颜色。
Heatmap(mat, name = "mat", column_title = "I am a column title",column_title_gp = gpar(fill = "red", col = "white", border = "red"))
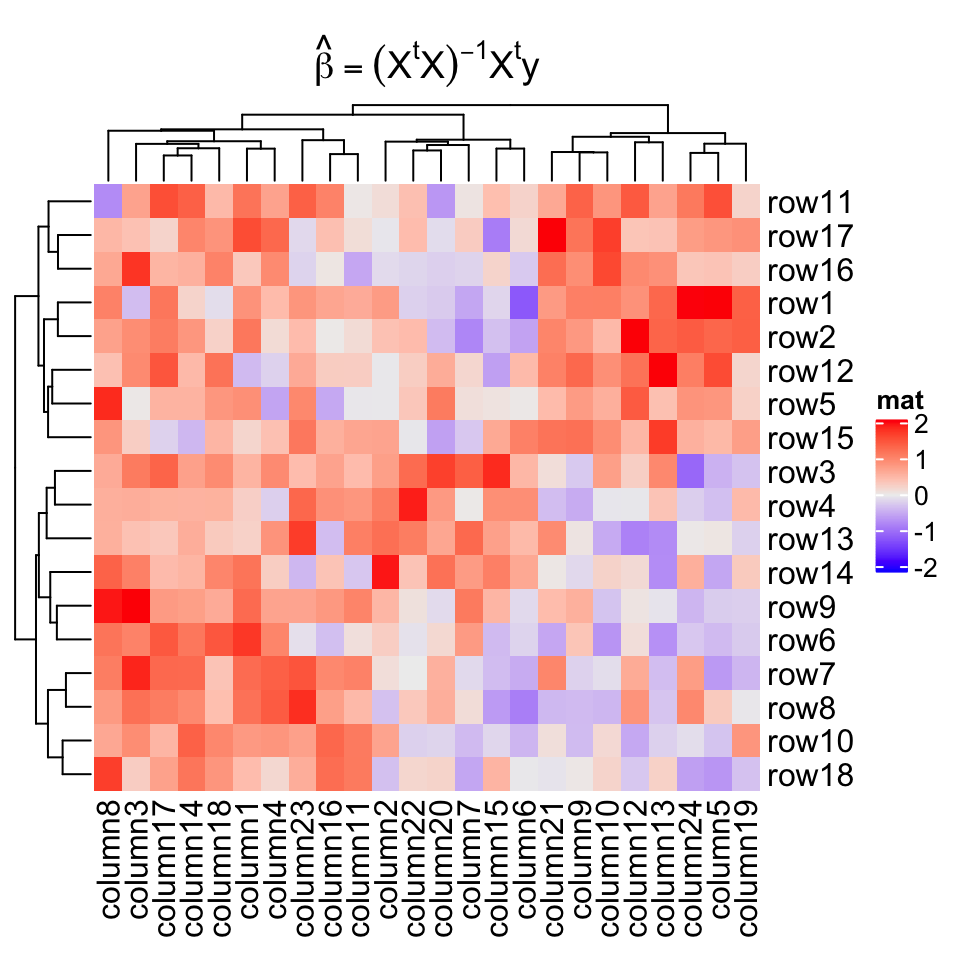
If the graphic elements are texts, they can be set as mathematical formulas.
如果图形元素是文本,则可以将它们设置为数学公式。
Heatmap(mat, name = "mat",column_title = expression(hat(beta) == (X^t * X)^{-1} * X^t * y))
—— 本节完 ——

若有收获,就点个赞吧
0 人点赞
