作者:Zuguang Gu8
翻译:Steven Shen
原文:https://jokergoo.github.io/ComplexHeatmap-reference/book/a-list-of-heatmaps.html#annotations-as-components-are-adjusted
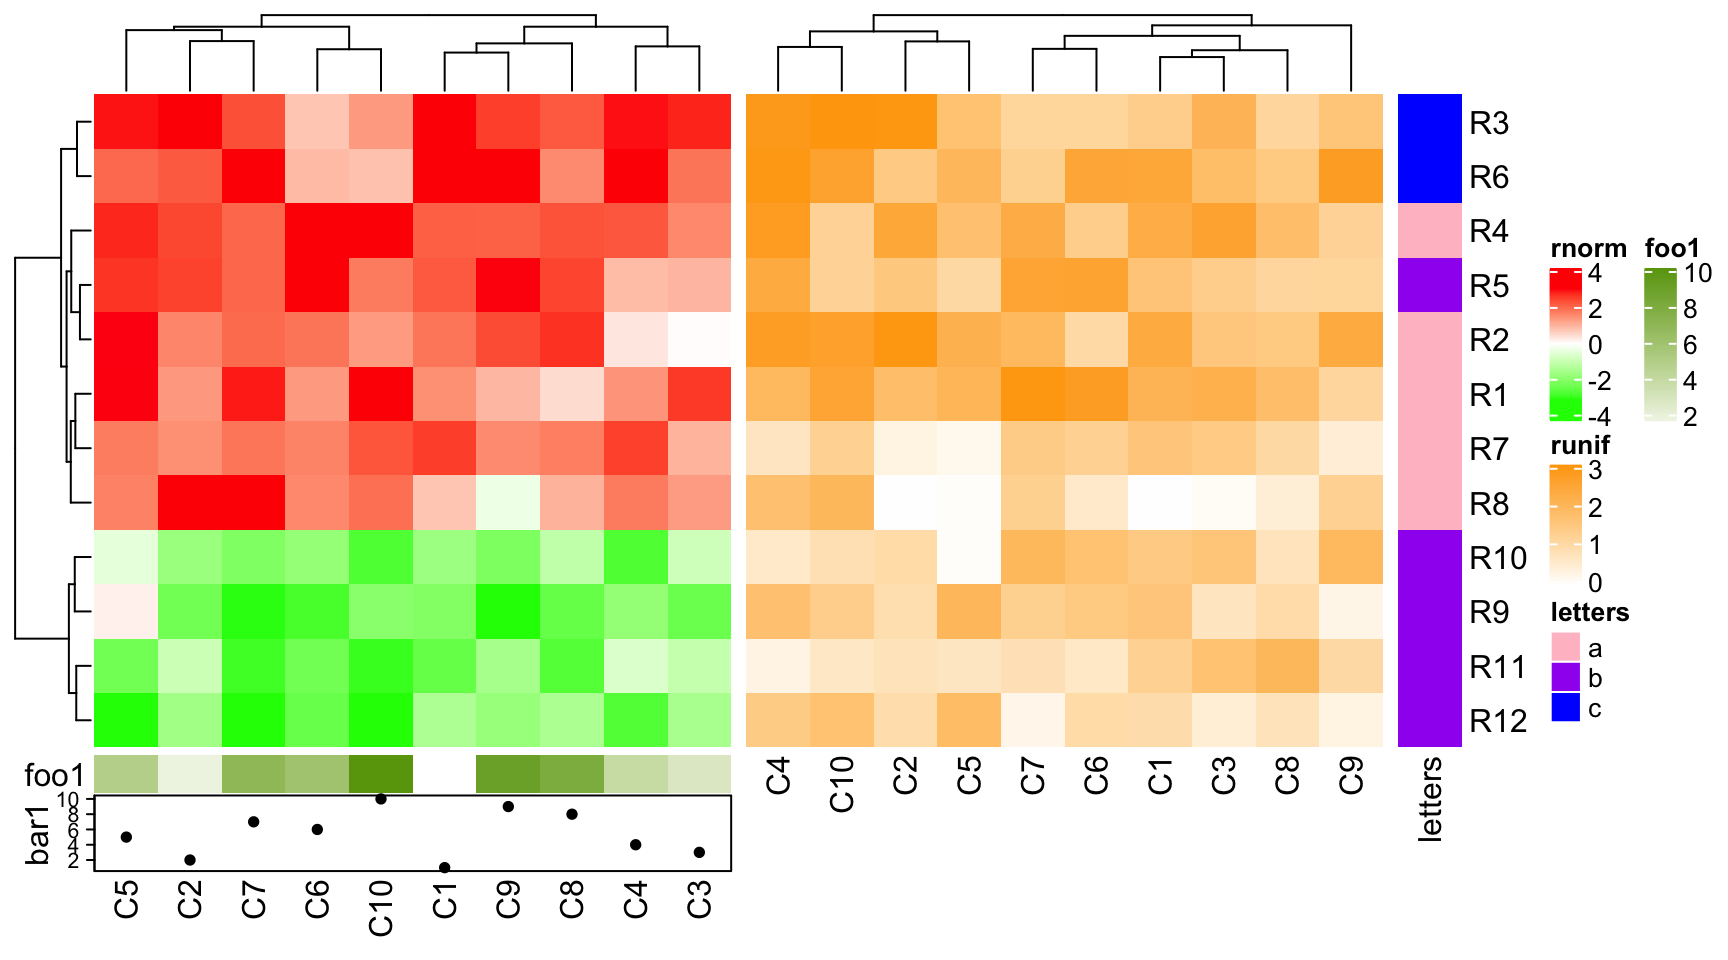
If some of the heatmaps in the heatmap list have annotations, in most of the cases, the heights of the heatmap annotations are different for different heatmaps. There are automatic adjustment for heatmap annotations, and this adjustment will also involve adjustment of dendrograms.
Normally, the size of simple annotations will not change in the adjustment. In following example, the dendrogram for the second heatmap is adjusted. Note you still can change the size of simple annotation by setting
anno_simple_sizeinHeatmapAnnotation()or globally setht_opt$anno_simple_size.
ha1 = HeatmapAnnotation(foo1 = 1:10, annotation_name_side = "left")ht1 = Heatmap(mat1, name = "rnorm", col = col_rnorm, top_annotation = ha1)ht2 = Heatmap(mat2, name = "runif", col = col_runif)ht3 = Heatmap(le, name = "letters", col = col_letters)ht1 + ht2 + ht3
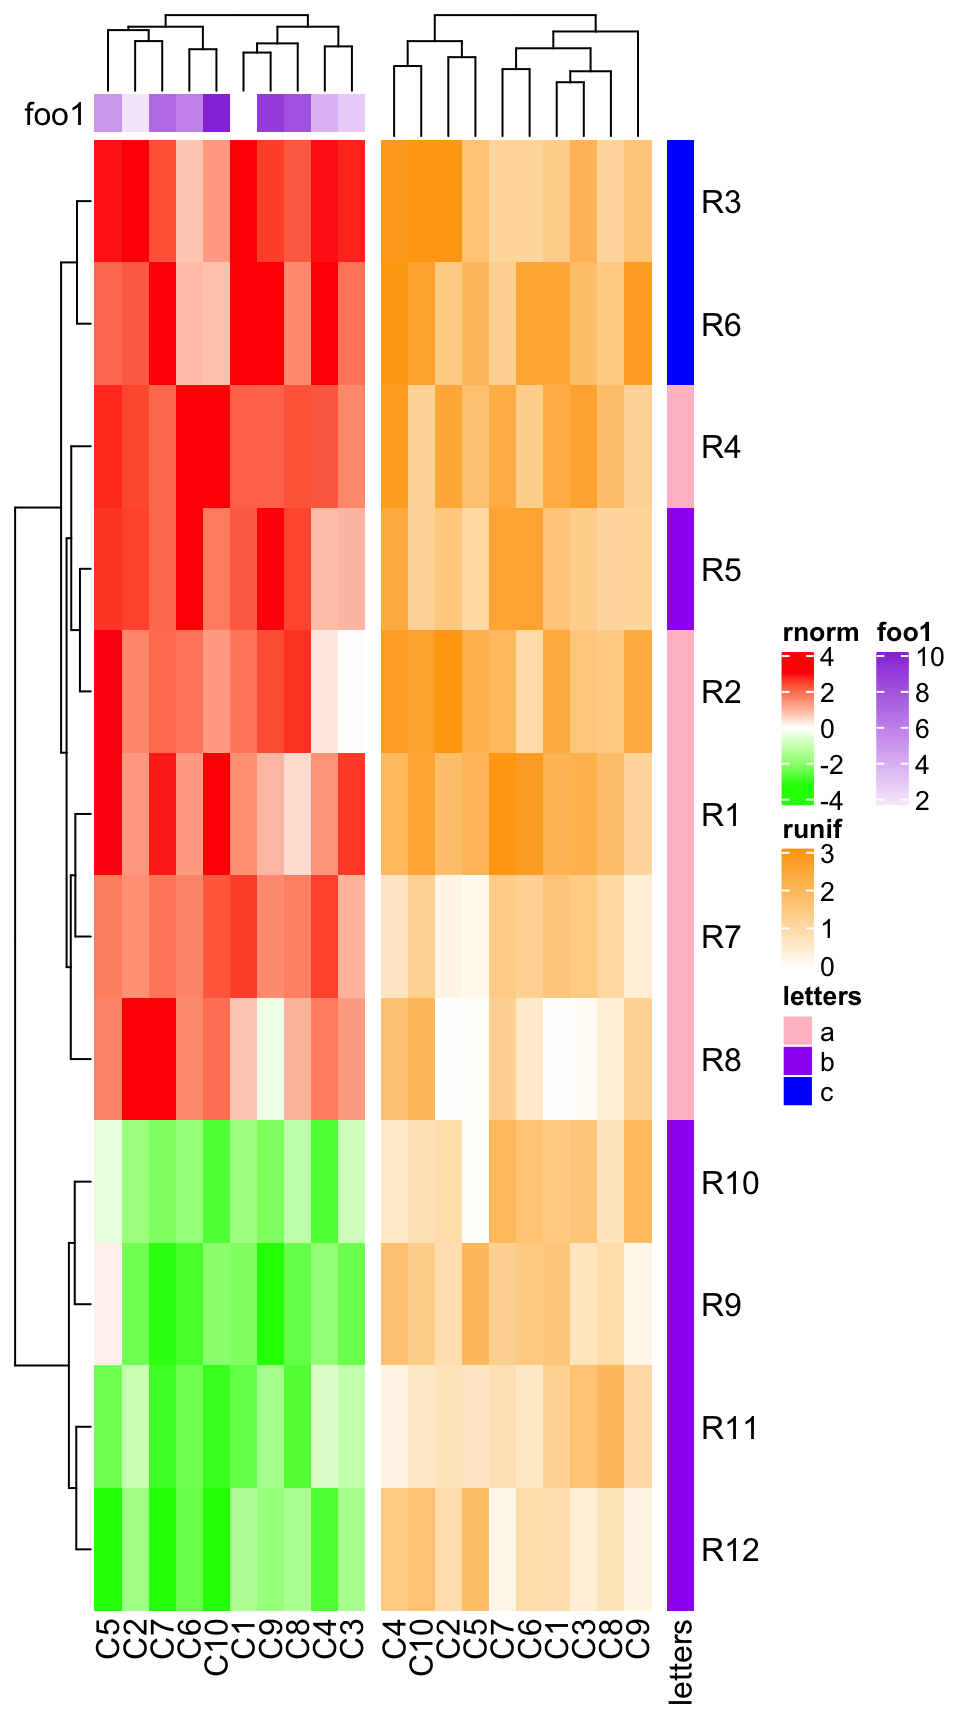
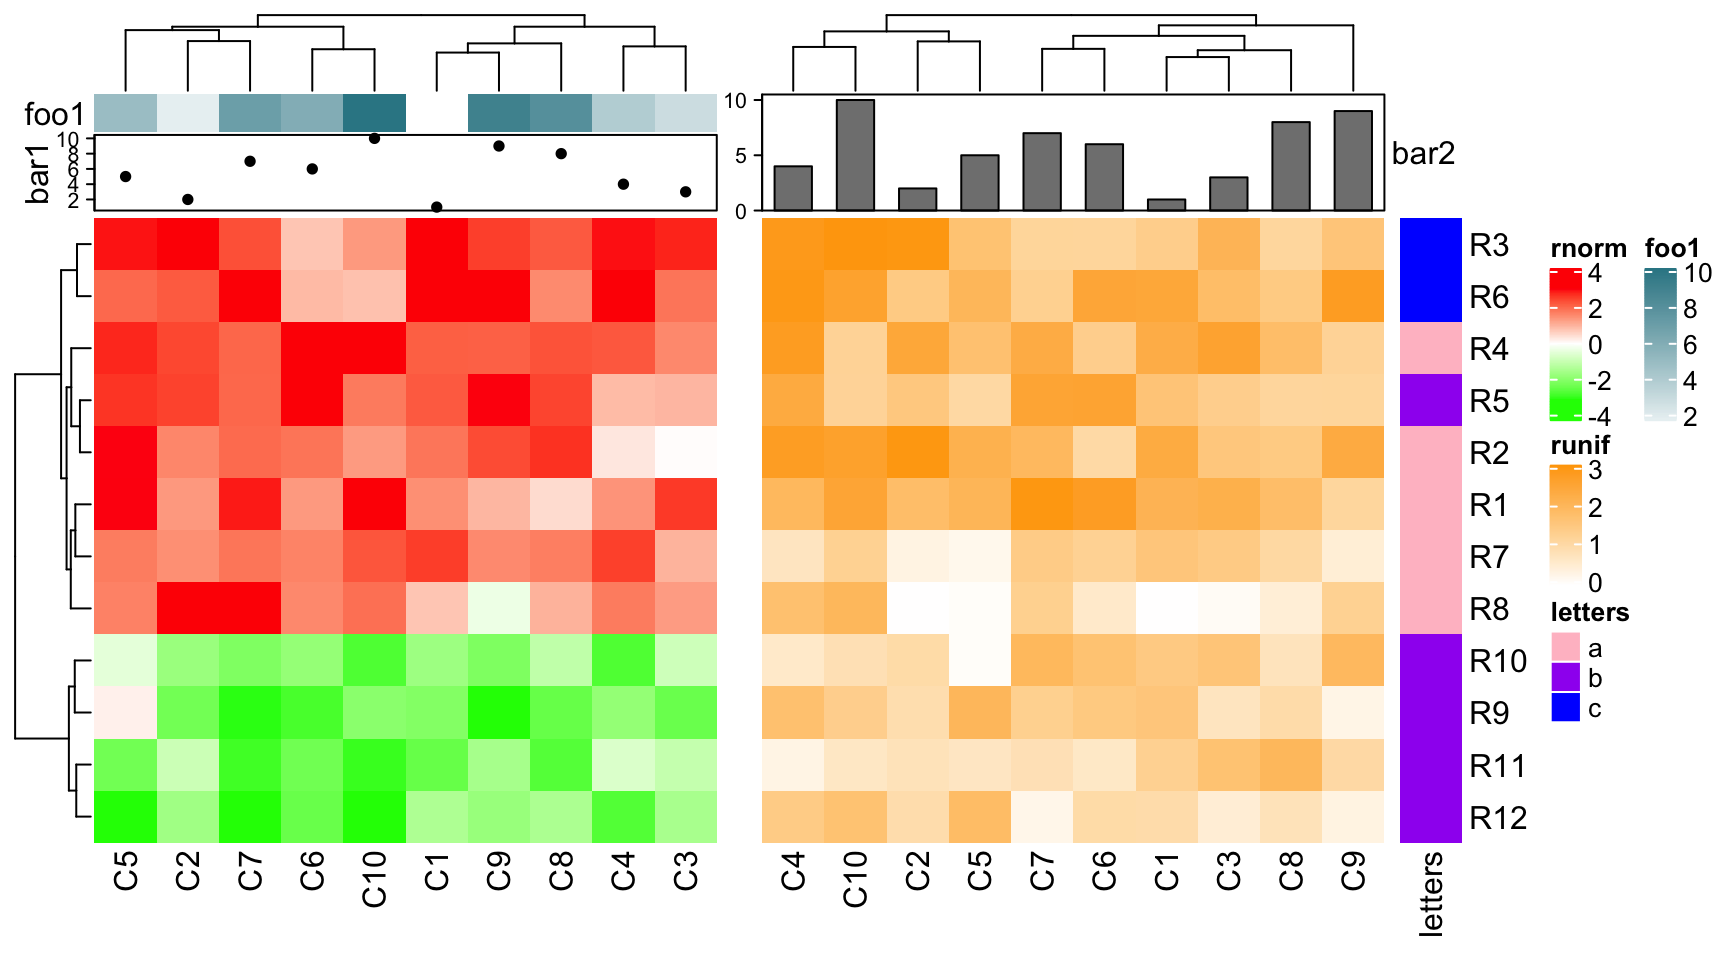
If the first two heatmaps all have annotations, since the size of simple annotations keep unchanged, the size of complex annotations will be adjusted to make the total heights of the two heatmap annotations the same.
ha1 = HeatmapAnnotation(foo1 = 1:10, bar1 = anno_points(1:10),
    annotation_name_side = "left")
ha2 = HeatmapAnnotation(bar2 = anno_barplot(1:10))
ht1 = Heatmap(mat1, name = "rnorm", col = col_rnorm, top_annotation = ha1)
ht2 = Heatmap(mat2, name = "runif", col = col_runif, top_annotation = ha2)
ht3 = Heatmap(le, name = "letters", col = col_letters)
ht_list = ht1 + ht2 + ht3
draw(ht_list, ht_gap = unit(c(6, 2), "mm"))
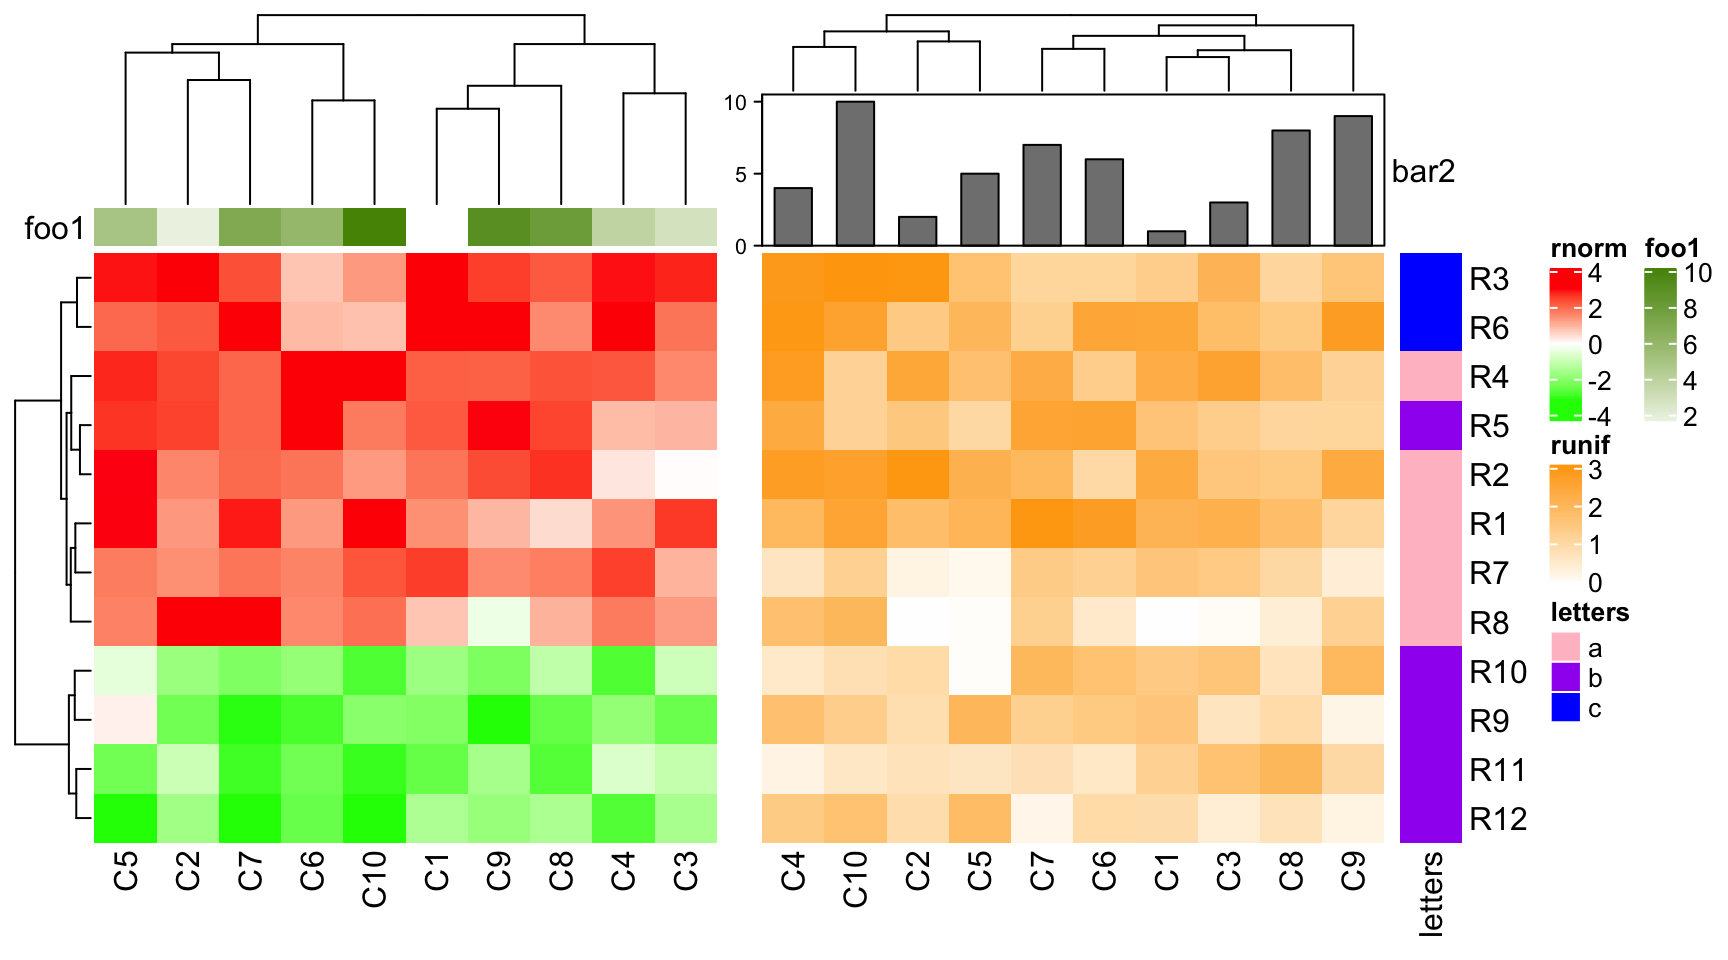
Similarly, if the first heatmap only contains simple annotatins, dendrogram will be adjusted.
ha1 = HeatmapAnnotation(foo1 = 1:10, annotation_name_side = "left")
ha2 = HeatmapAnnotation(bar2 = anno_barplot(1:10, height = unit(2, "cm")))
ht1 = Heatmap(mat1, name = "rnorm", col = col_rnorm, top_annotation = ha1)
ht2 = Heatmap(mat2, name = "runif", col = col_runif, top_annotation = ha2)
ht3 = Heatmap(le, name = "letters", col = col_letters)
ht_list = ht1 + ht2 + ht3
draw(ht_list, ht_gap = unit(c(6, 2), "mm"))
If the both heatmaps only contain simple annotations but with unequal number, dendrogram will be adjusted.
ha1 = HeatmapAnnotation(foo1 = 1:10, annotation_name_side = "left")
ha2 = HeatmapAnnotation(bar2 = cbind(b1 = 1:10, b2 = 11:20, b3 = 21:30))
ht1 = Heatmap(mat1, name = "rnorm", col = col_rnorm, top_annotation = ha1)
ht2 = Heatmap(mat2, name = "runif", col = col_runif, top_annotation = ha2)
ht3 = Heatmap(le, name = "letters", col = col_letters)
ht_list = ht1 + ht2 + ht3
draw(ht_list)
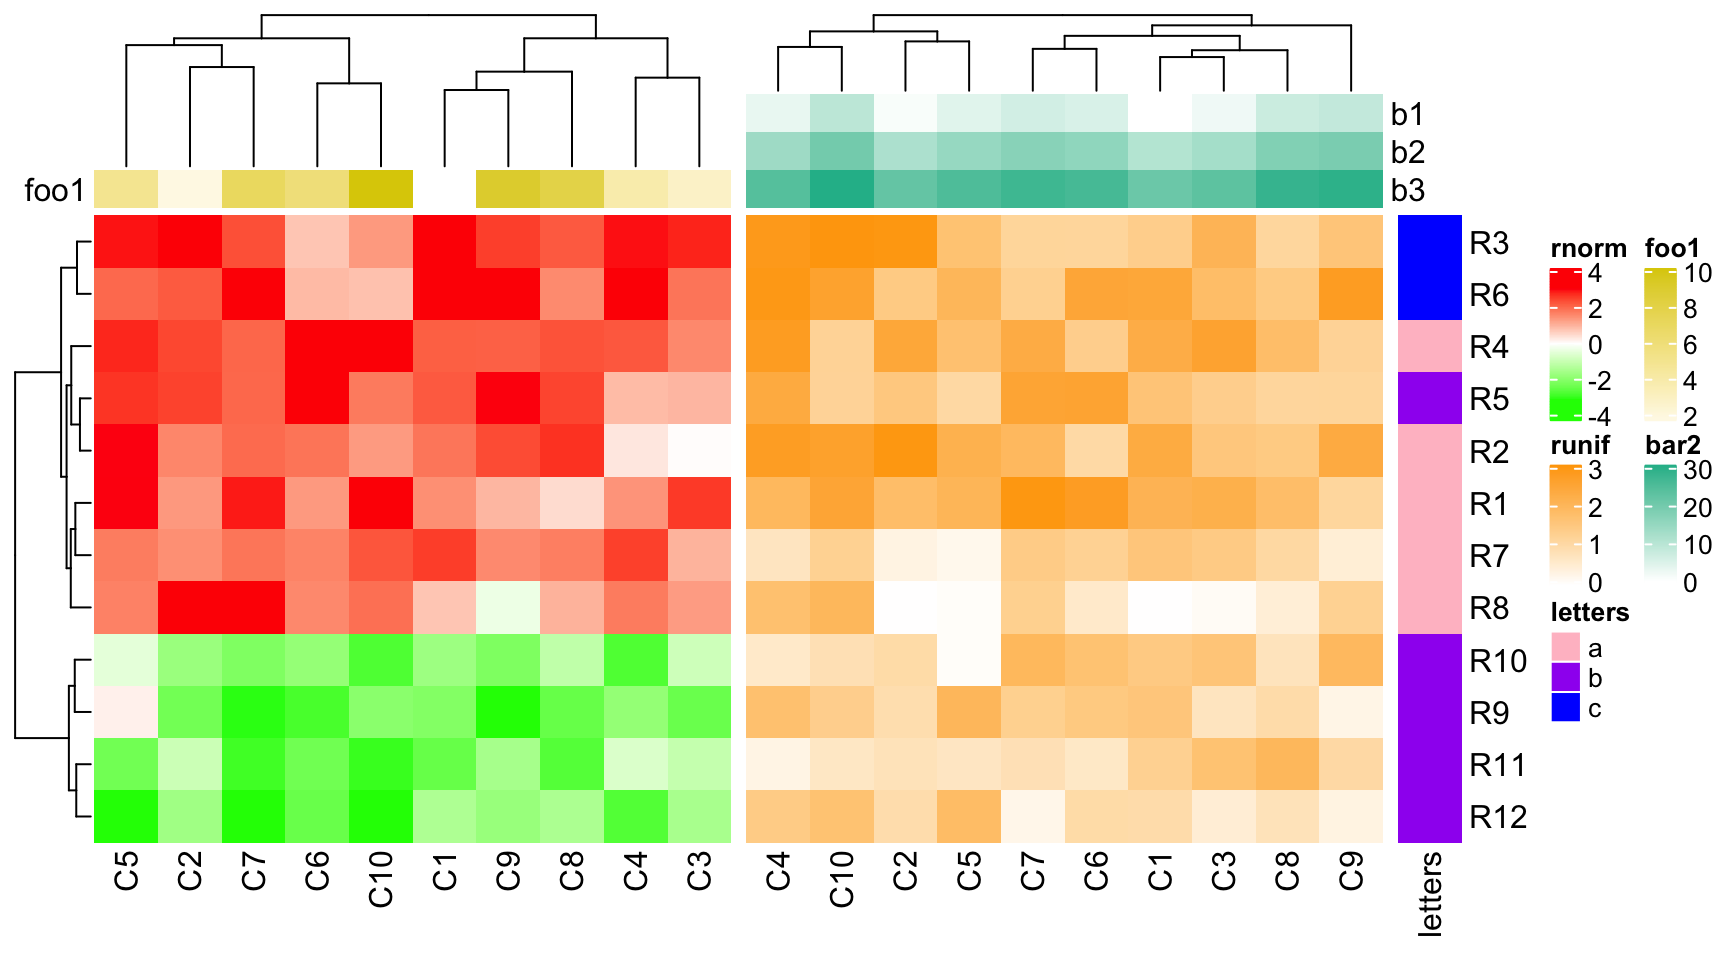
If you also want to automatically adjust the size of simple annotations, set
simple_anno_size_adjust = TRUEin everyHeatmapAnnotation()calls.If the second heatmap has no bottom annotation, column names for the second heatmap are adjusted to be put directly below the heatmap body.
ha1 = HeatmapAnnotation(foo1 = 1:10, bar1 = anno_points(1:10), annotation_name_side = "left")
ht1 = Heatmap(mat1, name = "rnorm", col = col_rnorm, bottom_annotation = ha1)
ht2 = Heatmap(mat2, name = "runif", col = col_runif)
ht3 = Heatmap(le, name = "letters", col = col_letters)
ht_list = ht1 + ht2 + ht3
draw(ht_list)
