作者:Zuguang Gu8
翻译:Steven Shen
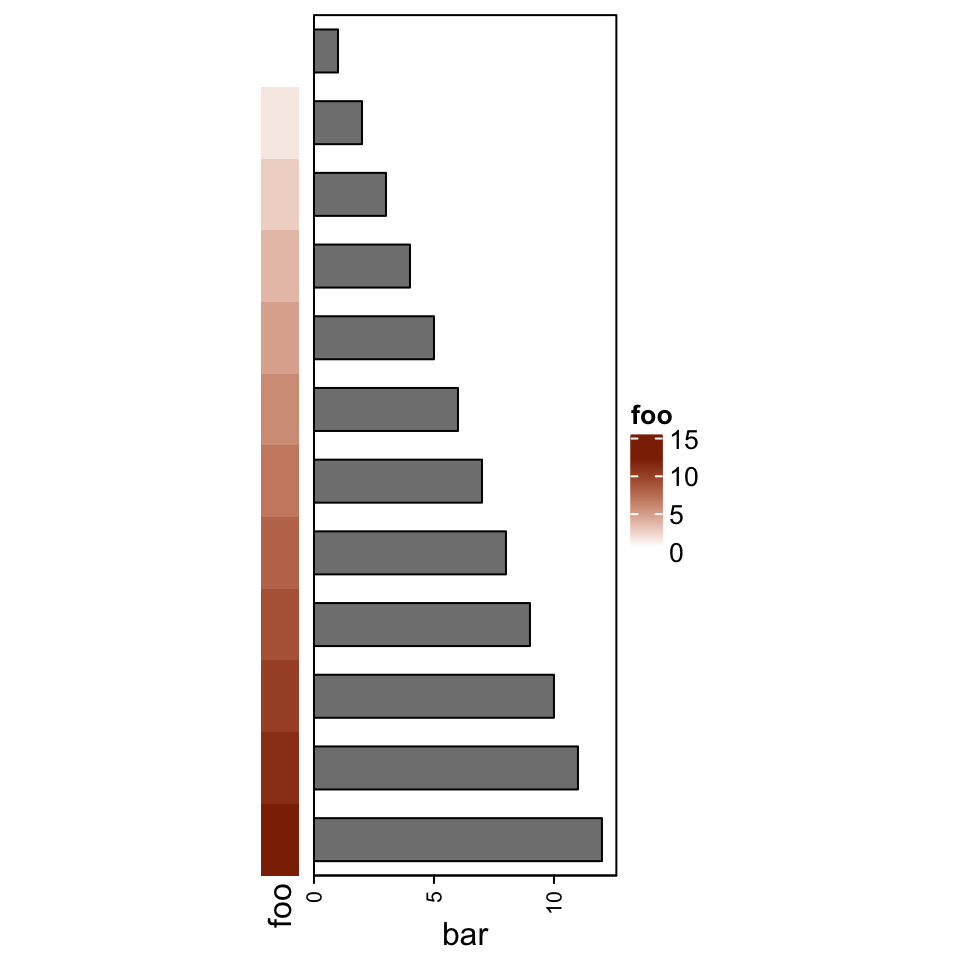
原文:Concatenate only the annotations
The concatenation can be done without any heatmap.
rowAnnotation(foo = 1:12) +rowAnnotation(bar = anno_barplot(1:12, width = unit(4, "cm")))
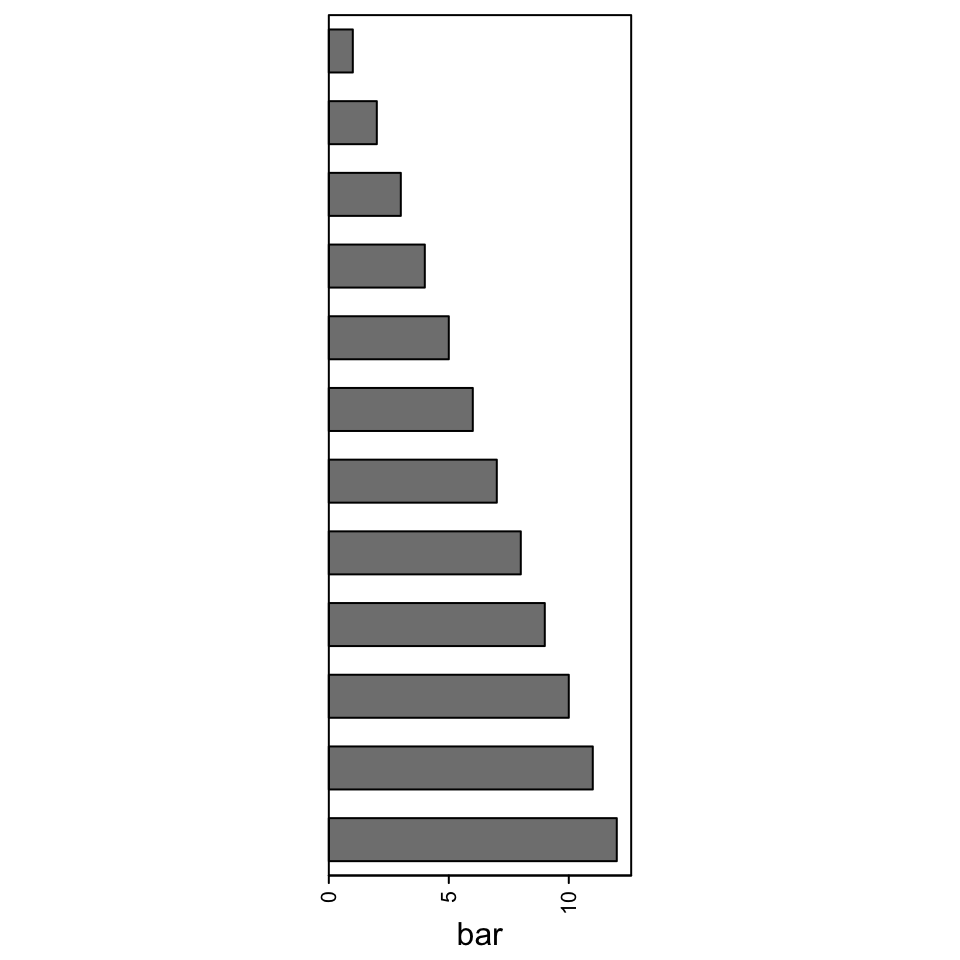
If there is only one
HeatmapAnnotationobject, you must concatenated withNULL.
rowAnnotation(bar = anno_barplot(1:12, width = unit(4, "cm"))) + NULL
The annotation list is actually also a
HeatmapListobject.
anno_list = rowAnnotation(foo = 1:12) +
    rowAnnotation(bar = anno_barplot(1:12, width = unit(4, "cm")))
class(anno_list)


## [1] "HeatmapList"
## attr(,"package")
## [1] "ComplexHeatmap"
Thus, you can use some functionalities of the
draw()function for the annotation list, such as row splitting.
draw(anno_list, row_split = rep(c("A", "B"), each = 6))

In Section 10.2, we will show how to use a list of annotations to visualize multiple summary statistics.

若有收获,就点个赞吧
0 人点赞
