作者:Zuguang Gu8
编译:Steven Shen
原文:2.5 Seriation
:::info
Seriation is an interesting technique for ordering the matrix (see this interesting post: http://nicolas.kruchten.com/content/2018/02/seriation/). The powerful seriation package implements quite a lot of methods for seriation. Since it is easy to extract row orders and column orders from the object returned by the core function seriate() from seriation package. They can be directly assigned to row_order and column_order to make the heatmap.
:::
Seriation 是一种有趣的矩阵排序技术(参见这篇有趣的文章:http://nicolas.kruchten.com/content/2018/02/seriation/)。 功能强大的 seriation 包实现了很多用于系列化的方法。因为很容易从 serialation 包中的核心函数 seriate() 返回的对象中提取行和列的顺序。我们可以把这些顺序结果直接分配给 row_order 和 column_order 来制作热图。
:::tips
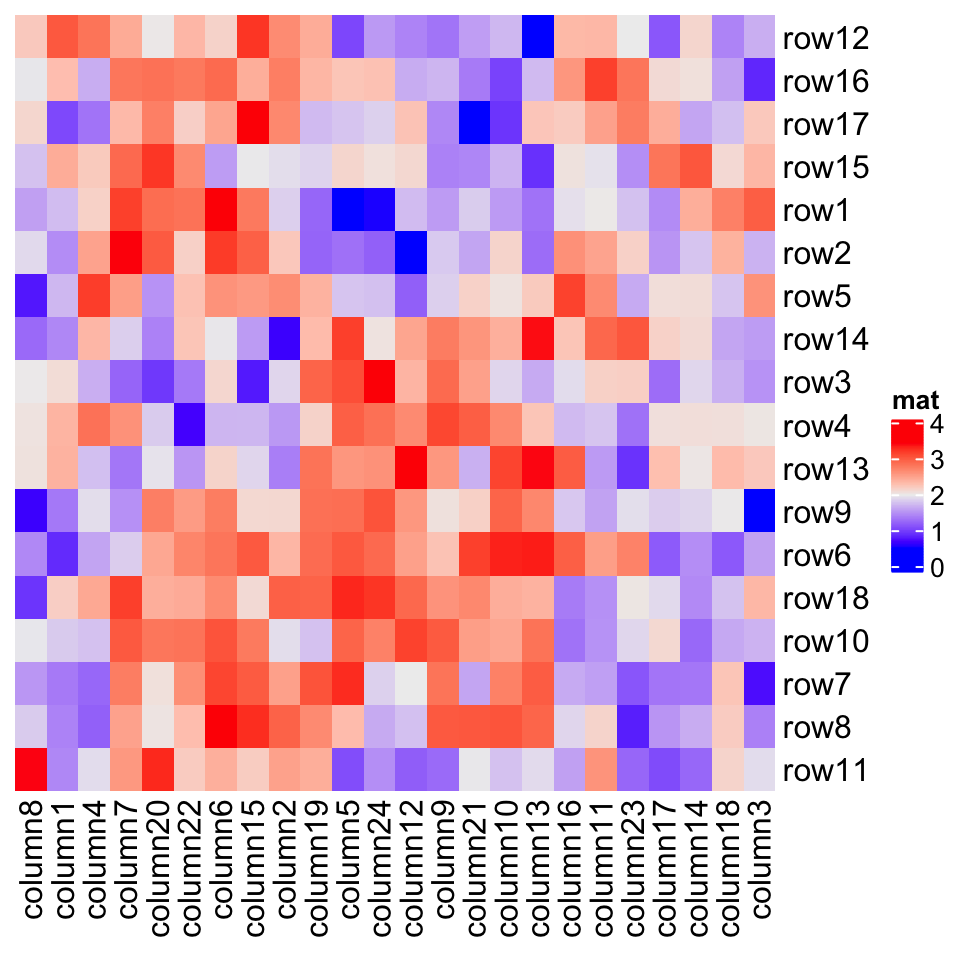
The first example demonstrates to directly apply seriate() on the matrix. Since the "BEA_TSP" method only allows a non-negative matrix, we modify the matrix to max(mat) - mat.
:::
第一个示例演示了直接在矩阵上应用 seriate() 。由于 "BEA_TSP" 方法仅允许非负矩阵,我们将矩阵修改为 max(mat) - mat 。
library(seriation)o = seriate(max(mat) - mat, method = "BEA_TSP")Heatmap(max(mat) - mat, name = "mat",row_order = get_order(o, 1), column_order = get_order(o, 2))

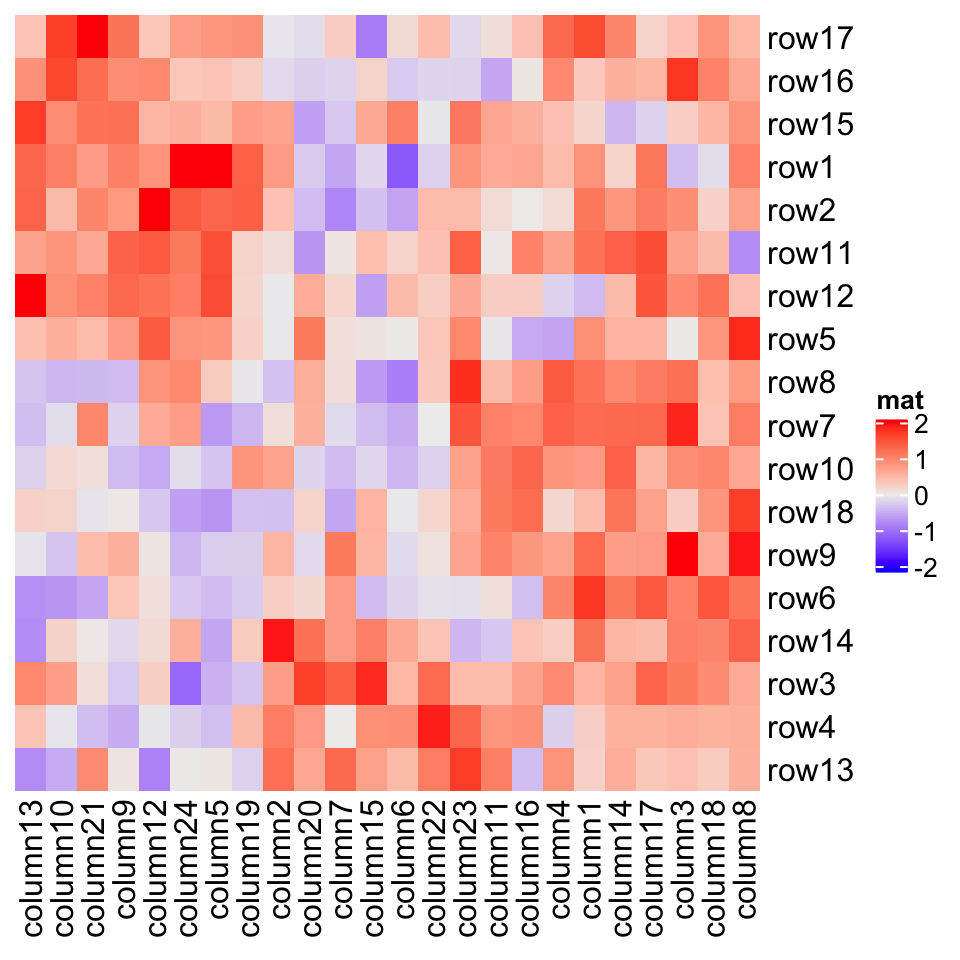
Or you can apply seriate() to the distance matrix. Now the order for rows and columns needs to be calcualted separatedly because the distance matrix needs to be calculated separatedly for columns and rows.
或者您可以将 seriate() 应用于距离矩阵。现在需要分别计算行和列的顺序,因为需要针对列和行分别计算距离矩阵。
o1 = seriate(dist(mat), method = "TSP")o2 = seriate(dist(t(mat)), method = "TSP")Heatmap(mat, name = "mat", row_order = get_order(o1), column_order = get_order(o2))

Some seriation methods also contain the hierarchical clustering information. Let’s try:
一些连续方法还包含层次聚类信息。我们可以尝试一下:
o1 = seriate(dist(mat), method = "GW")o2 = seriate(dist(t(mat)), method = "GW")
o1 and o2 are actually mainly composed of hclust objects:o1 和 o2 实际上主要由 hclust 对象组成:
class(o1[[1]])
And the orders are the same by using hclust$order or get_order().
使用 hclust$order 或 get_order() 这两个命令是相同的。
o1[[1]]$order## [1] 1 2 11 12 5 15 16 17 7 8 6 9 10 18 13 4 3 14# should be the same as the previous oneget_order(o1)## [1] 1 2 11 12 5 15 16 17 7 8 6 9 10 18 13 4 3 14
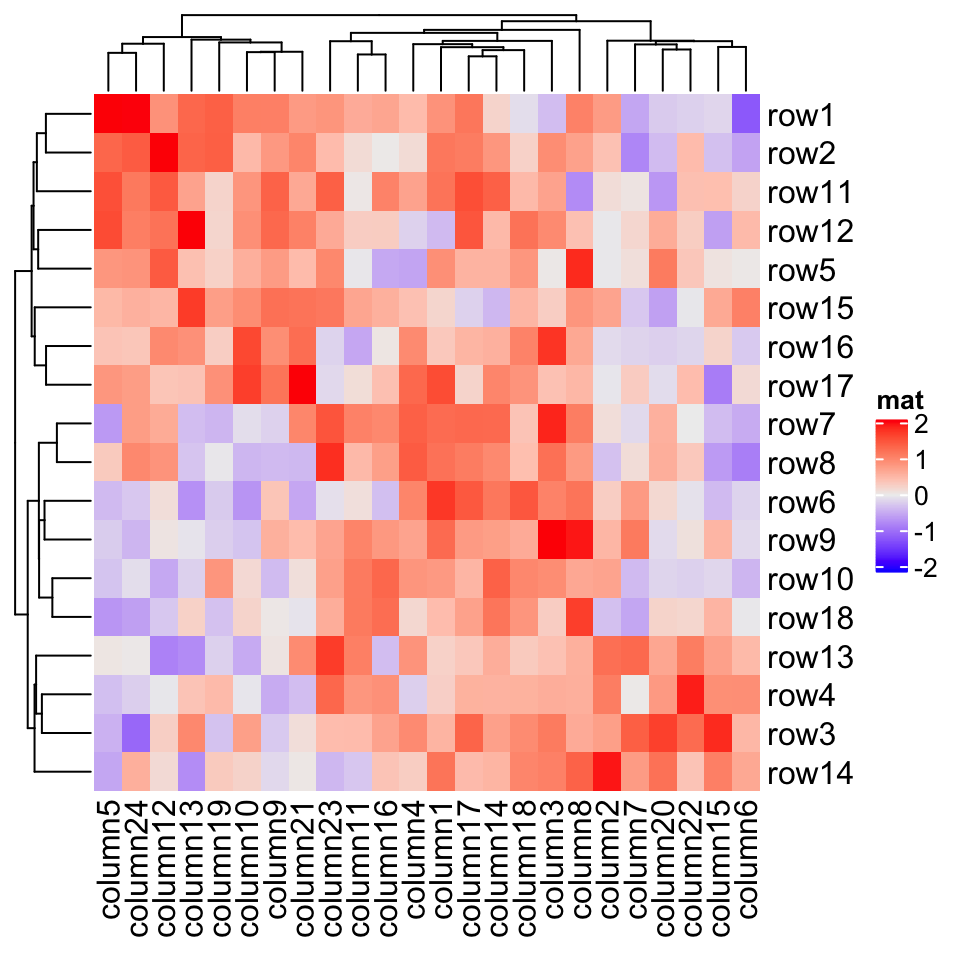
And we can add the dendrograms to the heatmap.
我们可以将树形图添加到热图中。
Heatmap(mat, name = "mat", cluster_rows = as.dendrogram(o1[[1]]),cluster_columns = as.dendrogram(o2[[1]]))

For more use of the seriate() function, please refer to the seriation package.
有关 seriate() 函数的更多用法,请参阅 seriation 包。
—— 本节完 ——

