作者:Zuguang Gu8
翻译:Steven Shen
原文:Concatenate with annotations
Row annotations can be concatenated to the horizontal heatmap list, while not only a component of the heatmap. See following examples which are very straightforward.
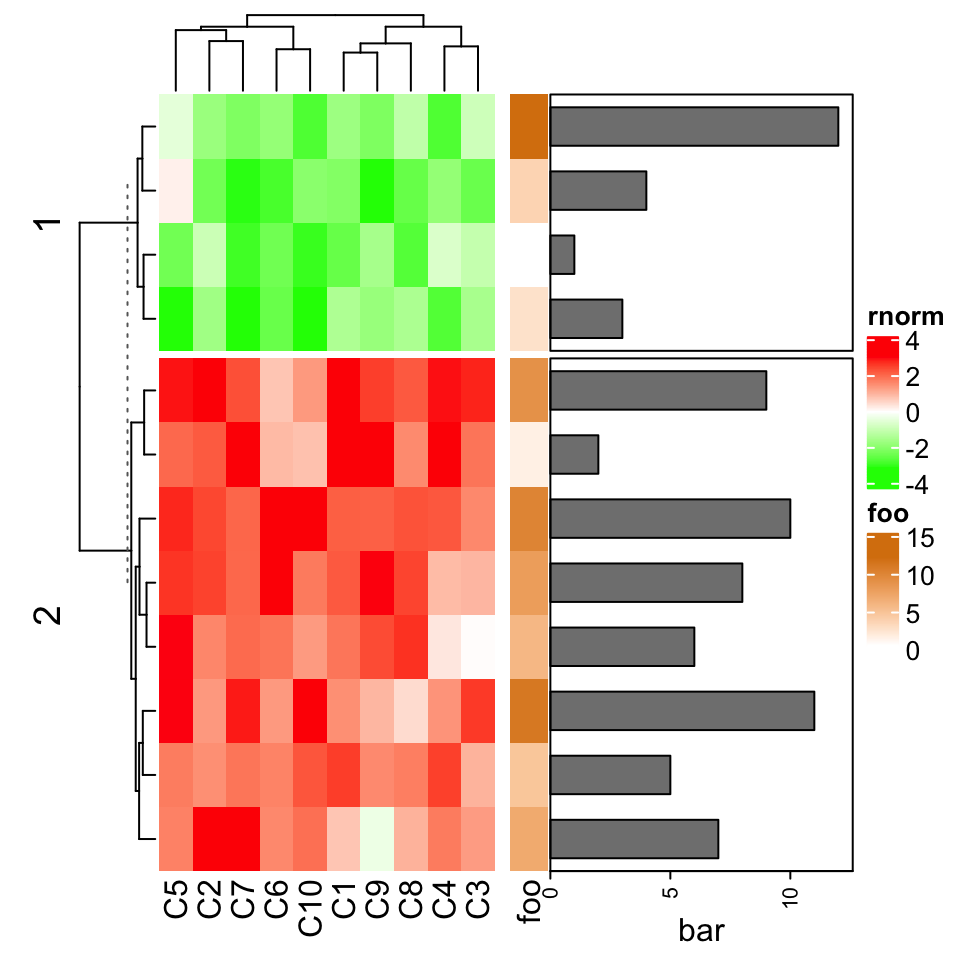
ha1 = rowAnnotation(foo = 1:12, bar = anno_barplot(1:12, width = unit(4, "cm")))ht1 = Heatmap(mat1, name = "rnorm", col = col_rnorm, row_km = 2)ht1 + ha1

The
fooandbarannotations can be defined in two separatedrowAnnotation()calls.
Heatmap(mat1, name = "rnorm", col = col_rnorm, row_km = 2) +
    rowAnnotation(foo = 1:12) +
    rowAnnotation(bar = anno_barplot(1:12, width = unit(4, "cm")))

Basically heatmaps and row annotations can be concatenated arbitarily.
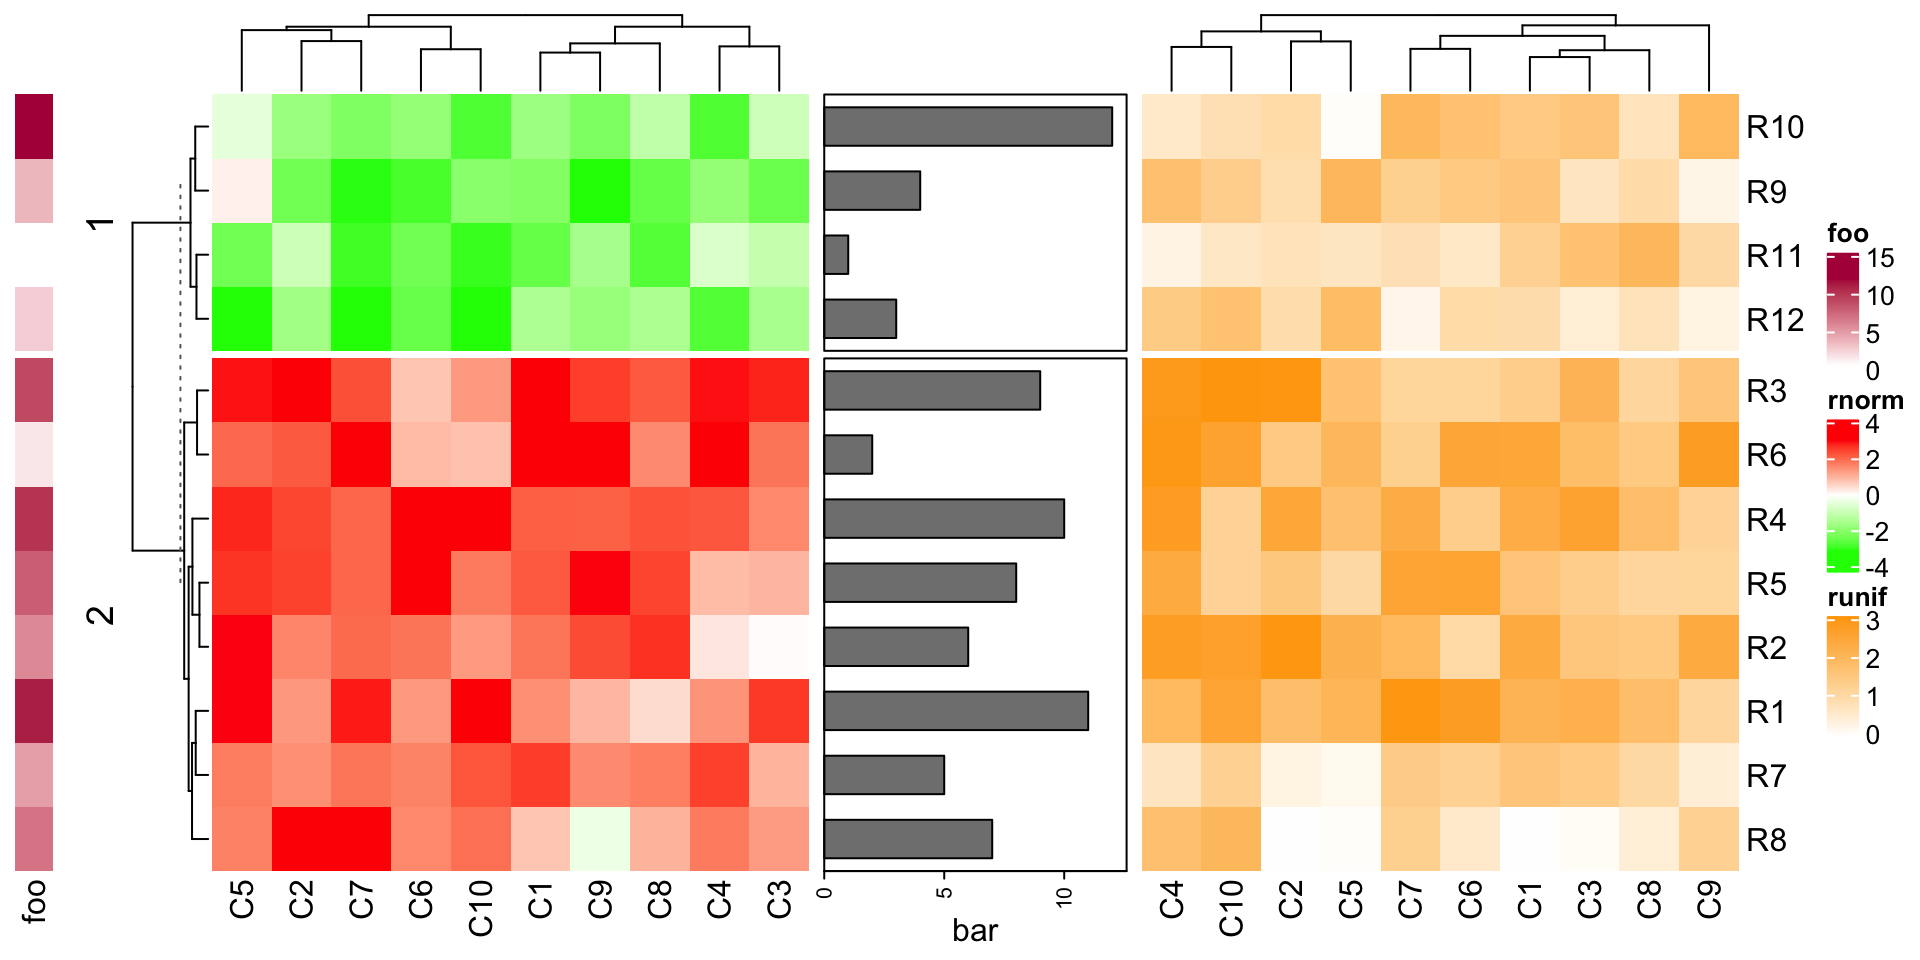
rowAnnotation(foo = 1:12) +
    Heatmap(mat1, name = "rnorm", col = col_rnorm, row_km = 2) +
    rowAnnotation(bar = anno_barplot(1:12, width = unit(4, "cm"))) +
    Heatmap(mat2, name = "runif", col = col_runif)

As mentioned in previous chapters, row annotations can also be heatmap components as left annotations or right annotations. The difference of row annotations as independent ones and as heatmap components is discussed in Section 4.9.

