作者:Zuguang Gu8
编译:Steven Shen
原文:Adjust blank space caused by annotations
The layout of the ComplexHeatmap is not perfect that it is still possible some of the text are drawn out of the plotting region. In this case, you can manually set the
paddingargument indraw()function to increase the blank areas around the final plot.The value of
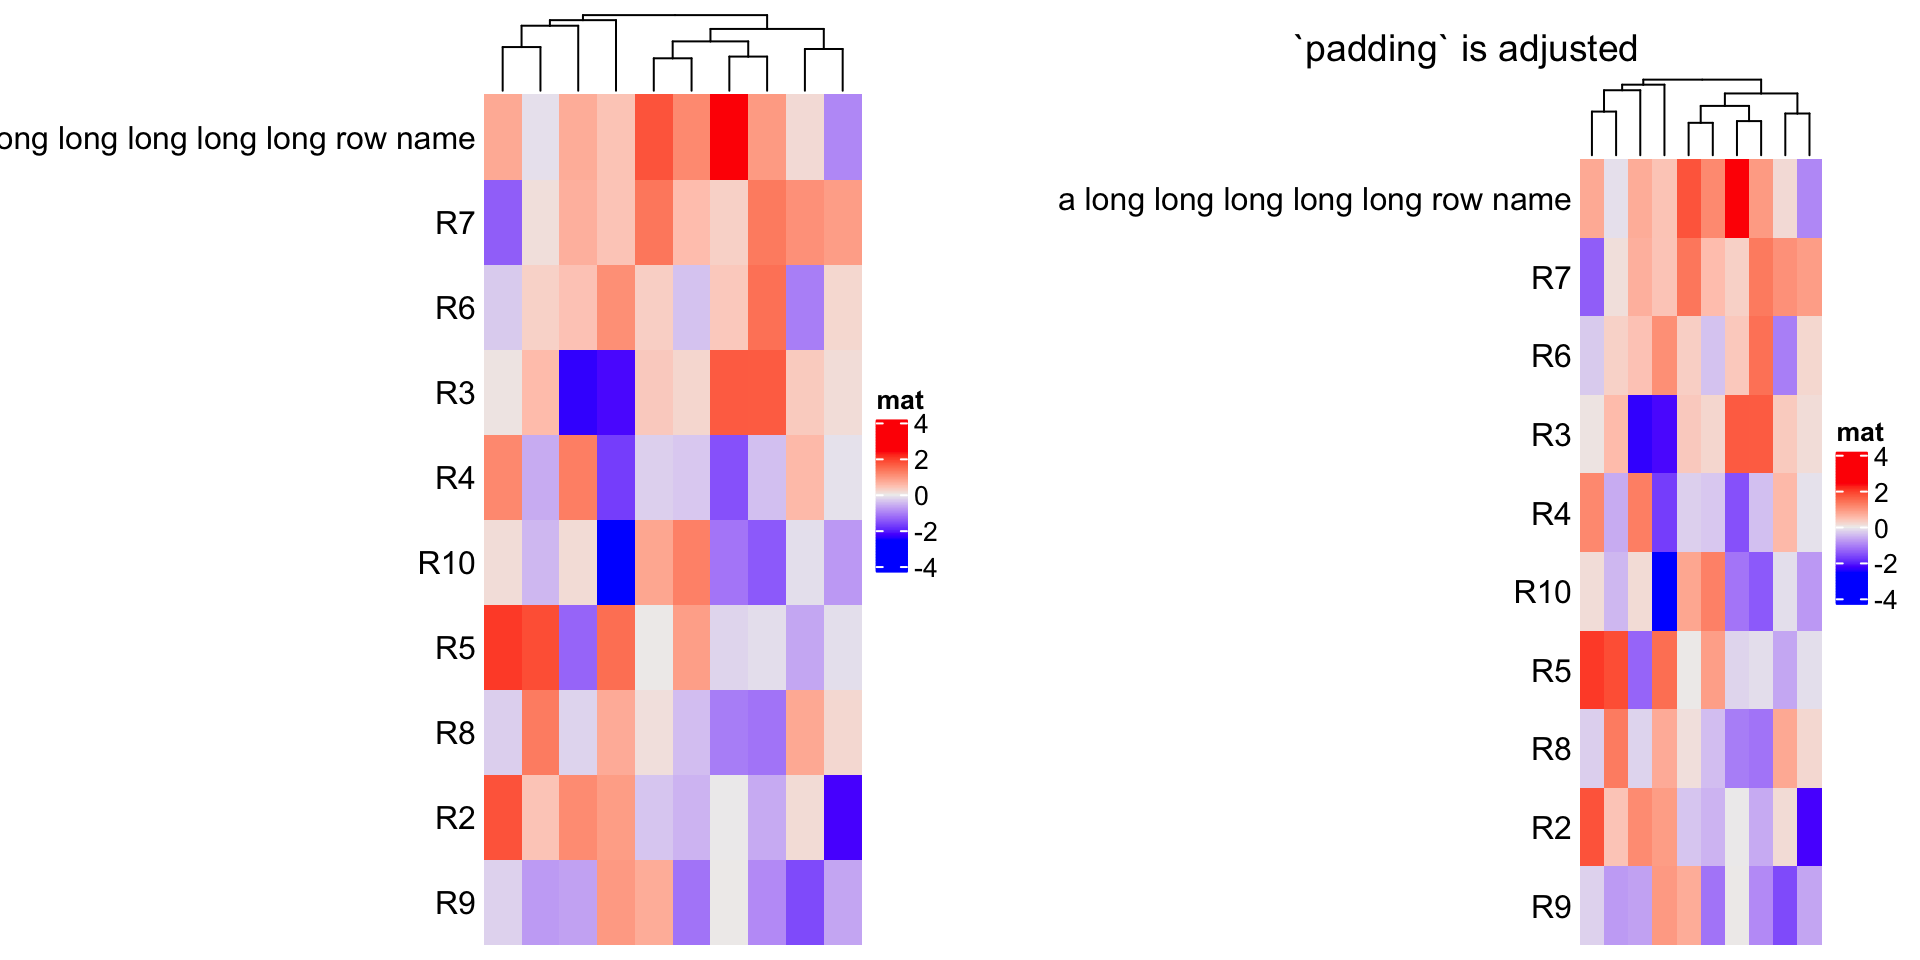
paddingshould be a unit vector with length of four. The four values correspond to the space at the bottom, left, top and right sides.The following example is not a perfect example because the maximal width for row names can be controlled by
max_row_name_widthargument, but we can still use it to demonstrate the use ofpadding.
m2 = mrownames(m2) = paste0("R", 1:10)rownames(m2)[1] = "a long long long long long row name"ht = Heatmap(m2, name = "mat", row_names_side = "left", show_row_dend = FALSE)draw(ht, padding = unit(c(2, 20, 2, 2), "mm")) ## see right heatmap in following

若有收获,就点个赞吧
0 人点赞
