作者:Zuguang Gu8
翻译:Steven Shen
原文:https://jokergoo.github.io/ComplexHeatmap-reference/book/a-list-of-heatmaps.html#automatic-adjustment-to-the-main-heatmap
There is always a main heatmap in the heatmap list that controls the global row ordering. All the other heatmaps are automatically adjusted according to the settings in the main heatmap. For these non-main heatmaps, the adjustments are:
- No row clustering is performed and they all take the row ordering of the main heatmap.
- Row titles are removed.
- If the main heatmap is split by rows, all other heatmaps will also be split by same levels as the main heatmap.
- The height of the main heatmap are taken as the height of all heatmaps.
By default, the first heatmap is taken as the main heatmap.
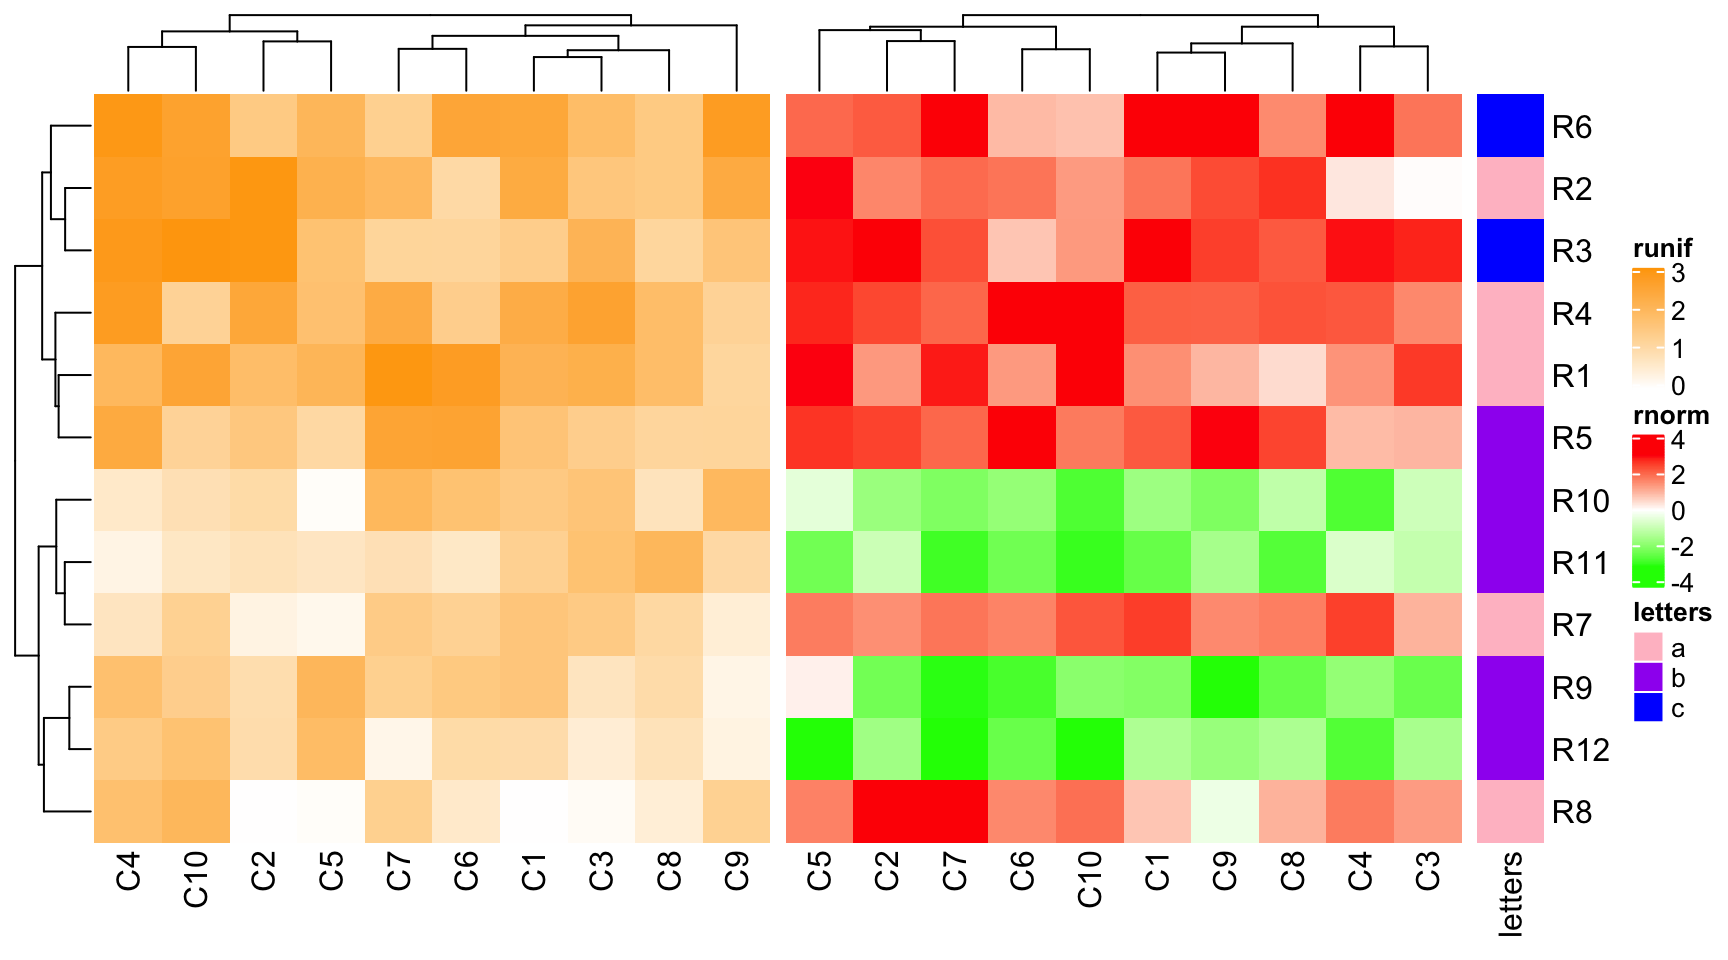
ht1 = Heatmap(mat1, name = "rnorm", col = col_rnorm, row_km = 2)ht2 = Heatmap(mat2, name = "runif", col = col_runif)ht3 = Heatmap(le, name = "letters", col = col_letters)ht2 + ht1 + ht3 # ht2 is the main heatmap and row_km in ht1 is ignored

The main heatmap can be specified by
main_heatmapargument. The value can be a numeric index or the name of the heatmap (of course, you need to set the heatmap name when you create theHeatmapobject). In following example, althoughht1is the second heatmap, we can set it as the main heatmap.
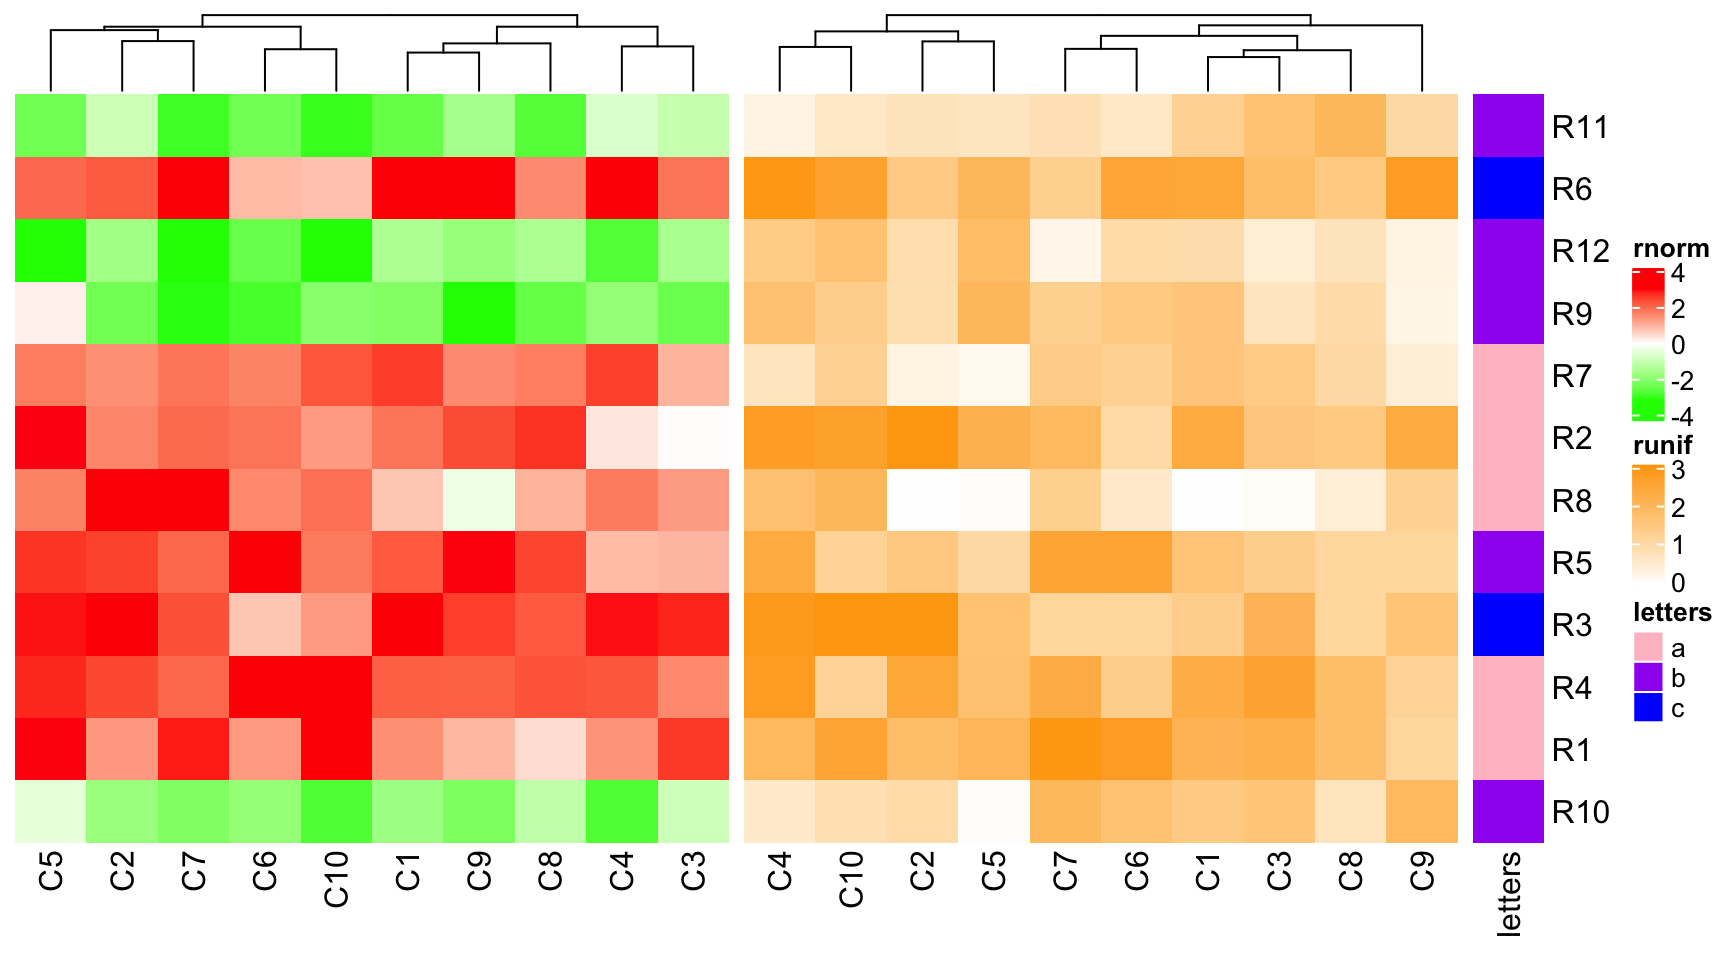
ht_list = ht2 + ht1 + ht3draw(ht_list, main_heatmap = "rnorm")

By default, the dendrogram and the row title are plotted just beside the main heatmap, just to emphasize the clustering or the splitting is calculated from the main heatmap while not other heatmaps. However, the position of the dendrogram and row title of the main heatmap can be controlled by
row_dend_sideandrow_sub_title_sideindraw()function.
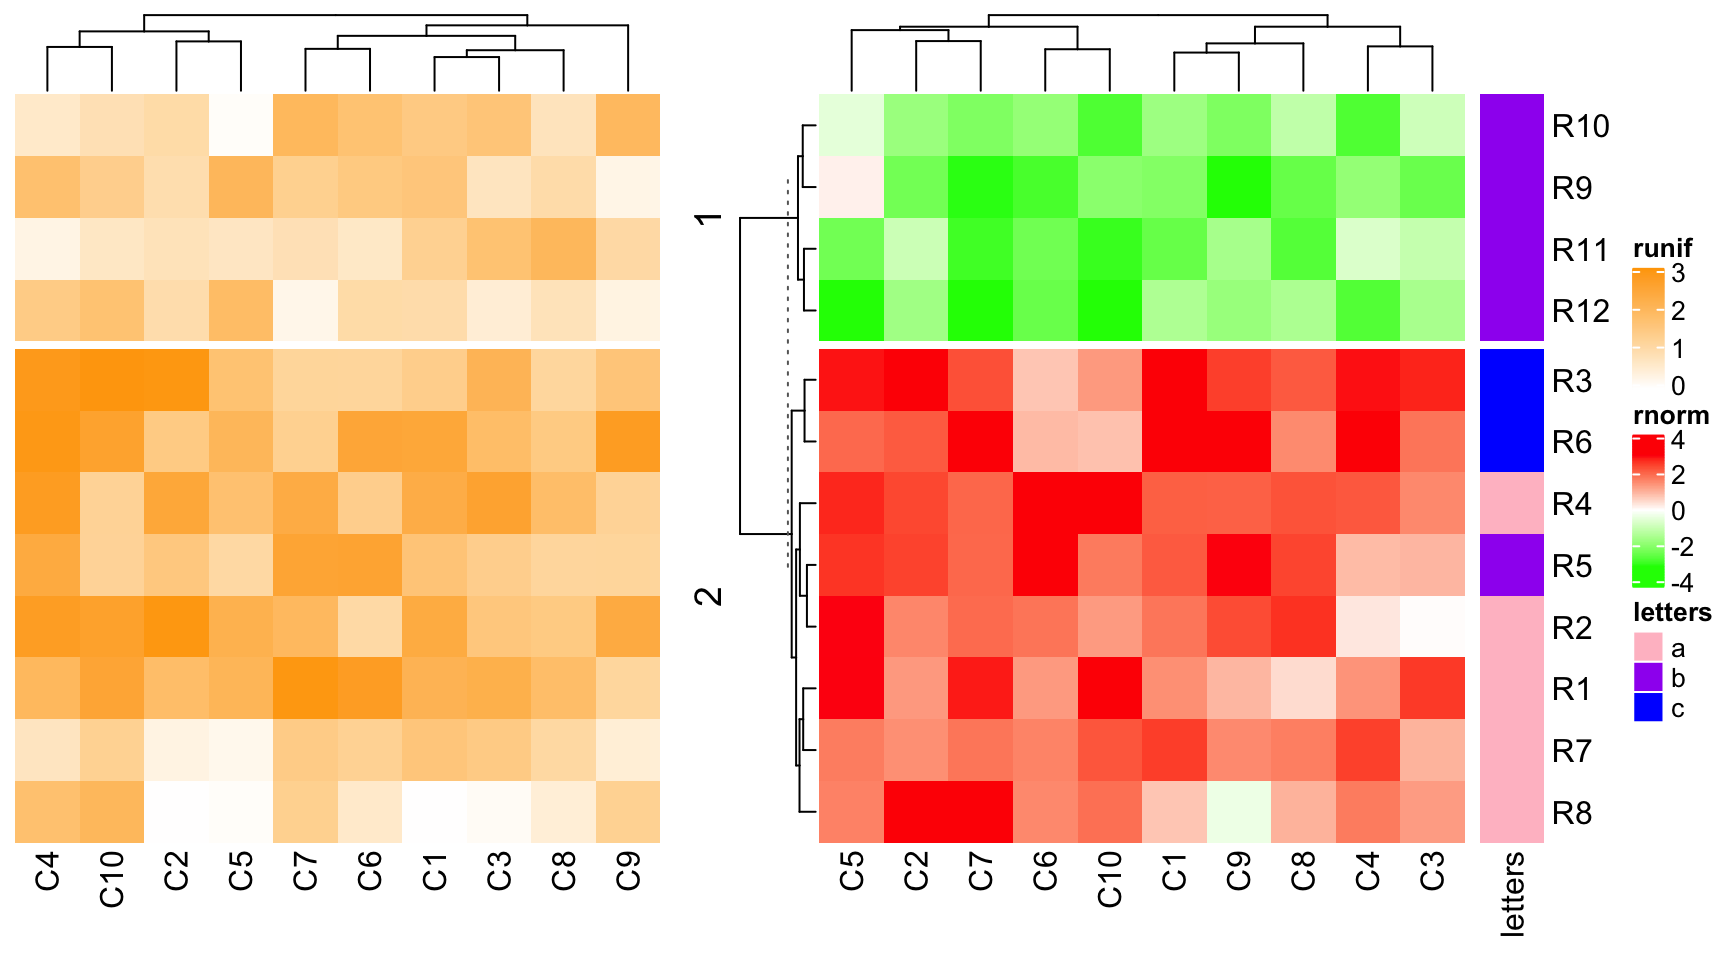
ht_list = ht2 + ht1 + ht3draw(ht_list, main_heatmap = "rnorm", row_dend_side = "right", row_sub_title_side = "left")

Similarly, if there is no row clustering in the main heatmap, all other heatmaps are not clustered neither.
ht1 = Heatmap(mat1, name = "rnorm", col = col_rnorm, cluster_rows = FALSE)ht2 = Heatmap(mat2, name = "runif", col = col_runif)ht3 = Heatmap(le, name = "letters", col = col_letters)ht1 + ht2 + ht3

As you may have observed, all the row names between heatmaps are removed from the plot. You can show them by setting
auto_adjust = FALSE.
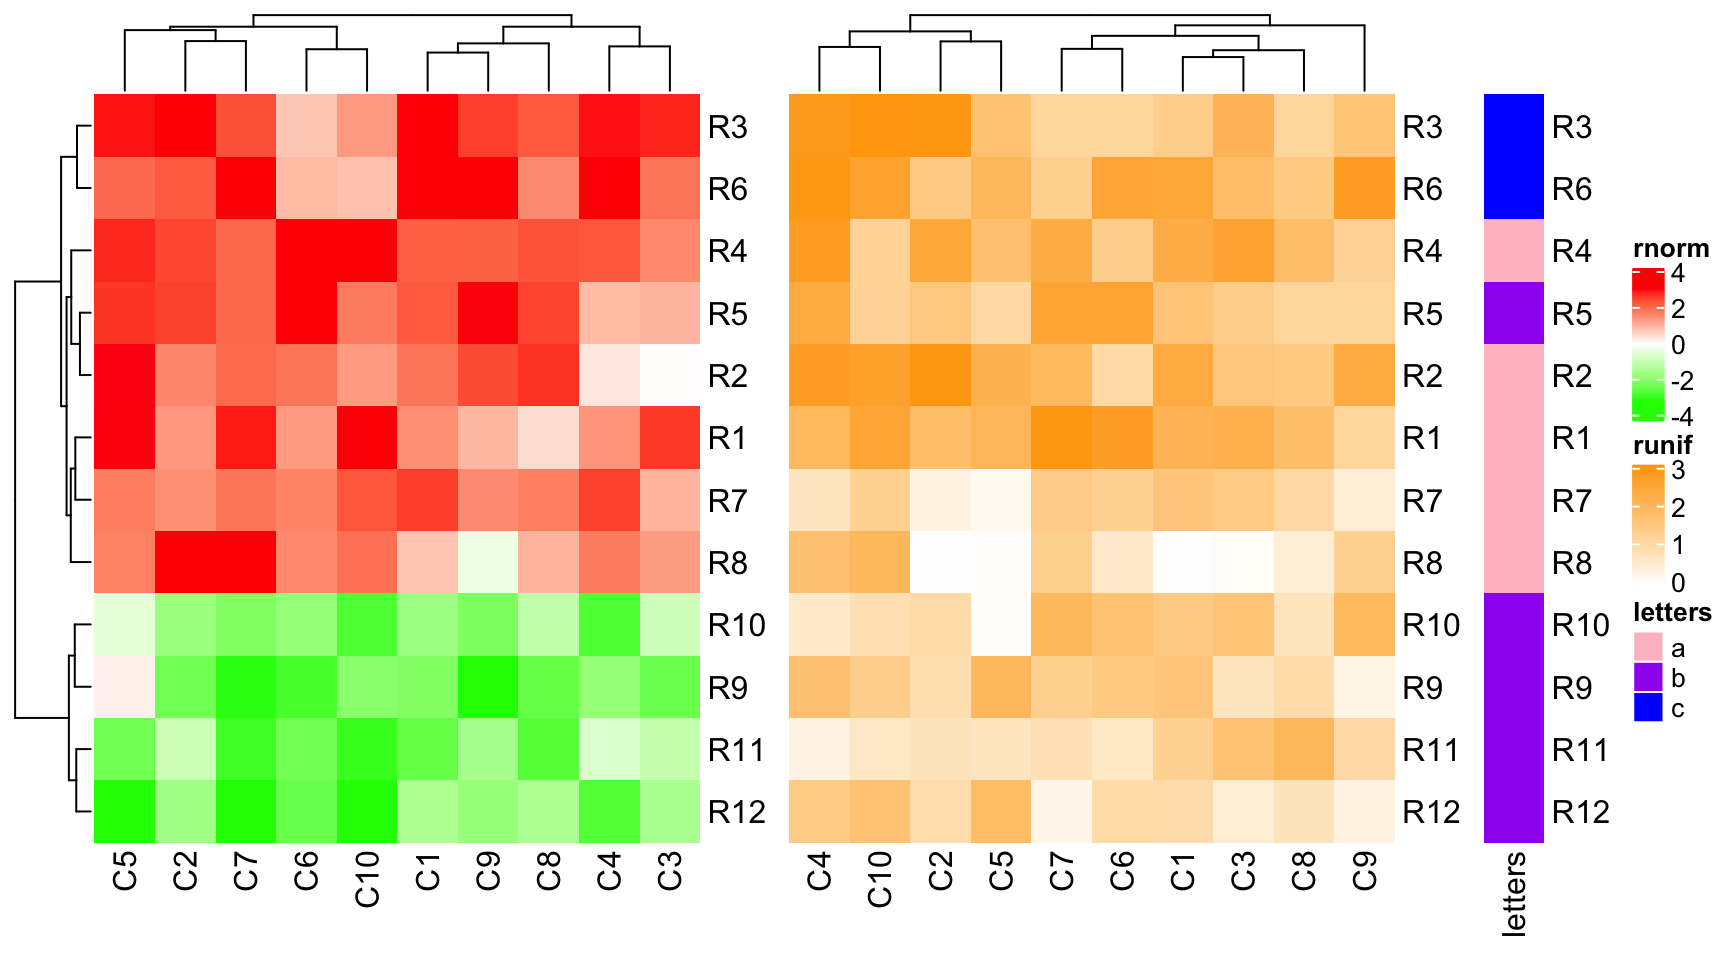
ht1 = Heatmap(mat1, name = "rnorm", col = col_rnorm)ht2 = Heatmap(mat2, name = "runif", col = col_runif)ht3 = Heatmap(le, name = "letters", col = col_letters)ht_list = ht1 + ht2 + ht3draw(ht_list, auto_adjust = FALSE)


