作者:Zuguang Gu8
编译:Steven Shen
原文:Change parameters globally
ht_opt()is an option function which controls some parameters globally. You can set some parameters for all heatmaps/annotations simultaneously by this global function. Please note you should put it before your heatmap code and reset all option values after drawing the heatmaps to get rid of affecting next heatmap.
ht_opt## Option Value## heatmap_row_names_gp NULL## heatmap_column_names_gp NULL## heatmap_row_title_gp NULL## heatmap_column_title_gp NULL## legend_title_gp NULL## legend_title_position NULL## legend_labels_gp NULL## legend_grid_height NULL## legend_grid_width NULL## legend_border NULL## heatmap_border NULL## annotation_border NULL## fast_hclust FALSE## show_parent_dend_line TRUE## verbose FALSE## show_vp FALSE## simple_anno_size 5mm## DENDROGRAM_PADDING 0.5mm## DIMNAME_PADDING 1mm## TITLE_PADDING 2.5mm## COLUMN_ANNO_PADDING 1mm## ROW_ANNO_PADDING 1mm
There are following parameters to control all heatmaps:
heatmap_row_names_gp: setrow_names_gpin allHeatmap().heatmap_column_names_gp: setcolumn_names_gpin allHeatmap().heatmap_row_title_gp: setrow_title_gpin allHeatmap().heatmap_column_title_gp: setcolumn_title_gpin allHeatmap().heatmap_border: setborderin allHeatmap().Following parameters control the legends:
legend_title_gp: settitle_gpin all heatmap legends and annotation legends.legend_title_position: settitle_positionin all heatmap legends and annotation legends.legend_labels_gp: setlabels_gpin all heatmap legends and annotation legends.legend_grid_width: setgrid_widthin all heatmap legends and annotation legends.legend_grid_height: setgrid_heightin all heatmap legends and annotation legends.legend_border: setborderin all heatmap legends and annotation legends.Following parameters control heatmap annotations:
annotation_border: setborderin allHeatmapAnnotation().anno_simple_size: set size for the simple annotation.Following parameters control the space between heatmap components:
DENDROGRAM_PADDING: space bewteen dendrograms and heatmap body.DIMNAME_PADDING: space between row/column names and heatmap body.TITLE_PADDING: space between row/column titles and heatmap body.COLUMN_ANNO_PADDING: space between column annotations and heatmap body.ROW_ANNO_PADDING: space between row annotations and heatmap body.Other parameters:
fast_hclust: whether usefastcluster::hclust()to speed up clustering?show_parent_dend_line: when heatmap is split, whether to add a dashed line to mark parent dendrogram and children dendrograms?You can get or set option values by the traditional way (like
base::options()) or by$operator:
ht_opt("heatmap_row_names_gp")ht_opt$heatmap_row_names_gp# to set option valuesht_opt("heatmap_row_names_gp" = gpar(fontsize = 8))ht_opt$heatmap_row_names_gp = gpar(fontsize = 8)
Reset to the default values by:
ht_opt(RESET = TRUE)
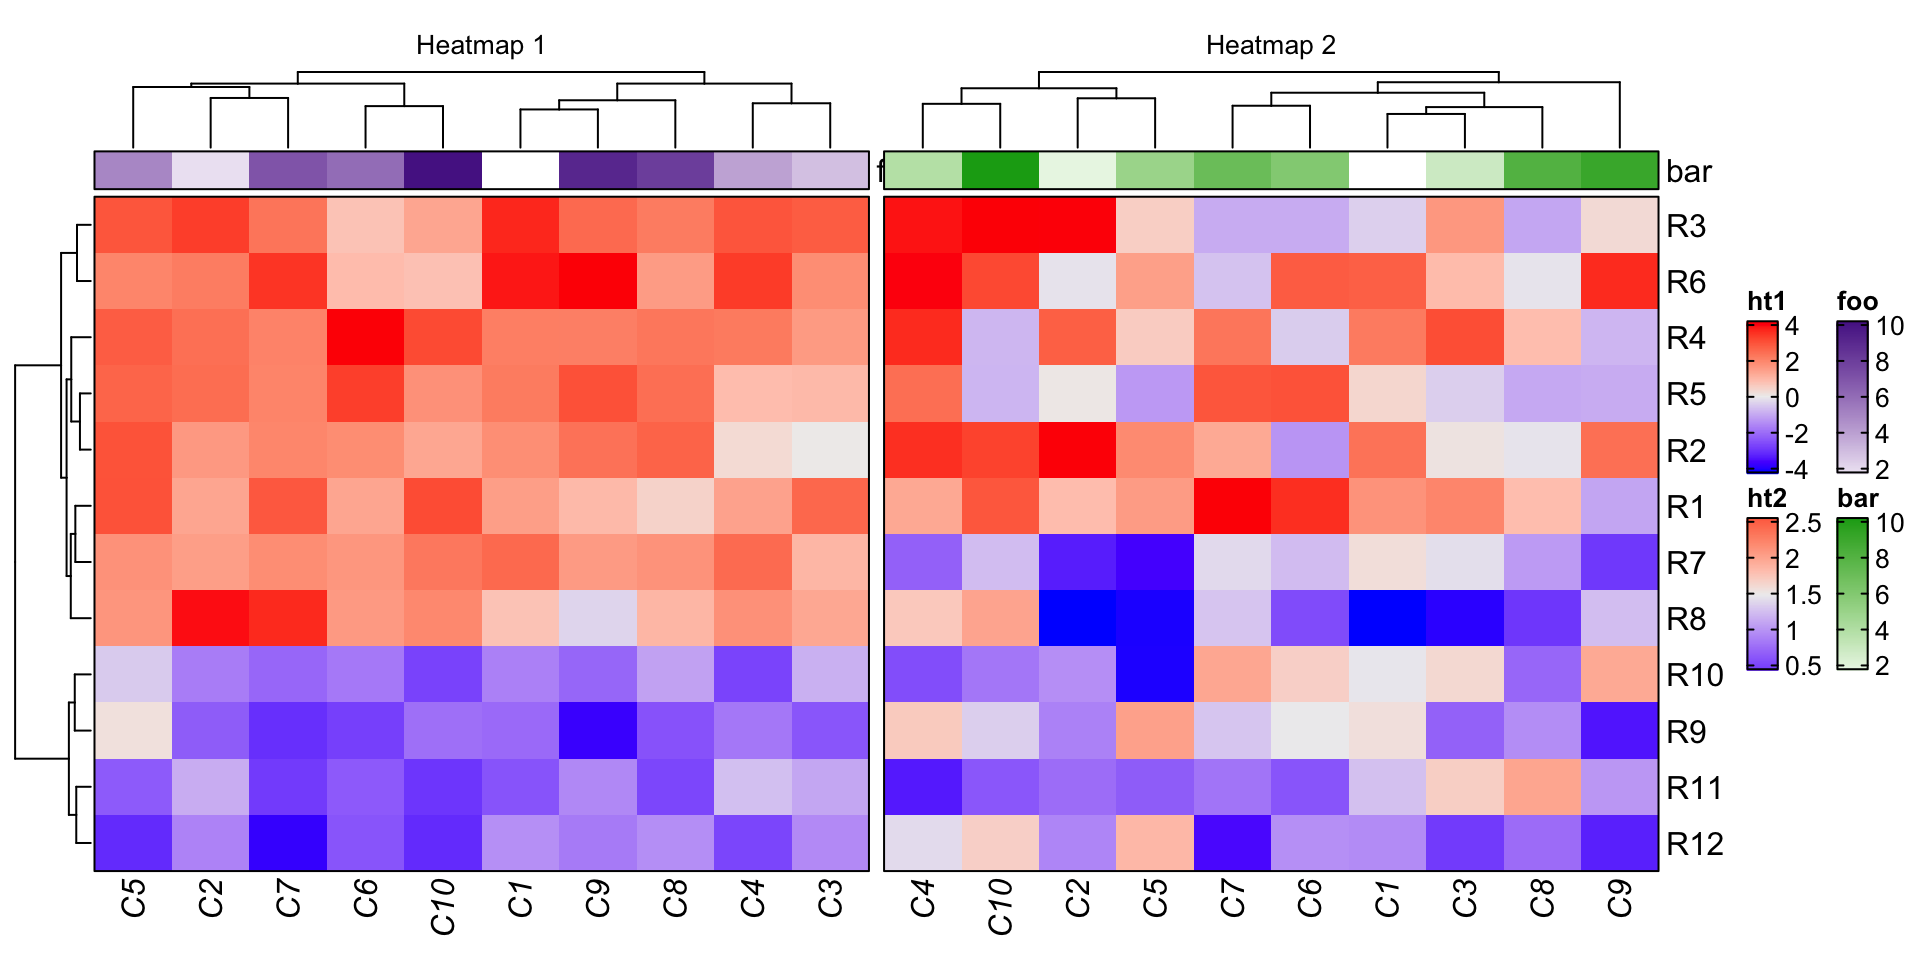
Following example shows to control some graphic parameters globally.
ht_opt(heatmap_column_names_gp = gpar(fontface = "italic"),heatmap_column_title_gp = gpar(fontsize = 10),legend_border = "black",heatmap_border = TRUE,annotation_border = TRUE)ht1 = Heatmap(mat1, name = "ht1", column_title = "Heatmap 1",top_annotation = HeatmapAnnotation(foo = 1:10))ht2 = Heatmap(mat2, name = "ht2", column_title = "Heatmap 2",top_annotation = HeatmapAnnotation(bar = 1:10))ht1 + ht2

ht_opt(RESET = TRUE)
These global parameters can also be set in the
draw()function to temporarily change the global parameters, and they are reset back after the plot is made. Please check the help page ofdraw,HeatmapList-method.

