作者:Zuguang Gu8
编译:Steven Shen
原文:2.3 Clustering
Clustering might be the key component of the heatmap visualization. In ComplexHeatmap package, hierarchical clustering is supported with great flexibility. You can specify the clustering either by:
- a pre-defined distance method (e.g.
"euclidean"or"pearson"), - a distance function,
- a object that already contains clustering (a
hclustordendrogramobject or object that can be coerced todendrogramclass), - a clustering function.
聚类可能是热图可视化的关键组成部分。 在 ComplexHeatmap 包中,支持分层聚类,具有很大的灵活性。 您可以通过以下方式指定聚类:
- 预定距离法(例如“欧几里德”或“皮尔逊”),
- 距离函数,
- 已经包含聚类的对象(一个
hclust或dendrogram对象,或者可以强制为dendrogram类的对象), - 一个聚类函数。
It is also possible to render the dendrograms with different colors and styles for different branches for better revealing structures of the dendrogram (e.g. by dendextend::color_branches()).
也可以为不同的分支渲染具有不同颜色和样式的树形图,以更好地揭示树形图的结构(例如通过 dendextend::color_branches() )。
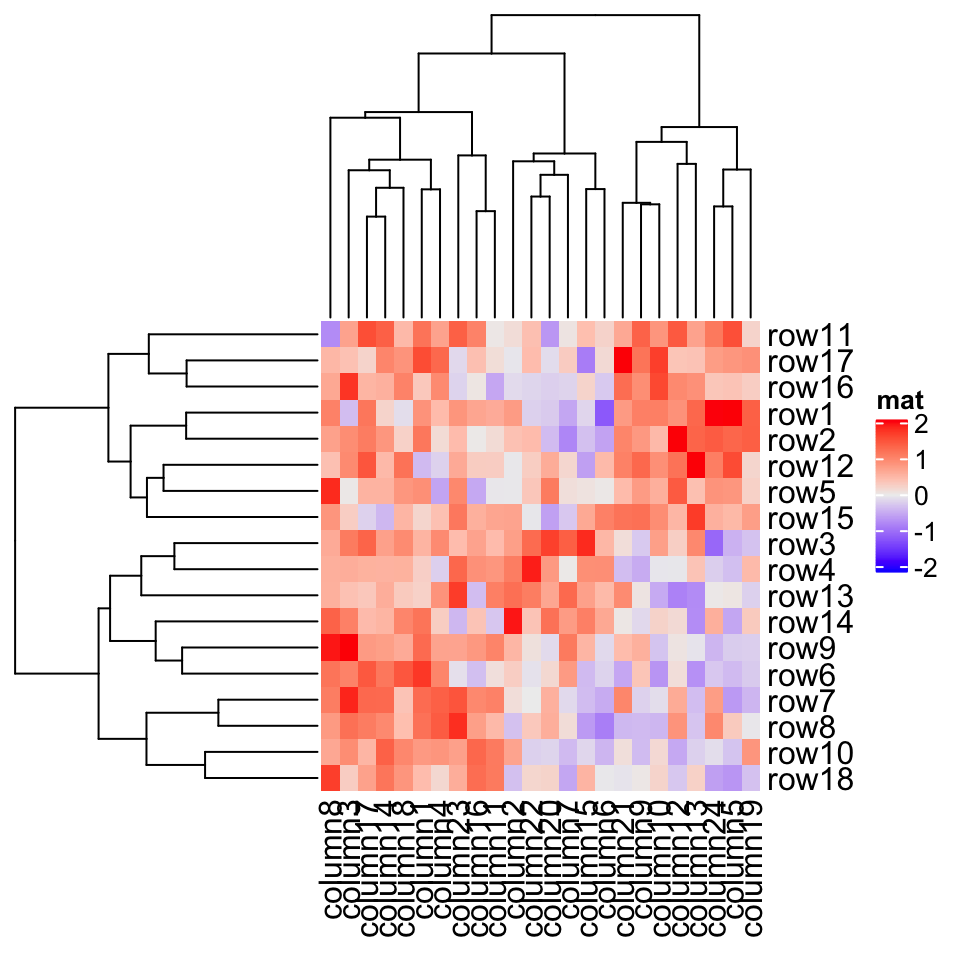
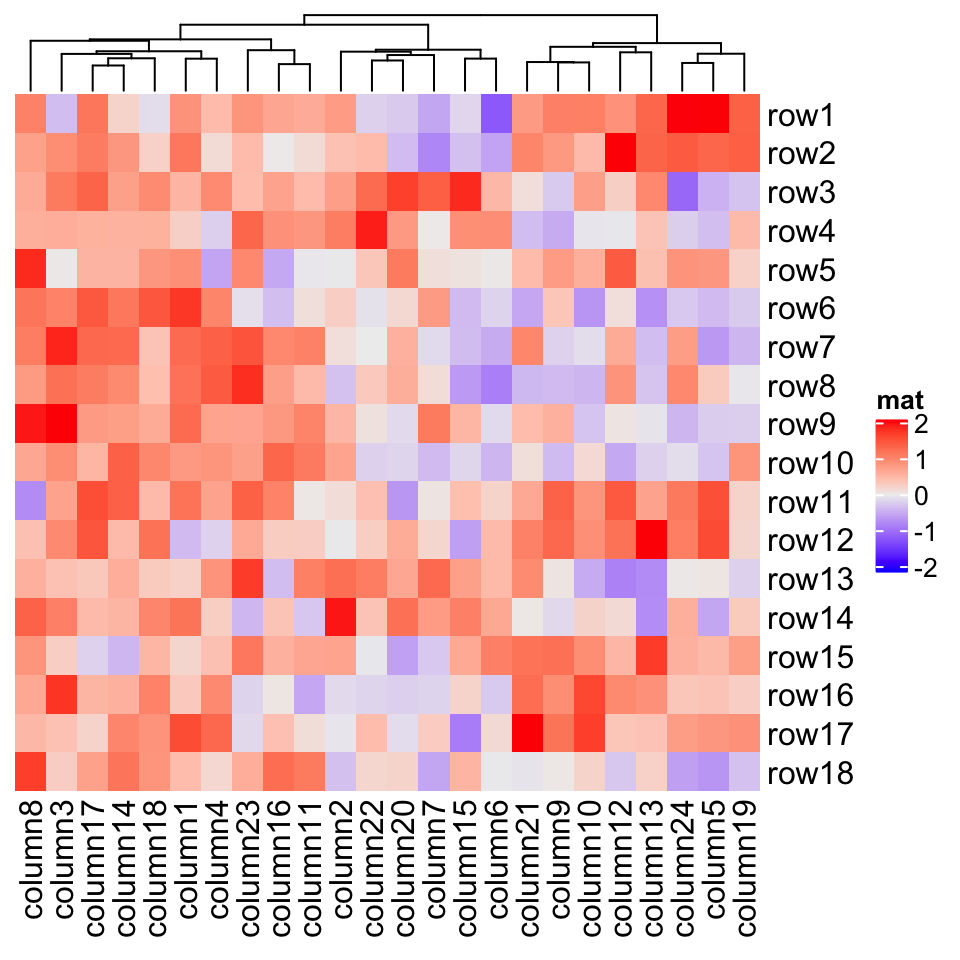
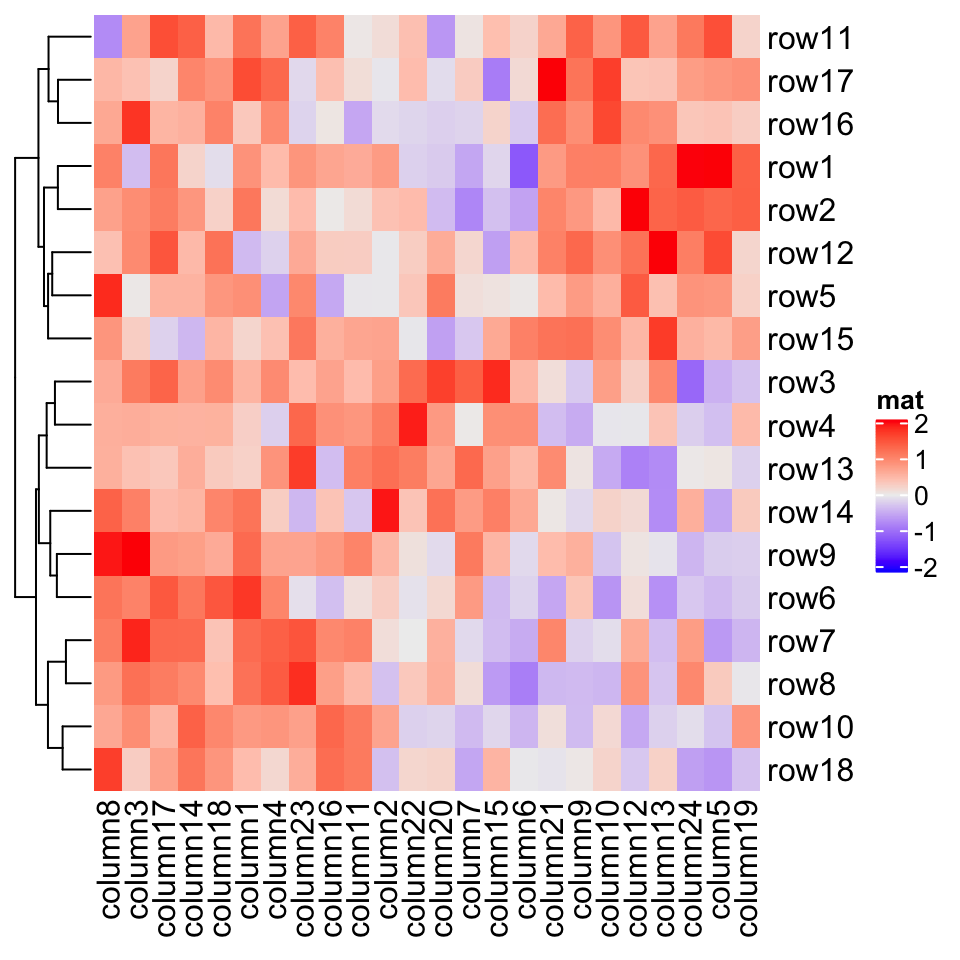
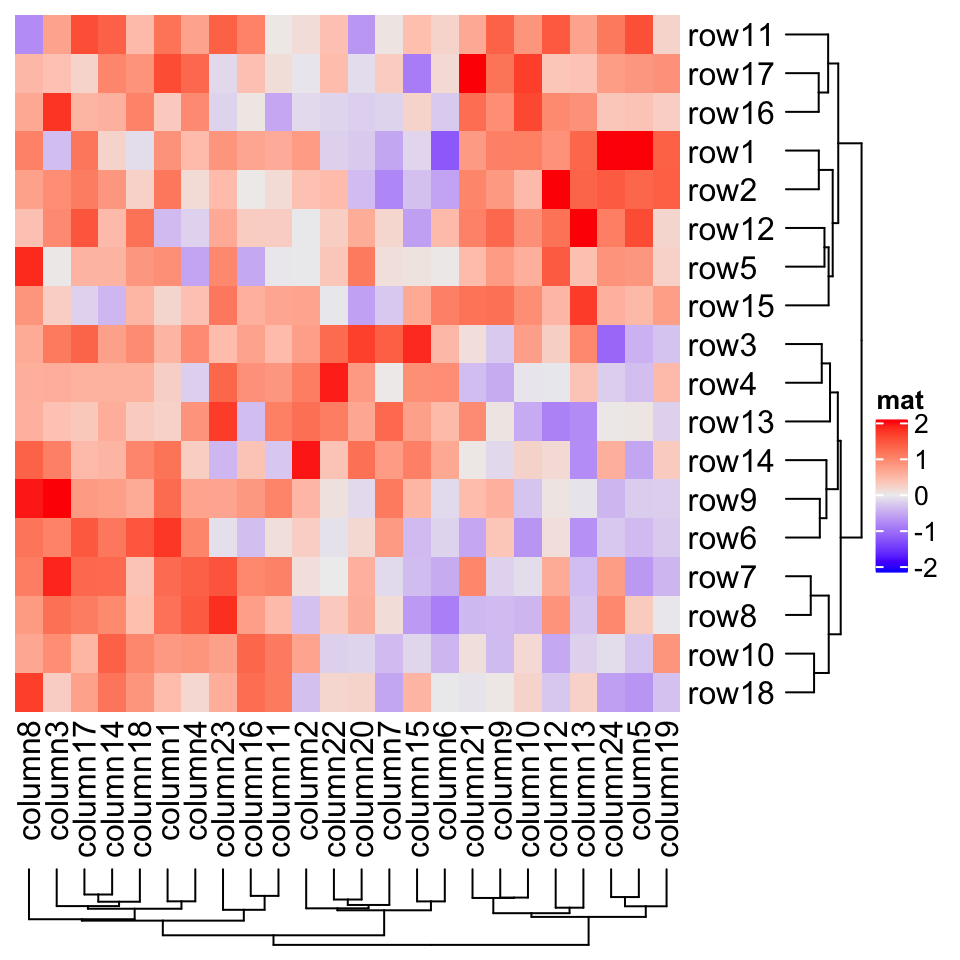
First, there are general settings for the clustering, e.g. whether apply clustering or show dendrograms, the side of the dendrograms and heights of the dendrograms.
首先,有一般的聚类设置,例如,是否应用聚类或显示树状图,哪一侧绘制树形图和树形图的高度。
Heatmap(mat, name = "mat", cluster_rows = FALSE) # turn off row clustering
Heatmap(mat, name = "mat", show_column_dend = FALSE) # hide column dendrogram
Heatmap(mat, name = "mat", row_dend_side = "right", column_dend_side = "bottom")
Heatmap(mat, name = "mat", column_dend_height = unit(4, "cm"),row_dend_width = unit(4, "cm"))
2.3.1 距离方法
Hierarchical clustering is performed in two steps: calculate the distance matrix and apply clustering. There are three ways to specify distance metric for clustering:
- specify distance as a pre-defined option. The valid values are the supported methods in
dist()function and in"pearson","spearman"and"kendall". The correlation distance is defined as1 - cor(x, y, method). All these built-in distance methods allowNAvalues. - a self-defined function which calculates distance from a matrix. The function should only contain one argument. Please note for clustering on columns, the matrix will be transposed automatically.
- a self-defined function which calculates distance from two vectors. The function should only contain two arguments. Note this might be slow because it is implemented by two nested
forloop.
分层聚类分两步执行:计算距离矩阵并应用聚类。有三种方法可以指定聚类的距离尺度:
- 将距离指定为预定义选项。有效值是在
dist()函数和"pearson","spearman"和"kendall"中支持的方法。相关距离定义为1 - cor(x, y, method)。所有这些内置距离方法都允许NA值。 - 自定义函数,用于计算距矩阵的距离。该函数应该只包含一个参数。请注意,对于列上的聚类,矩阵将自动转置。
- 一个自定义函数,用于计算两个向量的距离。该函数应该只包含两个参数。请注意,这可能很慢,因为它是由两个嵌套的
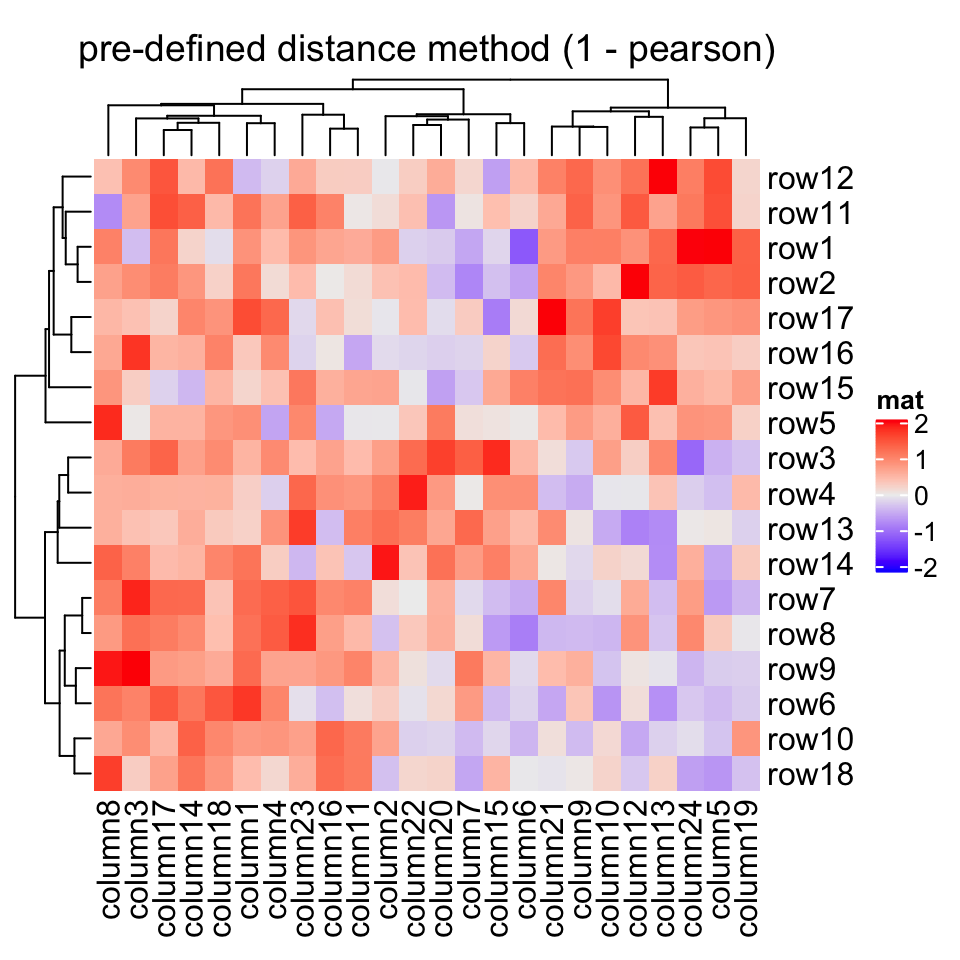
for循环实现的。Heatmap(mat, name = "mat", clustering_distance_rows = "pearson",column_title = "pre-defined distance method (1 - pearson)")
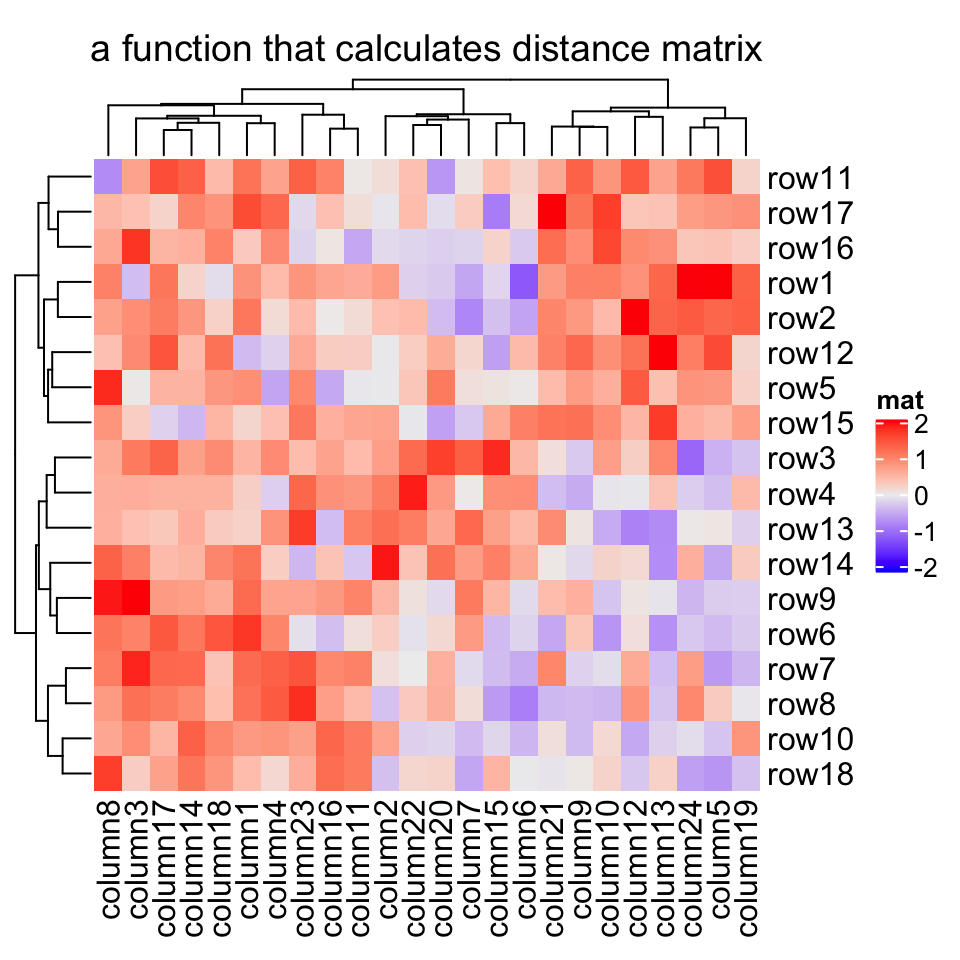
Heatmap(mat, name = "mat", clustering_distance_rows = function(m) dist(m),column_title = "a function that calculates distance matrix")
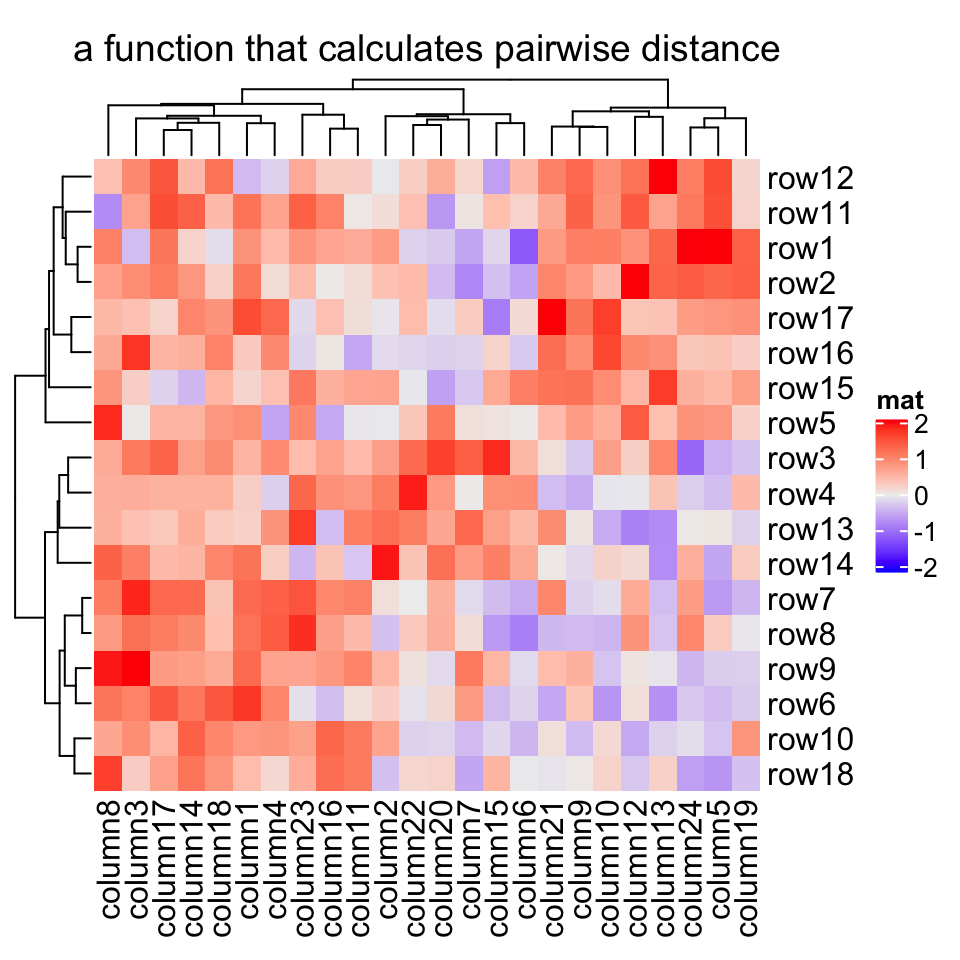
Heatmap(mat, name = "mat", clustering_distance_rows = function(x, y) 1 - cor(x, y),column_title = "a function that calculates pairwise distance")
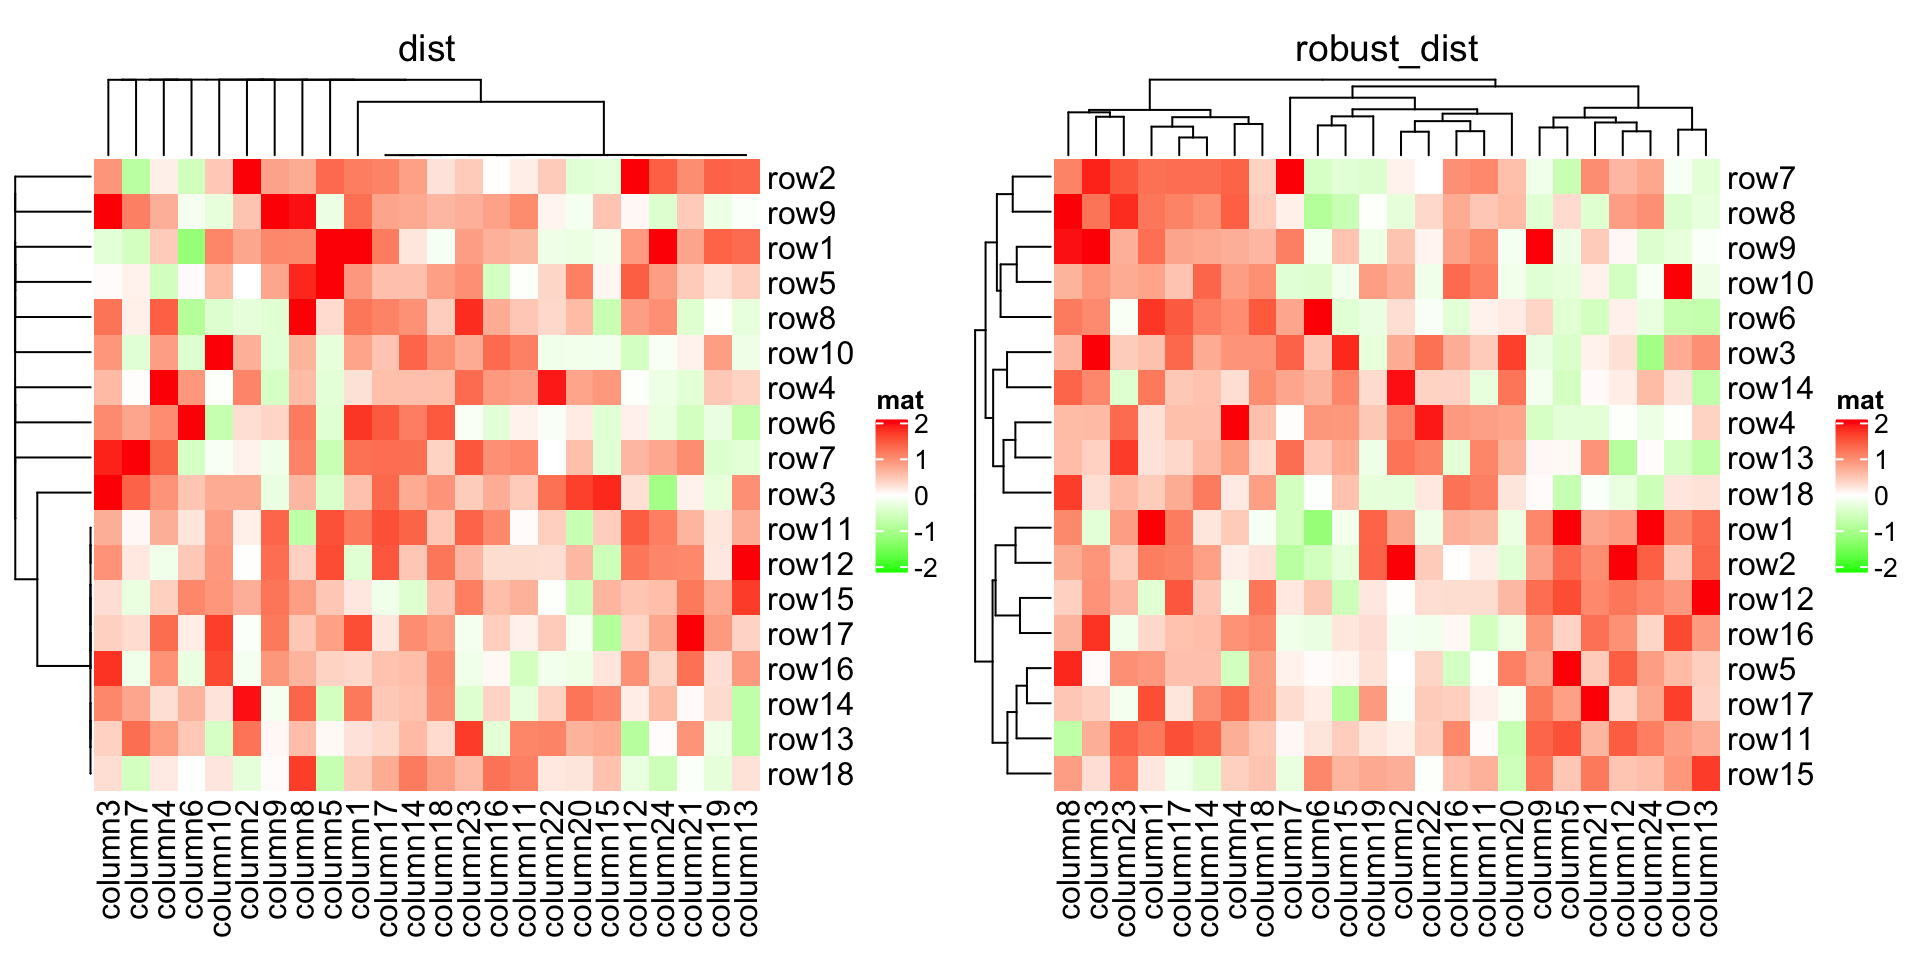
Based on these features, we can apply clustering which is robust to outliers based on the pairwise distance. Note here we set the color mapping function because we don’t want outliers affect the colors.
基于这些特征,在成对距离的基础上我们可以应用对异常值具有稳健性(robust)的聚类。请注意,我们设置颜色映射功能,因为我们不希望异常值影响颜色。
mat_with_outliers = matfor(i in 1:10) mat_with_outliers[i, i] = 1000robust_dist = function(x, y) {qx = quantile(x, c(0.1, 0.9))qy = quantile(y, c(0.1, 0.9))l = x > qx[1] & x < qx[2] & y > qy[1] & y < qy[2]x = x[l]y = y[l]sqrt(sum((x - y)^2))}
We can compare the two heatmaps with or without the robust distance method:
我们可以比较一下使用或不使用 robust distance 方法的两种热图:
Heatmap(mat_with_outliers, name = "mat",col = colorRamp2(c(-2, 0, 2), c("green", "white", "red")),column_title = "dist")Heatmap(mat_with_outliers, name = "mat",col = colorRamp2(c(-2, 0, 2), c("green", "white", "red")),clustering_distance_rows = robust_dist,clustering_distance_columns = robust_dist,column_title = "robust_dist")
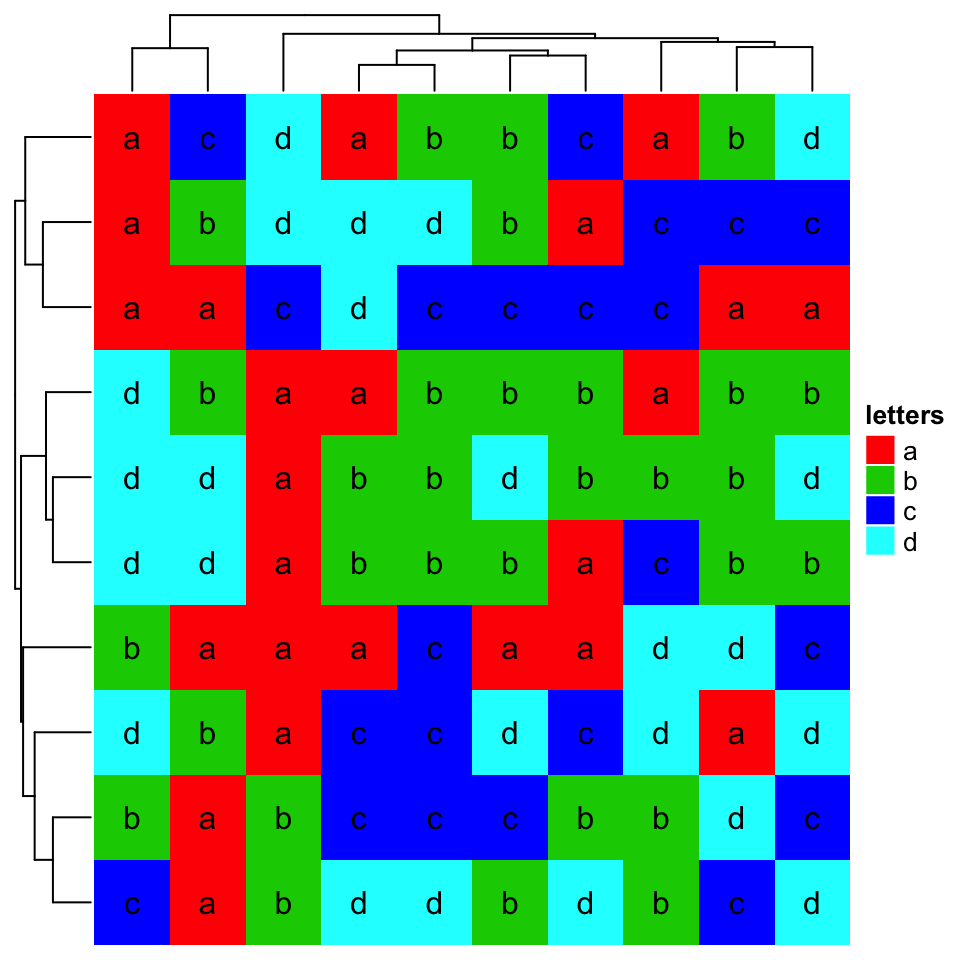
If there are proper distance methods (like methods in stringdist package), you can also cluster a character matrix. cell_fun argument will be introduced in Section 2.9.
如果有适当的距离方法(如 stringdist 包中的方法),您还可以聚类字符矩阵。 cell_fun 参数将在 2.9 节中介绍。
mat_letters = matrix(sample(letters[1:4], 100, replace = TRUE), 10)# distance in the ASCII tabledist_letters = function(x, y) {x = strtoi(charToRaw(paste(x, collapse = "")), base = 16)y = strtoi(charToRaw(paste(y, collapse = "")), base = 16)sqrt(sum((x - y)^2))}Heatmap(mat_letters, name = "letters", col = structure(2:5, names = letters[1:4]),clustering_distance_rows = dist_letters, clustering_distance_columns = dist_letters,cell_fun = function(j, i, x, y, w, h, col) { # add text to each gridgrid.text(mat_letters[i, j], x, y)})
2.3.2 聚类方法
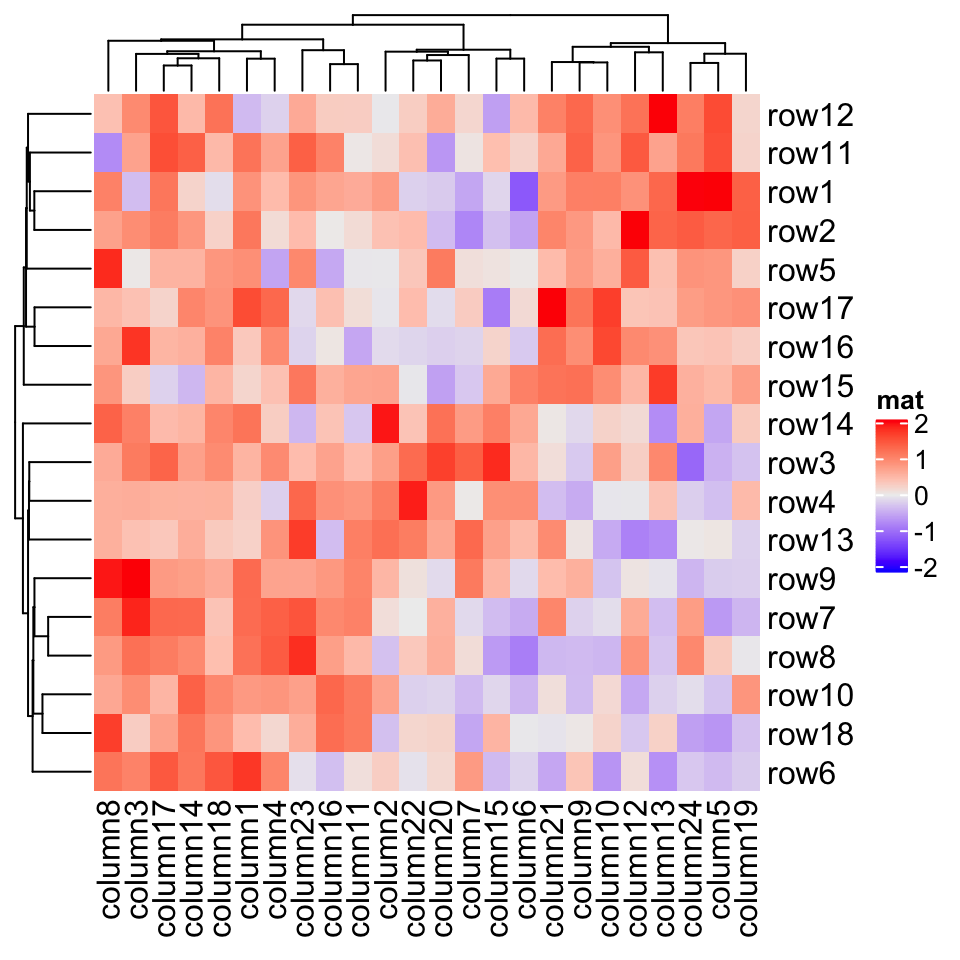
Method to perform hierarchical clustering can be specified by clustering_method_rows and clustering_method_columns. Possible methods are those supported in hclust() function.
可以通过 clustering_method_rows 和 clustering_method_columns 指定执行分层聚类的方法。可能的方法是 hclust() 函数支持的方法。
Heatmap(mat, name = "mat", clustering_method_rows = "single")
If you already have a clustering object or a function which directly returns a clustering object, you can ignore the distance settings and set cluster_rows or cluster_columns to the clustering objects or clustering functions. If it is a clustering function, the only argument should be the matrix and it should return a hclust or dendrogram object or a object that can be coerced to the dendrogram class.
如果已有聚类对象或已经有一个可以直接返回聚类对象的函数,则可以忽略距离设置并将 cluster_rows 或 cluster_columns 设置为聚类对象或聚类函数。如果它是一个聚类函数,矩阵应该是它唯一的参数,它应该返回一个 hclust 或树形图对象或一个可以强制转换为树形图类的对象。
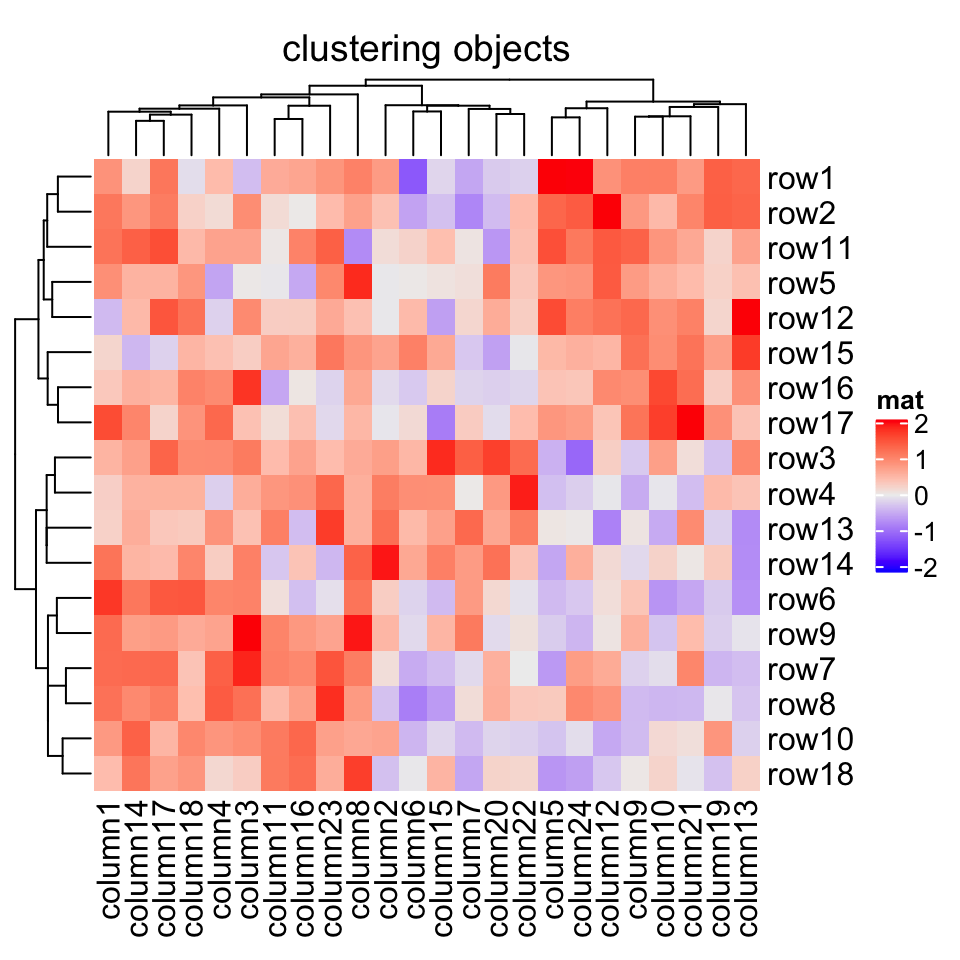
In following example, we perform clustering with methods from cluster package either by a pre-calculated clustering object or a clustering function:
在下面的示例中,我们通过使用 cluster 包中预先计算的聚类对象,或聚类函数,执行聚类:
library(cluster)Heatmap(mat, name = "mat", cluster_rows = diana(mat),cluster_columns = agnes(t(mat)), column_title = "clustering objects")
# if cluster_columns is set as a function, you don't need to transpose the matrixHeatmap(mat, name = "mat", cluster_rows = diana,cluster_columns = agnes, column_title = "clustering functions")
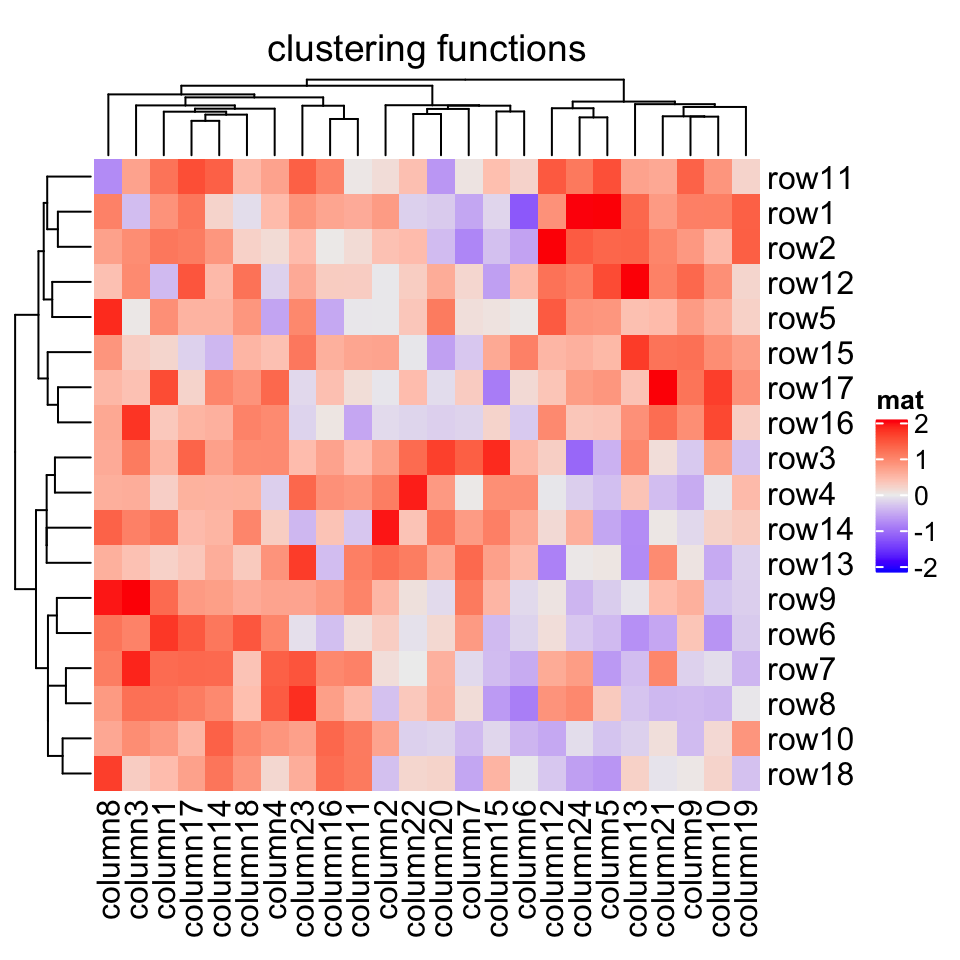
The last command is as same as :
最后一个命令与下面是一样的:
# code only for demonstrationHeatmap(mat, name = "mat", cluster_rows = function(m) as.dendrogram(diana(m)),cluster_columns = function(m) as.dendrogram(agnes(m)),column_title = "clutering functions")
Please note, when cluster_rows is set as a function, the argument m is the input mat itself, while for cluster_columns, m is the transpose of mat.
请注意,当 cluster_rows 设置为函数时,参数 m 是输入 mat 本身,而对于 cluster_columns , m 是 mat 的转置。
fastcluster::hclust implements a faster version of hclust(). You can set it to cluster_rows and cluster_columns to use the faster version of hclust().fastcluster::hclust 实现了更快版本的 hclust() 。您可以将其设置为 cluster_rows 和 cluster_columns 以使用更快版本的 hclust() 。
# code only for demonstrationfh = function(x) fastcluster::hclust(dist(x))Heatmap(mat, name = "mat", cluster_rows = fh, cluster_columns = fh)
To make it more convinient to use the faster version of hclust() (assuming you have many heatmaps to construct), it can be set as a global option. The usage of ht_opt is introduced in Section 4.13.
为了更方便地使用更快版本的 hclust() (假设您要构建许多热图),可以将其设置为全局选项。第 4.13 节介绍了 ht_opt 的用法。
# code only for demonstrationht_opt$fast_hclust = TRUE# now fastcluster::hclust is used in all heatmaps
This is one specific scenario that you might already have a subgroup classification for the matrix rows or columns, and you only want to perform clustering for the features in the same subgroup. There is one way that you can split the heatmap by the subgroup variable (see Section 2.7), or you can use cluster_within_group() clustering function to generate a special dendrogram.
这是一个特定的场景,您可能已经有矩阵的行或列组成的子组分类,并且您只想对同一子组中的要素执行聚类。有一种方法可以通过子组变量拆分热图(参见第 2.7 节),或者可以使用 cluster_within_group() 聚类函数生成特殊的树形图。
group = kmeans(t(mat), centers = 3)$clusterHeatmap(mat, name = "mat", cluster_columns = cluster_within_group(mat, group))
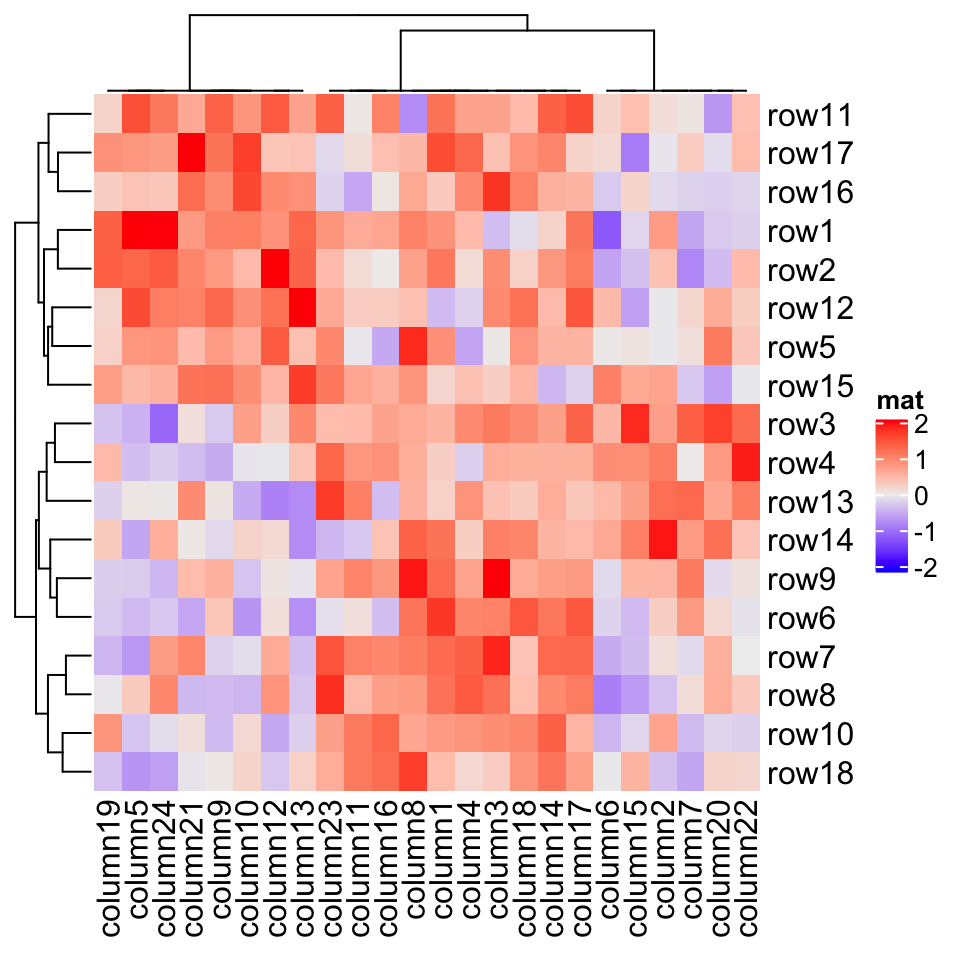
In above example, columns in a same group are still clustered, but the dendrogram is degenerated as a flat line. The dendrogram on columns shows the hierarchy of the groups.
在上面的示例中,同一组中的列仍然是聚类的,但树形图退化为扁平线。列上的树形图显示了组的层次结构。
2.3.3 渲染树状图
If you want to render the dendrogram, normally you need to generate a dendrogram object and render it in the first place, then send it to the cluster_rows or cluster_columns argument.
如果要渲染树形图,通常需要生成一个 dendrogram 对象并在第一个位置渲染它,然后将其传递给 cluster_rows 或 cluster_columns 参数。
You can render your dendrogram object by the dendextend package to make a more customized visualization of the dendrogram. Note ComplexHeatmap only allows rendering on the dendrogram lines.
您可以通过 dendextend 包渲染树形图对象,以更加自定义树形图的可视化。注意 ComplexHeatmap 仅允许在树形图线上进行渲染。
library(dendextend)row_dend = as.dendrogram(hclust(dist(mat)))row_dend = color_branches(row_dend, k = 2) # `color_branches()` returns a dendrogram objectHeatmap(mat, name = "mat", cluster_rows = row_dend)
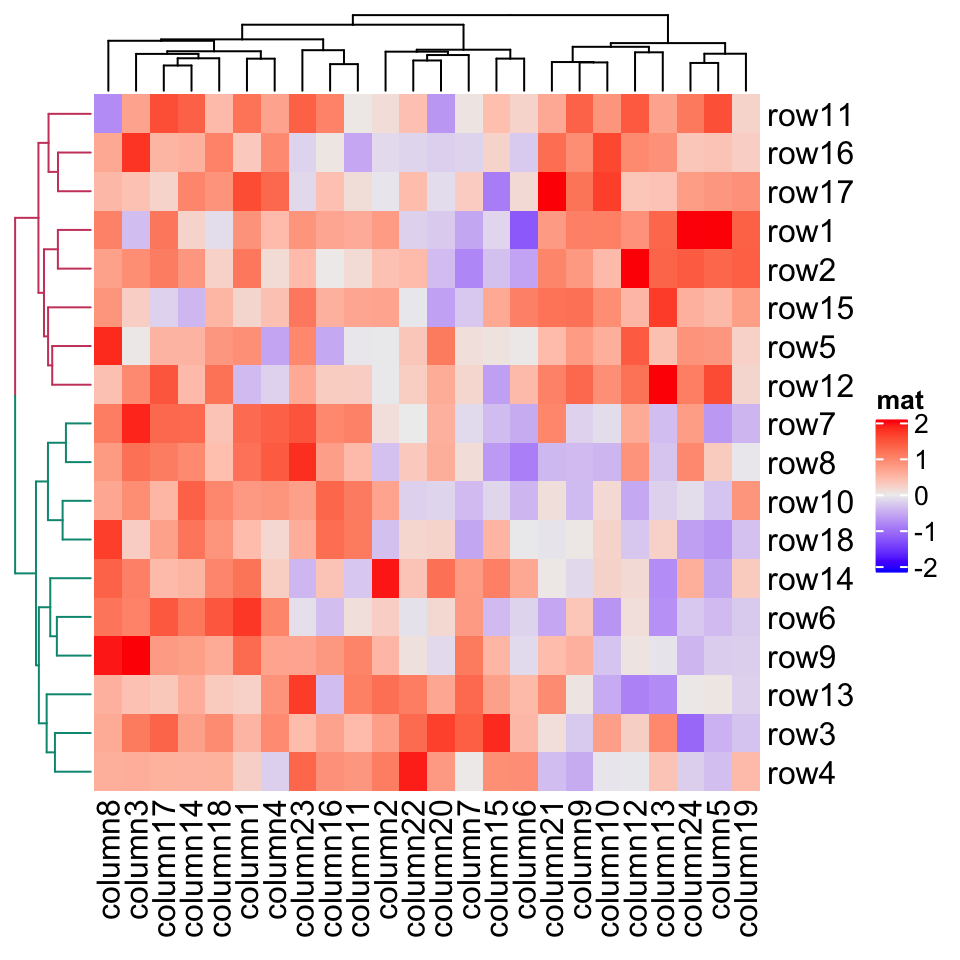
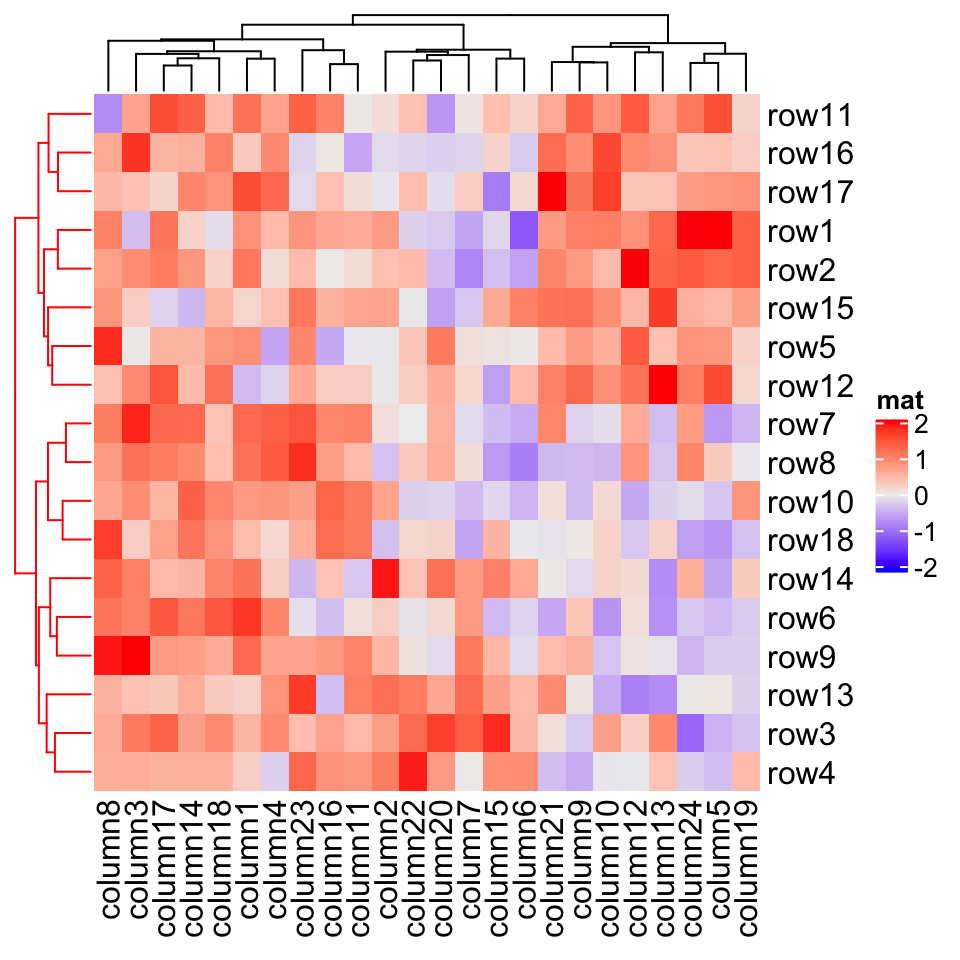
row_dend_gp and column_dend_gp control the global graphic setting for dendrograms. Note e.g. graphic settings in row_dend will be overwritten by row_dend_gp.row_dend_gp 和 column_dend_gp 控制树形图的全局图形设置。注意,例如 row_dend 中的图形设置将被 row_dend_gp 覆盖。
Heatmap(mat, name = "mat", cluster_rows = row_dend, row_dend_gp = gpar(col = "red"))
2.3.4 重排序树状图
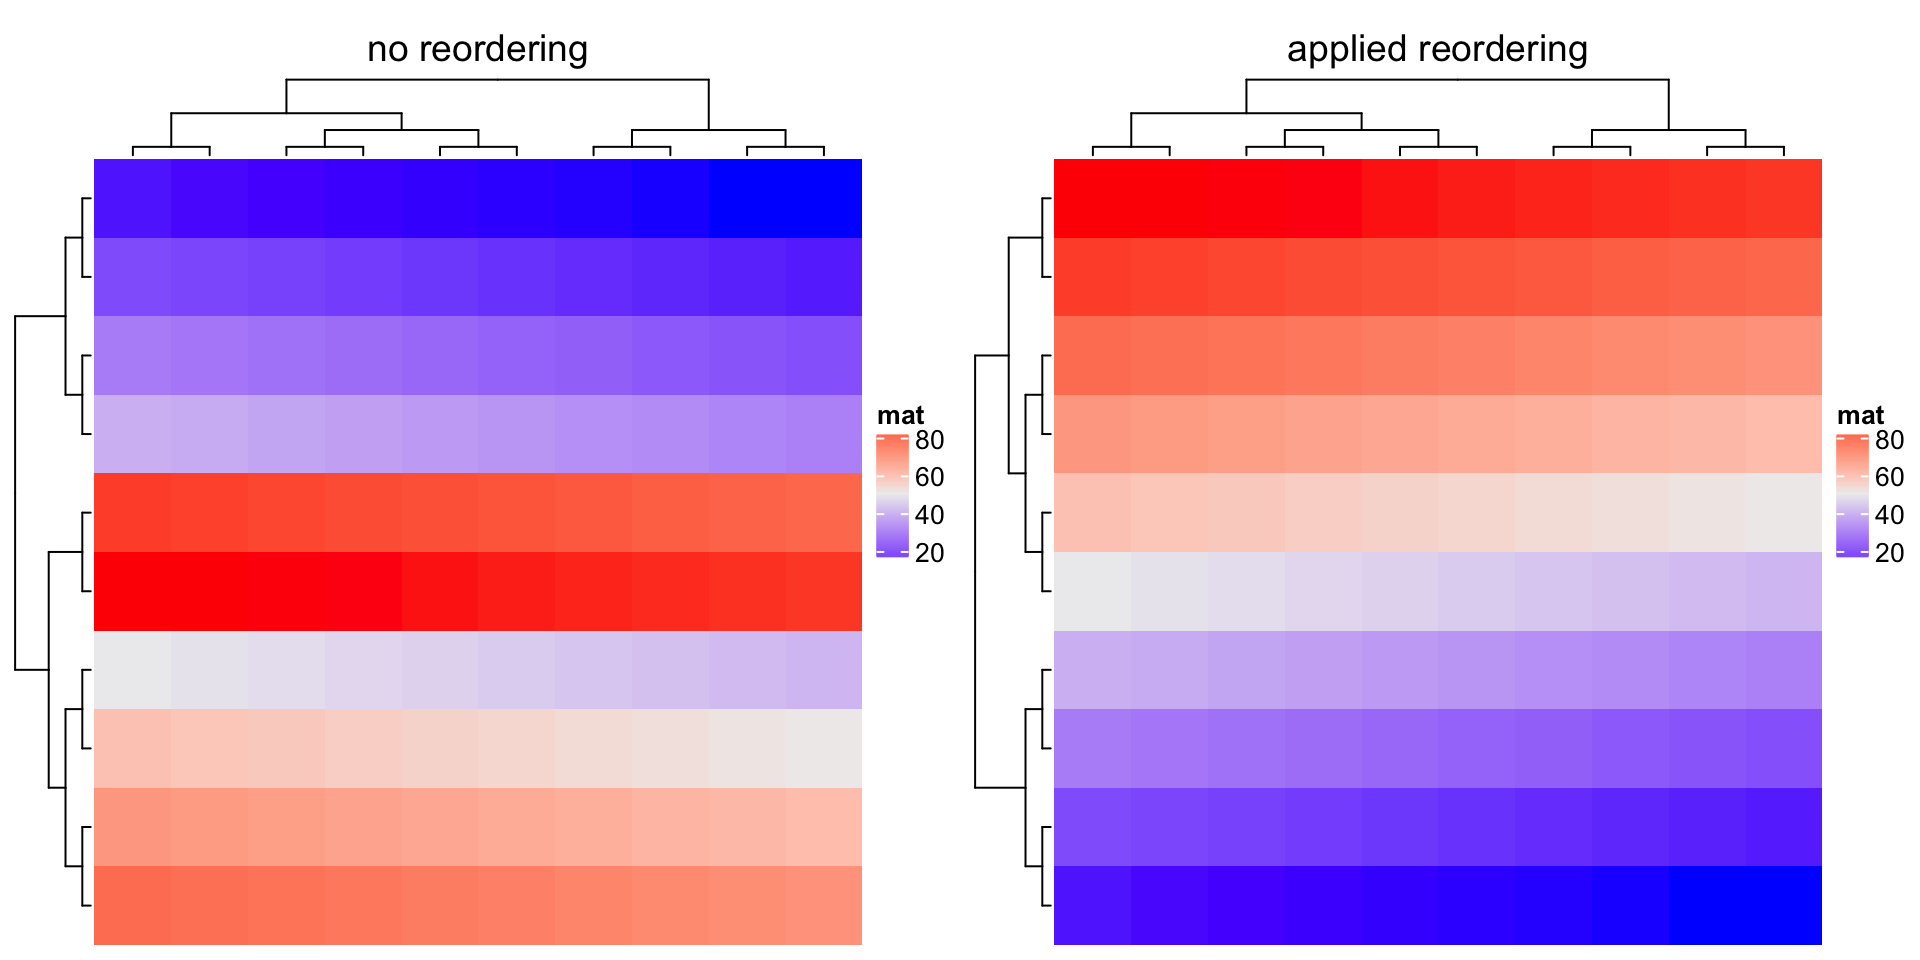
In the Heatmap() function, dendrograms are reordered to make features with larger difference more separated from each others (please refer to the documentation of reorder.dendrogram()). Here the difference (or it is called the weight) is measured by the row means if it is a row dendrogram or by the column means if it is a column dendrogram. row_dend_reorder and column_dend_reordercontrol whether to apply dendrogram reordering if the value is set as logical. The two arguments also control the weight for the reordering if they are set to numeric vectors (it will be sent to the wts argument of reorder.dendrogram()). The reordering can be turned off by setting e.g. row_dend_reorder = FALSE.
在 Heatmap() 函数中,重新排序树形图以使具有较大差异的特征彼此更加分离(请参阅 reorder.dendrogram() 的文档)。这里的差异(或称为权重)由行表示,如果它是行树形图;或者由列表示,如果它是列树状图。 row_dend_reorder 和 column_dend_reordercontrol 用于控制是否对树形图重新排序,如果将它们的值设置为逻辑值。如果将它们设置为数字向量,则这两个参数还控制重新排序的权重(它将被传递给 reorder.dendrogram() 的 wts 参数)。可以通过设置,如 row_dend_reorder = FALSE ,来关闭重新排序。
By default, dendrogram reordering is turned on if cluster_rows/cluster_columns is set as logical value or a clustering function. It is turned off if cluster_rows/cluster_columns is set as clustering object.
默认情况下,如果将 cluster_rows / cluster_columns 设置为逻辑值或聚类函数,则会开启树形图重新排序。如果将 cluster_rows / cluster_columns 设置为聚类对象,则会将其关闭。
Compare following two heatmaps:
比较以下两个热图:
m2 = matrix(1:100, nr = 10, byrow = TRUE)Heatmap(m2, name = "mat", row_dend_reorder = FALSE, column_title = "no reordering")Heatmap(m2, name = "mat", row_dend_reorder = TRUE, column_title = "apply reordering")
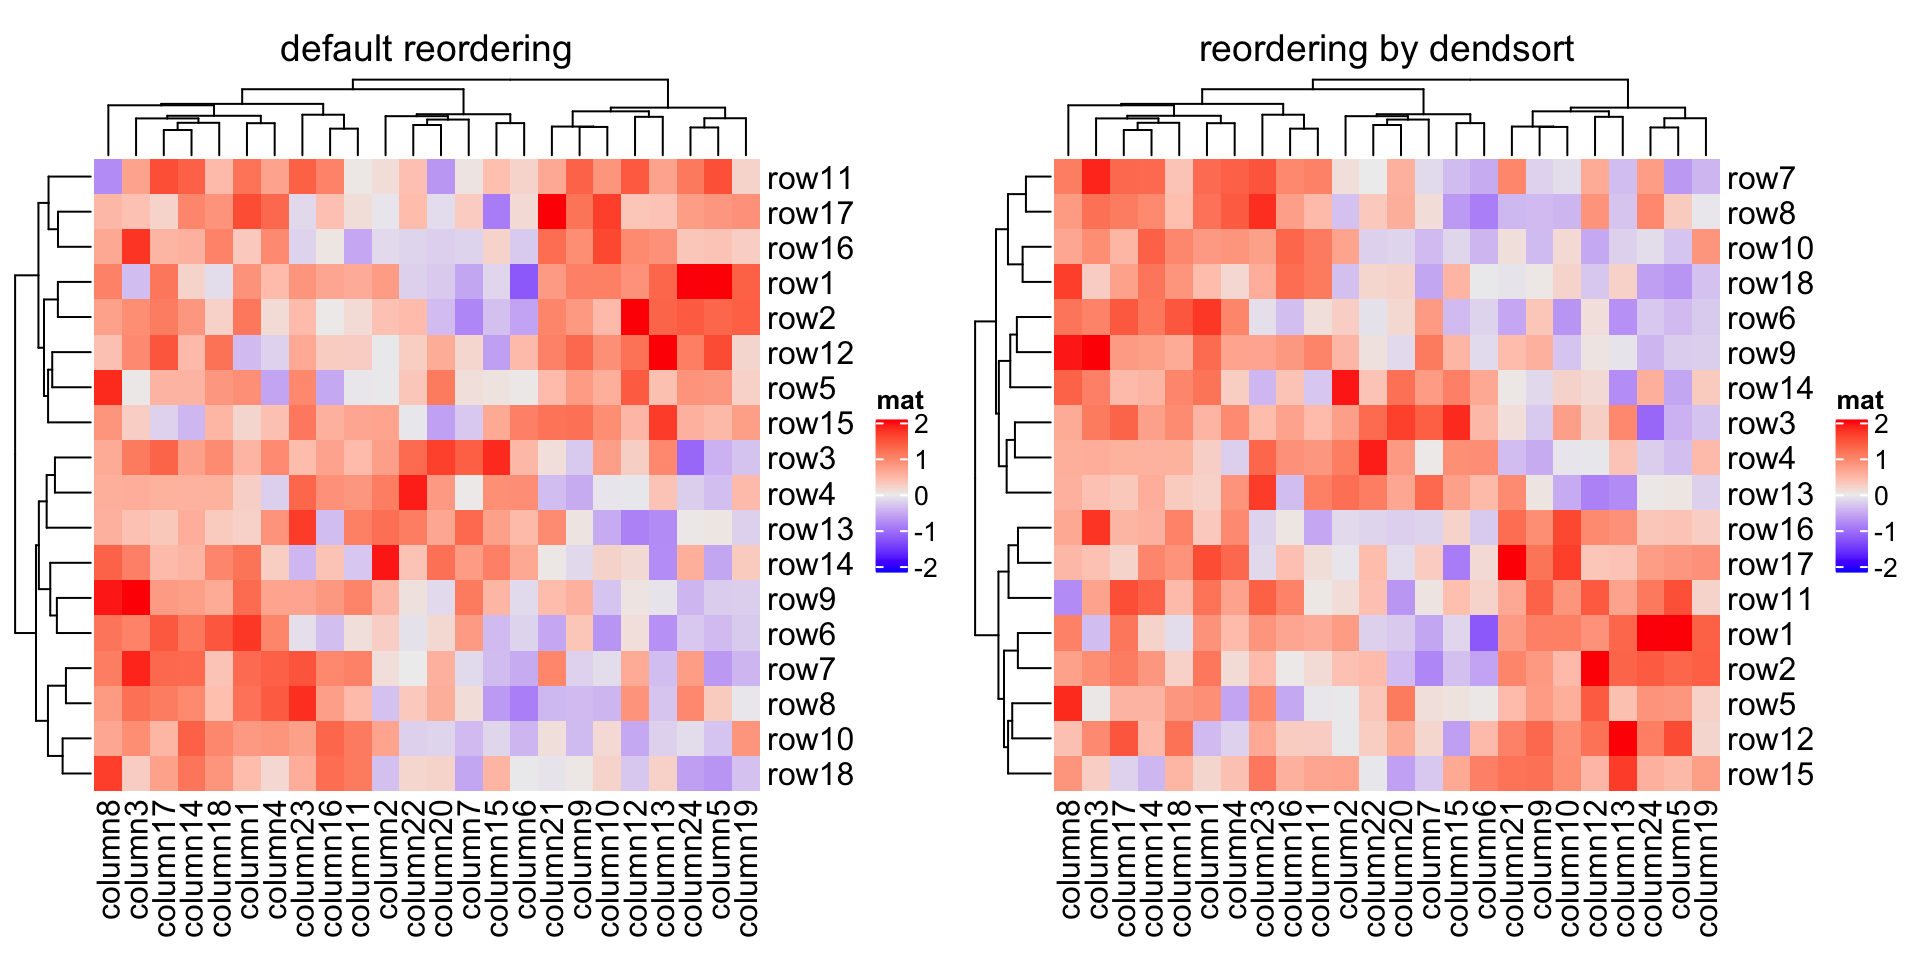
There are many other methods for reordering dendrograms, e.g. the dendsort package. Basically, all these methods still return a dendrogram that has been reordered, thus, we can firstly generate the row or column dendrogram based on the data matrix, reorder it by some method, and assign it back to cluster_rows or cluster_columns.
还有许多其他重新排序树形图的方法,例如, dendsort 包。基本上,所有这些方法仍然返回已重新排序的树形图,因此,我们可以首先根据数据矩阵生成行或列树形图,然后通过某种方法对其重新排序,并将其分配回 cluster_rows 或 cluster_columns 。
Compare following two reorderings. Can you tell which is better?
比较以下两个重新排序。 你能说出哪个更好吗?
Heatmap(mat, name = "mat", column_title = "default reordering")library(dendsort)dend = dendsort(hclust(dist(mat)))Heatmap(mat, name = "mat", cluster_rows = dend, column_title = "reorder by dendsort")
—— 本节完 ——
