作者:Zuguang Gu
翻译:Steven Shen
原文:https://jokergoo.github.io/ComplexHeatmap-reference/book/a-single-heatmap.html#customize-the-heatmap-body
2.9 自定义热图主体
2.9 Customize the heatmap body
The heatmap body can be self-defined to add more types of graphics. By default the heatmap body is composed by a matrix of small rectangles (it might be called grids in other parts of this documentation, but let’s call it “cells” here) with different filled colors. However, it is also possible to add more graphics or symbols as additional layers on the heatmap. There are two arguments
cell_funandlayer_funwhich both should be user-defined functions.
热图主体可以自定义以添加更多类型的图形。默认情况下,热图主体由一个具有不同的填充颜色小矩形矩阵(在本文档的其他部分可能称为网格,但在这里称之为”单元格”)组成。但是,我们也可以在热图上添加更多图形或符号作为附加图层。有两个参数 cell_fun 和 layer_fun ,它们都是用户可以自定义的函数。
2.9.1 cell_fun
cell_fundraws in each cell repeatedly, which is internally executed in two nestedforloops, whilelayer_funis the vectorized version ofcell_fun.cell_funis easier to understand butlayer_funis much faster to execute and more customizable.
cell_fun 用于重复绘制每个单元格,它在内部是通过两个嵌套 for 循环来执行的,而 layer_fun 是 cell_fun 的矢量化版本。 cell_fun 更容易理解,但是 layer_fun 执行起来要快得多,而且可以进行更多的自定义。
cell_funexpects a function with 7 arguments (the argument names can be different from following, but the order must be the same), which are:
j: column index in the matrix. Column index corresponds to the x-direction in the viewport, that’s whyjis put as the first argument.i: row index in the matrix.x: x coordinate of middle point of the cell which is measured in the viewport of the heatmap body.y: y coordinate of middle point of the cell which is measured in the viewport of the heatmap body.width: width of the cell. The value isunit(1/ncol(sub_mat), "npc")wheresub_matcorrespond to the sub-matrix by row splitting and column splitting.height: height of the cell. The value isunit(1/nrow(sub_mat), "npc").fill: color of the cell.
cell_fun 期望接收一个带有 7 个参数的函数(参数名称可以跟下面不一样,但顺序必须相同),它们是:
j:矩阵中的列索引。列索引对应于 viewport 中的 x-direction,这就是为什么将j作为第一个参数。i:矩阵中的行索引。x:在热图主体 viewport 中被测量的单元格中间点的 x 坐标。y:在热图主体 viewport 中被测量的单元格中间点的 y 坐标。width:单元格的宽度。该值是unit(1/ncol(sub_mat), "npc"),其中通过行和列分割,sub_mat对应于子矩阵。height:单元格的高度。值是unit(1/nrow(sub_mat), "npc")。fill:单元格的颜色。
The values for the seven arguments are automatically sent to the function when executed in each cell.
在每个单元格中执行时,七个参数的值将自动发送到函数。
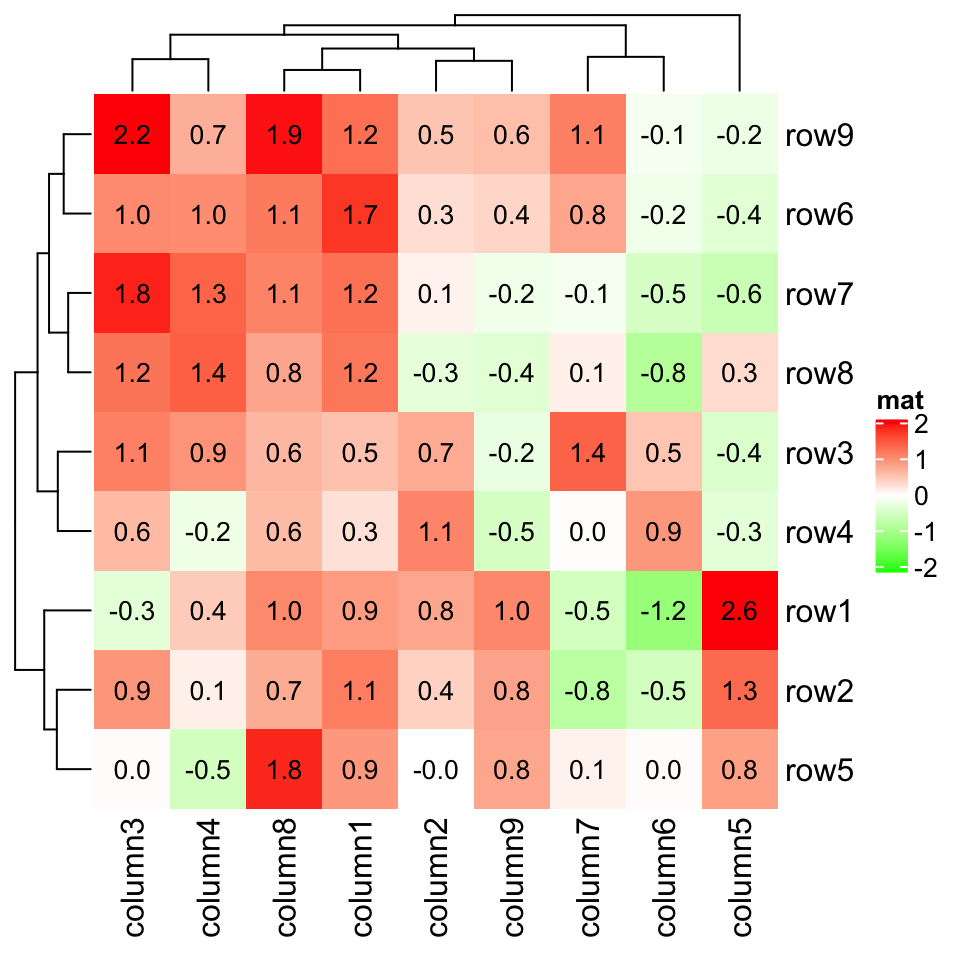
The most common use is to add values in the matrix onto the heatmap:
最常见的用法是将矩阵中的值添加到热图上:
small_mat = mat[1:9, 1:9]col_fun = colorRamp2(c(-2, 0, 2), c("green", "white", "red"))Heatmap(small_mat, name = "mat", col = col_fun,cell_fun = function(j, i, x, y, width, height, fill) {grid.text(sprintf("%.1f", small_mat[i, j]), x, y, gp = gpar(fontsize = 10))})
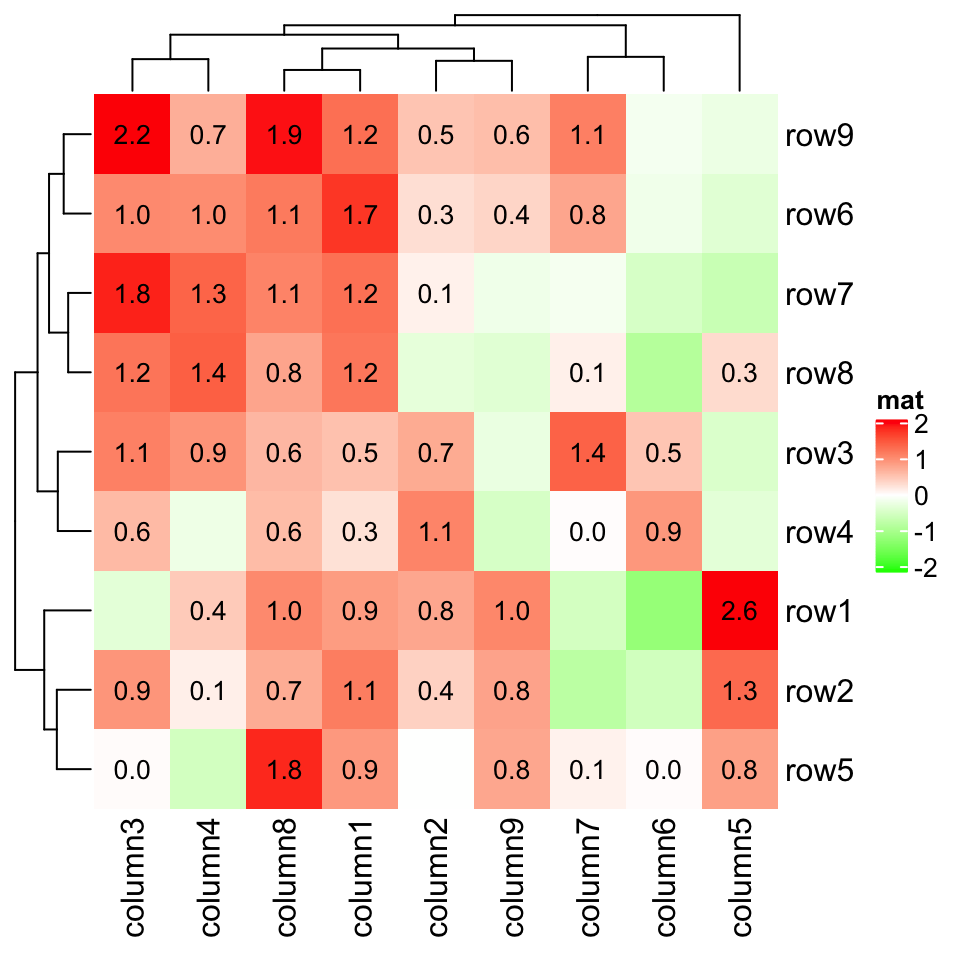
and we can also choose only to add text for the cells with positive values:
我们也可以选择仅为具有正值的单元格添加文本:
Heatmap(small_mat, name = "mat", col = col_fun,cell_fun = function(j, i, x, y, width, height, fill) {if(small_mat[i, j] > 0)grid.text(sprintf("%.1f", small_mat[i, j]), x, y, gp = gpar(fontsize = 10))})
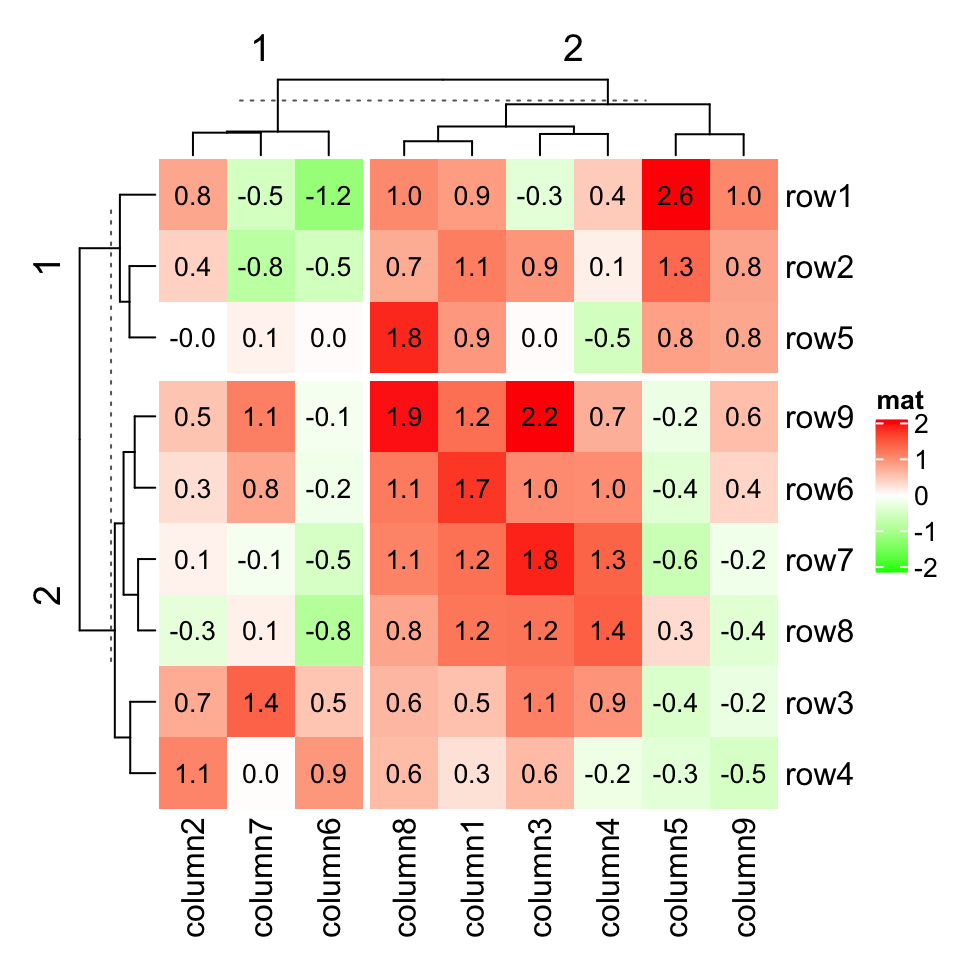
You can split the heatmap without doing anything extra to
cell_fun:
您可以拆分热图而无需对 cell_fun 执行任何额外操作:
Heatmap(small_mat, name = "mat", col = col_fun,row_km = 2, column_km = 2,cell_fun = function(j, i, x, y, width, height, fill) {grid.text(sprintf("%.1f", small_mat[i, j]), x, y, gp = gpar(fontsize = 10))})
In following example, we make a heatmap which shows correlation matrix similar as the corrplot package:
在下面的示例中,我们制作一个热图,显示与 corrplot 包类似的相关矩阵:
cor_mat = cor(small_mat)od = hclust(dist(cor_mat))$ordercor_mat = cor_mat[od, od]nm = rownames(cor_mat)col_fun = circlize::colorRamp2(c(-1, 0, 1), c("green", "white", "red"))# `col = col_fun` here is used to generate the legendHeatmap(cor_mat, name = "correlation", col = col_fun, rect_gp = gpar(type = "none"),cell_fun = function(j, i, x, y, width, height, fill) {grid.rect(x = x, y = y, width = width, height = height,gp = gpar(col = "grey", fill = NA))if(i == j) {grid.text(nm[i], x = x, y = y)} else if(i > j) {grid.circle(x = x, y = y, r = abs(cor_mat[i, j])/2 * min(unit.c(width, height)),gp = gpar(fill = col_fun(cor_mat[i, j]), col = NA))} else {grid.text(sprintf("%.1f", cor_mat[i, j]), x, y, gp = gpar(fontsize = 10))}}, cluster_rows = FALSE, cluster_columns = FALSE,show_row_names = FALSE, show_column_names = FALSE)
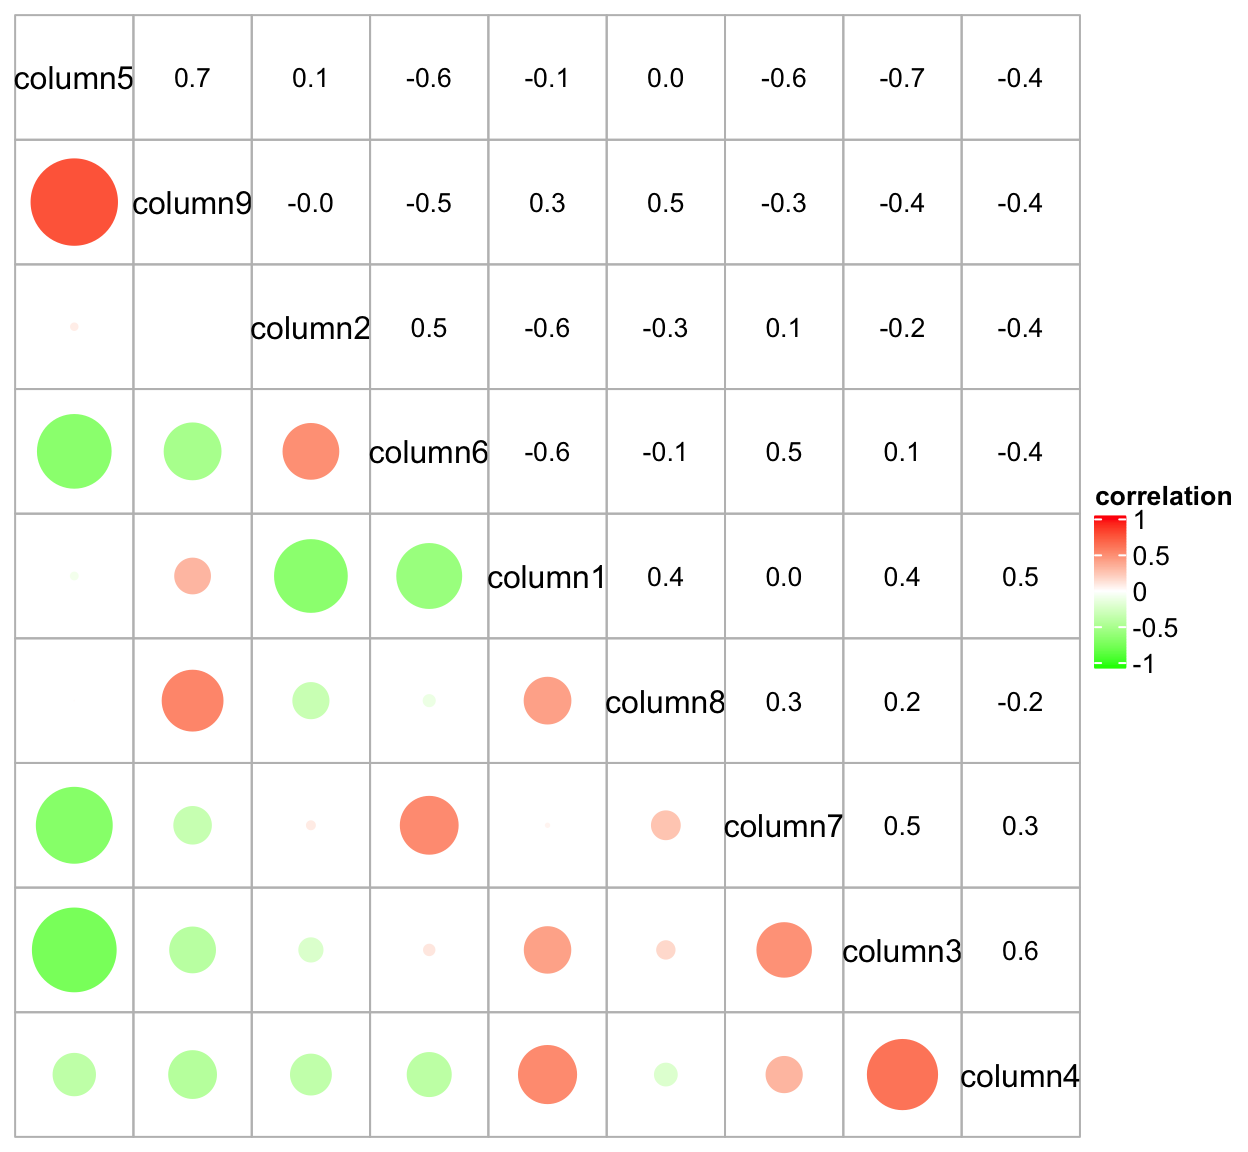
As you may see in previous plot, when setting the non-standard parameter
rect_gp = gpar(type = "none"), the clustering is performed but nothing is drawn on the heatmap body.
正如您在上一个图中看到的那样,当设置非标准参数 rect_gp = gpar(type = "none") 时,会执行聚类,但热图体上不会绘制任何内容。
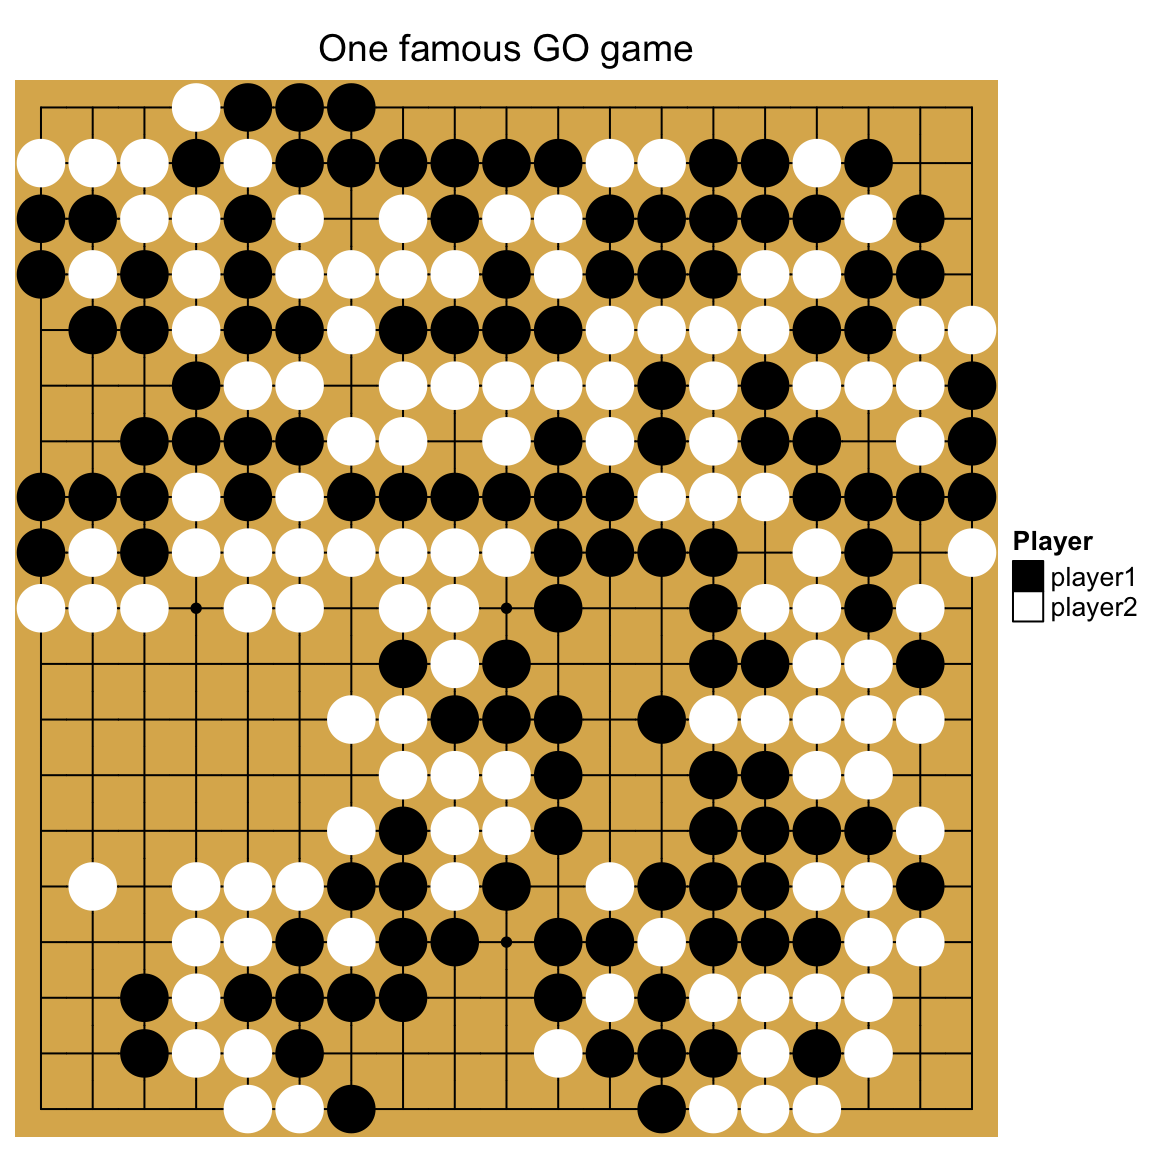
One last example is to visualize a GO game. The input data takes records of moves in the game.
最后一个例子是可视化一个 GO 游戏。输入数据记录游戏中的移动记录。
str = "B[cp];W[pq];B[dc];W[qd];B[eq];W[od];B[de];W[jc];B[qk];W[qn]
;B[qh];W[ck];B[ci];W[cn];B[hc];W[je];B[jq];W[df];B[ee];W[cf]
;B[ei];W[bc];B[ce];W[be];B[bd];W[cd];B[bf];W[ad];B[bg];W[cc]
;B[eb];W[db];B[ec];W[lq];B[nq];W[jp];B[iq];W[kq];B[pp];W[op]
;B[po];W[oq];B[rp];W[ql];B[oo];W[no];B[pl];W[pm];B[np];W[qq]
;B[om];W[ol];B[pk];W[qp];B[on];W[rm];B[mo];W[nr];B[rl];W[rk]
;B[qm];W[dp];B[dq];W[ql];B[or];W[mp];B[nn];W[mq];B[qm];W[bp]
;B[co];W[ql];B[no];W[pr];B[qm];W[dd];B[pn];W[ed];B[bo];W[eg]
;B[ef];W[dg];B[ge];W[gh];B[gf];W[gg];B[ek];W[ig];B[fd];W[en]
;B[bn];W[ip];B[dm];W[ff];B[cb];W[fe];B[hp];W[ho];B[hq];W[el]
;B[dl];W[fk];B[ej];W[fp];B[go];W[hn];B[fo];W[em];B[dn];W[eo]
;B[gp];W[ib];B[gc];W[pg];B[qg];W[ng];B[qc];W[re];B[pf];W[of]
;B[rc];W[ob];B[ph];W[qo];B[rn];W[mi];B[og];W[oe];B[qe];W[rd]
;B[rf];W[pd];B[gm];W[gl];B[fm];W[fl];B[lj];W[mj];B[lk];W[ro]
;B[hl];W[hk];B[ik];W[dk];B[bi];W[di];B[dj];W[dh];B[hj];W[gj]
;B[li];W[lh];B[kh];W[lg];B[jn];W[do];B[cl];W[ij];B[gk];W[bl]
;B[cm];W[hk];B[jk];W[lo];B[hi];W[hm];B[gk];W[bm];B[cn];W[hk]
;B[il];W[cq];B[bq];W[ii];B[sm];W[jo];B[kn];W[fq];B[ep];W[cj]
;B[bk];W[er];B[cr];W[gr];B[gk];W[fj];B[ko];W[kp];B[hr];W[jr]
;B[nh];W[mh];B[mk];W[bb];B[da];W[jh];B[ic];W[id];B[hb];W[jb]
;B[oj];W[fn];B[fs];W[fr];B[gs];W[es];B[hs];W[gn];B[kr];W[is]
;B[dr];W[fi];B[bj];W[hd];B[gd];W[ln];B[lm];W[oi];B[oh];W[ni]
;B[pi];W[ki];B[kj];W[ji];B[so];W[rq];B[if];W[jf];B[hh];W[hf]
;B[he];W[ie];B[hg];W[ba];B[ca];W[sp];B[im];W[sn];B[rm];W[pe]
;B[qf];W[if];B[hk];W[nj];B[nk];W[lr];B[mn];W[af];B[ag];W[ch]
;B[bh];W[lp];B[ia];W[ja];B[ha];W[sf];B[sg];W[se];B[eh];W[fh]
;B[in];W[ih];B[ae];W[so];B[af]"
We convert it into a matrix:
我们把它转换成矩阵:
str = gsub("\\n", "", str)
step = strsplit(str, ";")[[1]]
type = gsub("(B|W).*", "\\1", step)
row = gsub("(B|W)\\[(.).\\]", "\\2", step)
column = gsub("(B|W)\\[.(.)\\]", "\\2", step)
go_mat = matrix(nrow = 19, ncol = 19)
rownames(go_mat) = letters[1:19]
colnames(go_mat) = letters[1:19]
for(i in seq_along(row)) {
    go_mat[row[i], column[i]] = type[i]
}
go_mat[1:4, 1:4]
##   a   b   c   d
## a NA  NA  NA  "W"
## b "W" "W" "W" "B"
## c "B" "B" "W" "W"
## d "B" "W" "B" "W"
Black and white stones are put based on the values in the matrix:
根据矩阵中的值放置黑色和白色宝石:
Heatmap(go_mat, name = "go", rect_gp = gpar(type = "none"),
    cell_fun = function(j, i, x, y, w, h, col) {
        grid.rect(x, y, w, h, gp = gpar(fill = "#dcb35c", col = NA))
        if(i == 1) {
            grid.segments(x, y-h*0.5, x, y)
        } else if(i == nrow(go_mat)) {
            grid.segments(x, y, x, y+h*0.5)
        } else {
            grid.segments(x, y-h*0.5, x, y+h*0.5)
        }
        if(j == 1) {
            grid.segments(x, y, x+w*0.5, y)
        } else if(j == ncol(go_mat)) {
            grid.segments(x-w*0.5, y, x, y)
        } else {
            grid.segments(x-w*0.5, y, x+w*0.5, y)
        }
        if(i %in% c(4, 10, 16) & j %in% c(4, 10, 16)) {
            grid.points(x, y, pch = 16, size = unit(2, "mm"))
        }

        r = min(unit.c(w, h))*0.45
        if(is.na(go_mat[i, j])) {
        } else if(go_mat[i, j] == "W") {
            grid.circle(x, y, r, gp = gpar(fill = "white", col = "white"))
        } else if(go_mat[i, j] == "B") {
            grid.circle(x, y, r, gp = gpar(fill = "black", col = "black"))
        }
    },
    col = c("B" = "black", "W" = "white"),
    show_row_names = FALSE, show_column_names = FALSE,
    column_title = "One famous GO game",
    heatmap_legend_param = list(title = "Player", at = c("B", "W"),
        labels = c("player1", "player2"), border = "black")
)
2.9.2 layer_fun
cell_funadds graphics cell by cell, whilelayer_funadds graphics in a block-wise manner. Similar ascell_fun,layer_funalso needs seven arguments, but they are all in vector form (layer_funcan also have a eighth and ninth arguments which is introduced later this section):
cell_fun 是逐个单元地添加图形,而 layer_fun 以逐块方式添加图形。与 cell_fun 类似, layer_fun 也需要七个参数,但它们都是矢量形式( layer_fun 也可以有第八个和第九个参数,这将在本节后面介绍):
# code only for demonstration
Heatmap(..., layer_fun = function(j, i, x, y, w, h, fill) {...})
# on you can capitalize the arguments to mark they are vectors
Heatmap(..., layer_fun = function(J, I, X, Y, W, H, F) {...})
jandistill contain the column and row indices corresponding to the original matrix, but since nowlayer_funapplies to a block of cells (or a block of heatmap if the heatmap is split),jandiare vectors for all the cells in the current heatmap slice. Similarlly,x,y,w,handfillare all vectors corresponding to all cells in the current heatmap slice.
j 和 i 仍然包含对应于原始矩阵的列和行索引,但是现在 layer_fun 适用于单元格块(如果热图被分割,则应用于热图的块), j 和 i 是当前热图切片中所有单元格的向量。类似地, x , y , w , h 和 fill 是对应于当前热图切片中的所有单元的所有向量。
Since
jandinow are vectors, to get corresponding values in the matrix, we cannot use the form asmat[j, i]because it gives you a sub-matrix withlength(i)rows andlength(j)columns. Instead we can usepindex()function from ComplexHeatmap which is like pairwise indexing for a matrix. See follow example:
由于 j 和 i 现在是向量,为了在矩阵中得到相应的值,我们不能将该形式用作 mat[j, i] ,因为它给出了一个长度为 length(i) 行和长度 length(j) 列的子矩阵。相反,我们可以使用 ComplexHeatmap 中的 pindex() 函数,就像矩阵的成对索引一样。见以下示例:
mfoo = matrix(1:9, nr = 3)
mfoo[1:2, c(1, 3)]
##      [,1] [,2]
## [1,]    1    7
## [2,]    2    8
# but we actually want mfoo[1, 1] and mfoo[2, 3]
pindex(mfoo, 1:2, c(1, 3))
## [1] 1 8
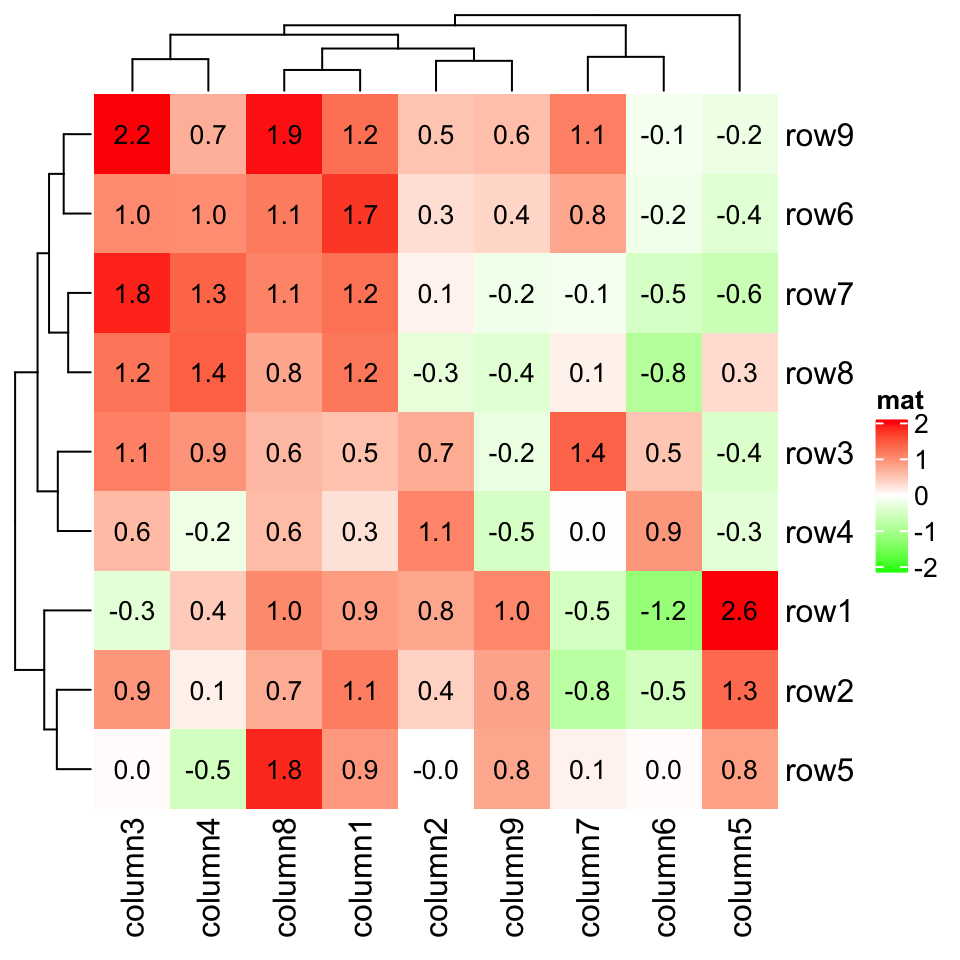
Next example shows the
layer_funversion of adding text on heatmap. It’s basically the same as thecell_funversion.
下一个示例显示了在 heatmap 上添加文本的 layer_fun 版本。它与 cell_fun 版本基本相同。
col_fun = colorRamp2(c(-2, 0, 2), c("green", "white", "red"))
Heatmap(small_mat, name = "mat", col = col_fun,
    layer_fun = function(j, i, x, y, width, height, fill) {
        # since grid.text can also be vectorized
        grid.text(sprintf("%.1f", pindex(small_mat, i, j)), x, y, gp = gpar(fontsize = 10))
})
——本章节完. 2019.07.08——
