作者:Zuguang Gu8
编译:Steven Shen
原文:Chapter 2 A Single Heatmap
A single heatmap is the most used approach for visualizing the data. Although “the shining point” of the ComplexHeatmap package is it can visualize a list of heatmaps in parallel, as the basic unit of the heatmap list, it is still very important to have the single heatmap nicely configured.
单个热图是用于可视化数据的最常用方法。虽然 ComplexHeatmap 包的 “the shining point” 是可以并行显示热图列表,但作为热图列表的基本单元,配置单个热图仍然非常重要。
First let’s generate a random matrix where there are three groups by columns and three groups by rows:
首先让我们生成一个随机矩阵,其中按列分为三组,按行分为三组:
set.seed(123)nr1 = 4; nr2 = 8; nr3 = 6; nr = nr1 + nr2 + nr3nc1 = 6; nc2 = 8; nc3 = 10; nc = nc1 + nc2 + nc3mat = cbind(rbind(matrix(rnorm(nr1*nc1, mean = 1, sd = 0.5), nr = nr1),matrix(rnorm(nr2*nc1, mean = 0, sd = 0.5), nr = nr2),matrix(rnorm(nr3*nc1, mean = 0, sd = 0.5), nr = nr3)),rbind(matrix(rnorm(nr1*nc2, mean = 0, sd = 0.5), nr = nr1),matrix(rnorm(nr2*nc2, mean = 1, sd = 0.5), nr = nr2),matrix(rnorm(nr3*nc2, mean = 0, sd = 0.5), nr = nr3)),rbind(matrix(rnorm(nr1*nc3, mean = 0.5, sd = 0.5), nr = nr1),matrix(rnorm(nr2*nc3, mean = 0.5, sd = 0.5), nr = nr2),matrix(rnorm(nr3*nc3, mean = 1, sd = 0.5), nr = nr3)))mat = mat[sample(nr, nr), sample(nc, nc)] # random shuffle rows and columnsrownames(mat) = paste0("row", seq_len(nr))colnames(mat) = paste0("column", seq_len(nc))
> head(mat)column1 column2 column3 column4 column5 column6row1 0.8517620 0.75823530 -0.32552445 0.4490584 2.6205200 -1.15458444row2 1.1183375 0.38998256 0.90882972 0.1391978 1.2814948 -0.53589561row3 0.5235772 0.72207943 1.08419194 0.9248215 -0.4248522 0.48699778row4 0.2550648 1.05534136 0.58403269 -0.1976372 -0.3203530 0.89101254row5 0.8783874 -0.01427338 0.02729558 -0.5261114 0.8127096 0.02650211row6 1.6892851 0.27419848 1.00556459 0.9855792 -0.3615330 -0.17377130column7 column8 column9 column10 column11 column12row1 -0.50928769 1.0123366 1.0326465 1.04236865 0.60599022 0.85980233row2 -0.77437640 0.7057150 0.7915712 0.46833693 0.14237891 2.05005447row3 1.35067795 0.6105097 -0.2452787 0.72227543 0.44318005 0.25970360row4 0.01669142 0.5670193 -0.4737373 -0.03565404 0.81537706 -0.02778098row5 0.10797078 1.7857291 0.7581097 0.56724357 -0.02625664 1.38452112row6 0.76630531 1.1432122 0.3537942 -0.65850807 0.10485938 0.12184371column13 column14 column15 column16 column17 column18row1 1.2715970 0.2140750 -0.14753574 0.66695147 1.1249573 -0.09421702row2 1.3003544 0.8120937 -0.31251963 0.01299521 1.0726316 0.23854381row3 0.9545518 0.7140834 1.77935416 0.69301328 1.2992544 0.92250650row4 0.3699738 0.5372756 0.88491126 0.86824798 0.5452483 0.54460361row5 0.4072600 0.5280084 0.07668656 -0.49637424 0.5333504 0.81648036row6 -0.6799204 1.1136460 -0.35460038 -0.32157448 1.4126899 1.42286577column19 column20 column21 column22 column23 column24row1 1.3439584 -0.2333277 0.7708173 -0.19023550 0.83041015 1.9986067row2 1.3508922 -0.3473535 0.9829664 0.44756283 0.44716433 1.3770269row3 -0.2876735 1.6120409 0.1176933 1.23045810 0.43342452 -1.0266236row4 0.4594983 0.7771690 -0.3259750 1.85753249 1.27379053 -0.2112484row5 0.2426662 1.0844780 0.4520019 0.34432013 0.95569565 0.8376570row6 -0.2381234 0.1658910 -0.5077963 -0.06944568 -0.07882317 -0.2510994
Following command contains the minimal argument for the
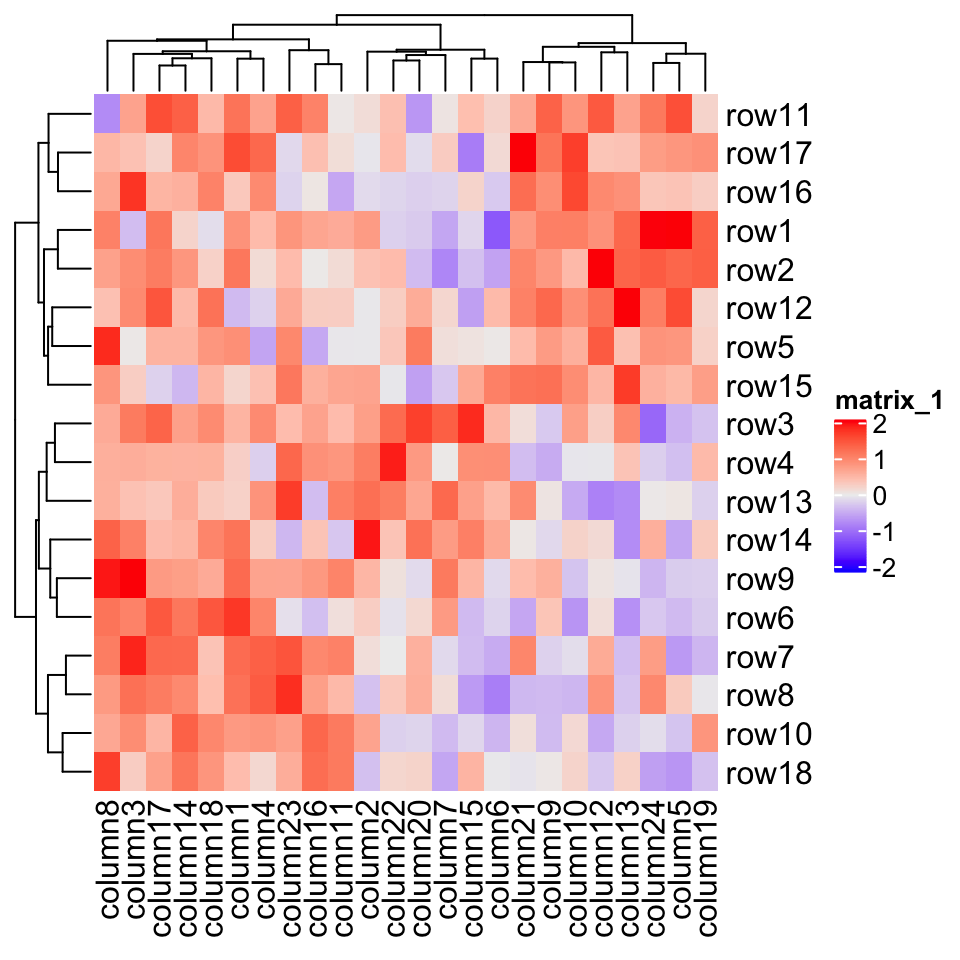
Heatmap()function which just visualizes the matrix as a heatmap with default settings. Very similar as other heatmap tools, it draws the dendrograms, the row/column names and the heatmap legend. The default color schema is “blue-white-red” which is mapped to the minimal-mean-maximal values in the matrix. The title for the legend is assigned with an internal index number.
接下来下面的命令包含了 Heatmap() 函数的最小参数,该参数仅将矩阵可视化为具有默认设置的热图。与其他热图工具非常相似,它绘制树形图,行/列名称和热图图例。默认颜色架构是映射到的 “蓝白红”。
Heatmap(mat)

The title for the legend is taken from the “name” of the heatmap by default. Each heatmap has a name which is like a unique identifier for the heatmap and it is important when you have a list of heatmaps. In later chapters, you will find the heatmap name is used for setting the “main heatmap” and is used for decoration of heatmaps. If the name is not assigned, an internal name is assigned to the heatmap in a form of
matrix_%d. In following examples in this chapter, we give the namematto the heatmap (for which you will see the change of the legend in the next plot).
默认情况下,图例的标题取自热图的 “名称”。每个热图都有一个名称,就像热图的唯一标识符一样,当你有一个热图列表时,这个名称很重要。在后面的章节中,您会发现热图名称用于设置 “主热图(main heatmap)” 并用于装饰热图。如果未指定名称,则以 matrix_%d 的形式为热图分配内部名称。在本章的以下示例中,我们将名称 mat 赋予热图(您将在下一个图中看到图例的更改)。
If you put
Heatmap()inside a function or afor/if/whilechunk, you won’t see the heatmap after executingHeatmap(). In this case, you need to usedraw()function explicitly as follows. We will explain this point in more detail in Section 2.11.
如果您将 Heatmap() 放在函数或 for / if / while 块中,则在执行 Heatmap() 后将看不到热图。在这种情况下,您需要显式使用 draw() 函数,如下所示。我们将在 2.11 节中更详细地解释这一点。
ht = Heatmap(mat)draw(ht)
—— 本章节完 ——

