作者:Zuguang Gu8
编译:Steven Shen
原文:2.1 Colors
For heatmap visualization, colors are the major representation of the data matrix. In most cases, the heatmap visualizes a matrix with continuous numeric values. In this case, users should provide a color mapping function. A color mapping function should accept a vector of values and return a vector of corresponding colors. Users should always use
circlize::colorRamp2()function to generate the color mapping function with usingHeatmap(). The two arguments forcolorRamp2()is a vector of break values and a vector of corresponding colors.colorRamp2()linearly interpolates colors in every interval through LAB color space. Also usingcolorRamp2()helps to generate a legend with proper tick marks.
对于热图可视化,颜色是数据矩阵的主要表现方式。在大多数情况下,热图可以可视化一个具有连续数值的矩阵。在这种情况下,用户应当提供颜色映射的函数。该颜色映射函数应该接受一个向量值并返回相应颜色的向量。用户应该始终使用 circlize::colorRamp2() 函数来产生提供给 Heatmap() 使用的颜色映射。colorRamp2() 的两个参数中,一个是中断值的向量,另外一个是相应颜色的向量。 colorRamp2() 通过 LAB 颜色空间在每个间隔中线性插值(以获得颜色不同的颜色)。 同样的,使用 colorRamp2() 有助于生成带有正确刻度标记的图例。
In following example, values between -2 and 2 are linearly interpolated to get corresponding colors, values larger than 2 are all mapped to red and values less than -2 are all mapped to green.
在下面的示例中,-2 和 2 之间的值进行线性插值以获得相应的颜色,大于 2 的值全部映射为红色,小于 -2 的值全部映射为绿色。
library(circlize)col_fun = colorRamp2(c(-2, 0, 2), c("green", "white", "red"))col_fun(seq(-3, 3))## [1] "#00FF00FF" "#00FF00FF" "#B1FF9AFF" "#FFFFFFFF" "#FF9E81FF" "#FF0000FF"## [7] "#FF0000FF"
Heatmap(mat, name = "mat", col = col_fun)
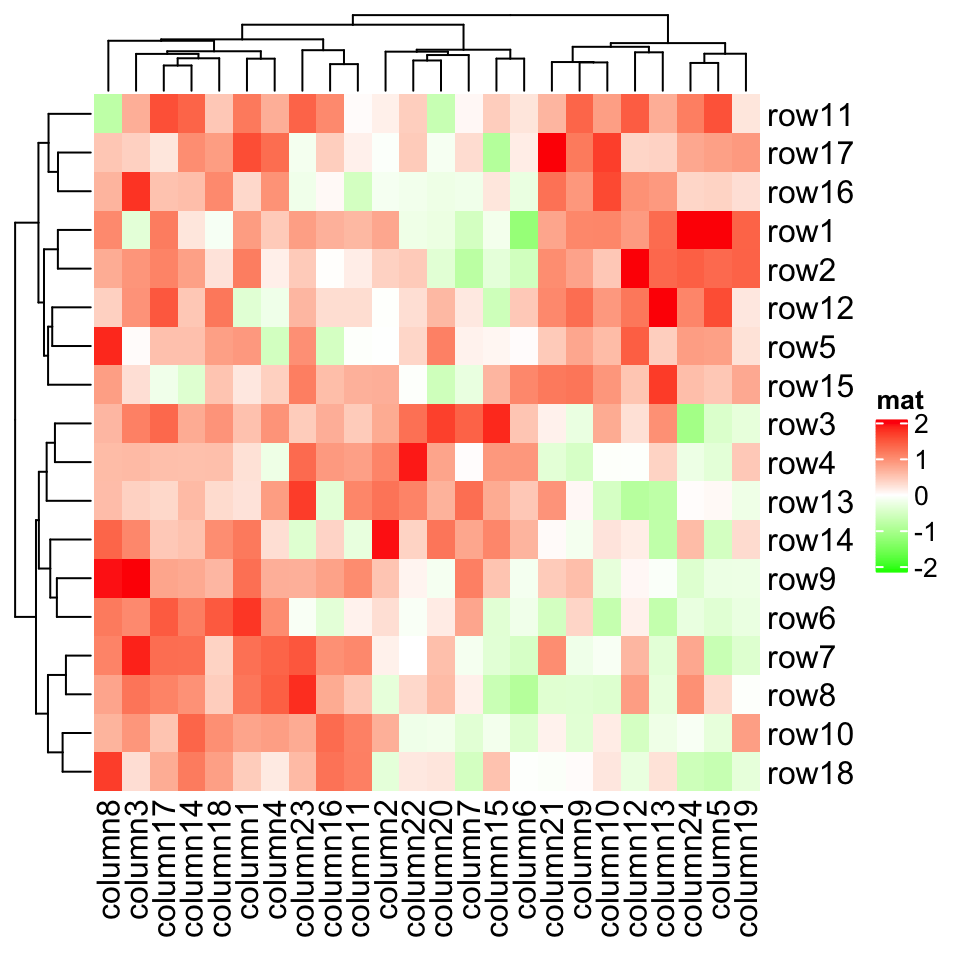
As you can see, the color mapping function exactly maps negative values to green and positive values to red, even when the distribution of negative values and positive values are not centric to zero. Also this color mapping function is not affected by outliers. In following plot, the clustering is heavily affected by the outlier but not the color mapping.
正如您所看到的,即使负值和正值的分布不是中心到零,颜色映射函数也会将负值精确地映射到绿色和将正值映射到红色。此颜色映射功能也不受异常值的影响。在下图中,聚类受到异常值的严重影响,但不受颜色映射的影响。
mat2 = matmat2[1, 1] = 100000Heatmap(mat2, name = "mat", col = col_fun)
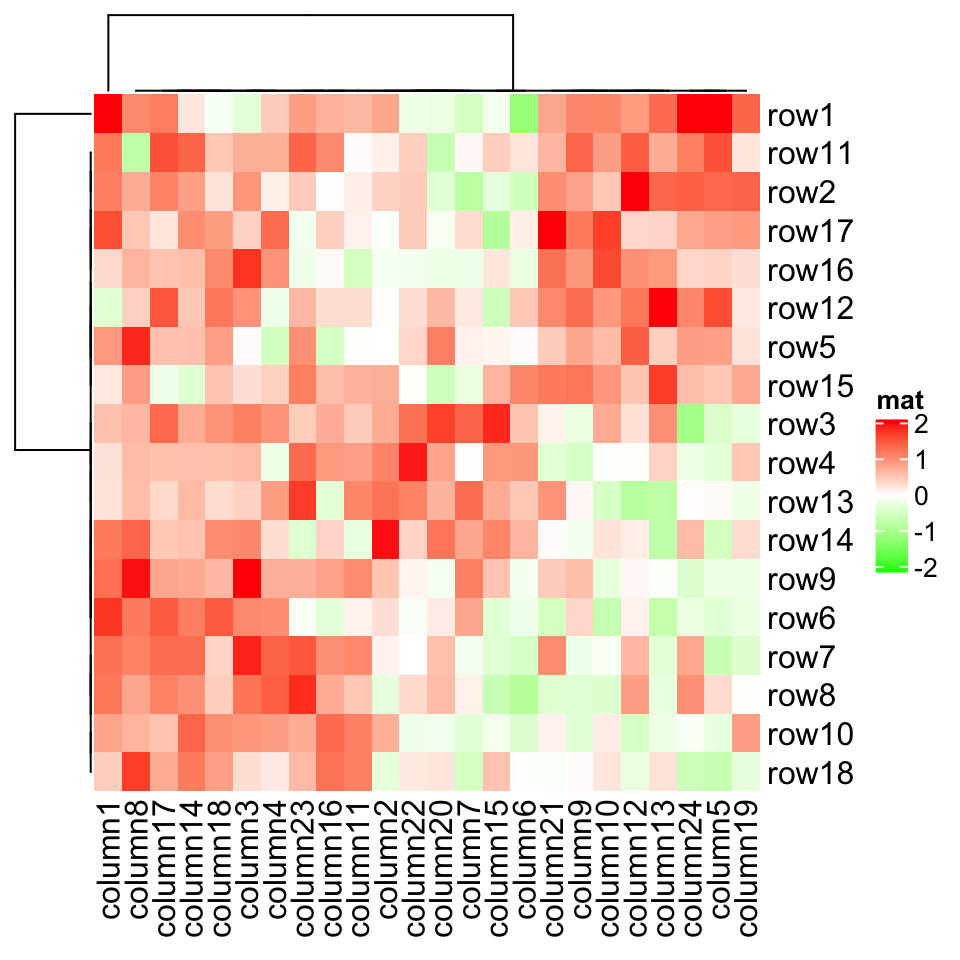
More importantly,
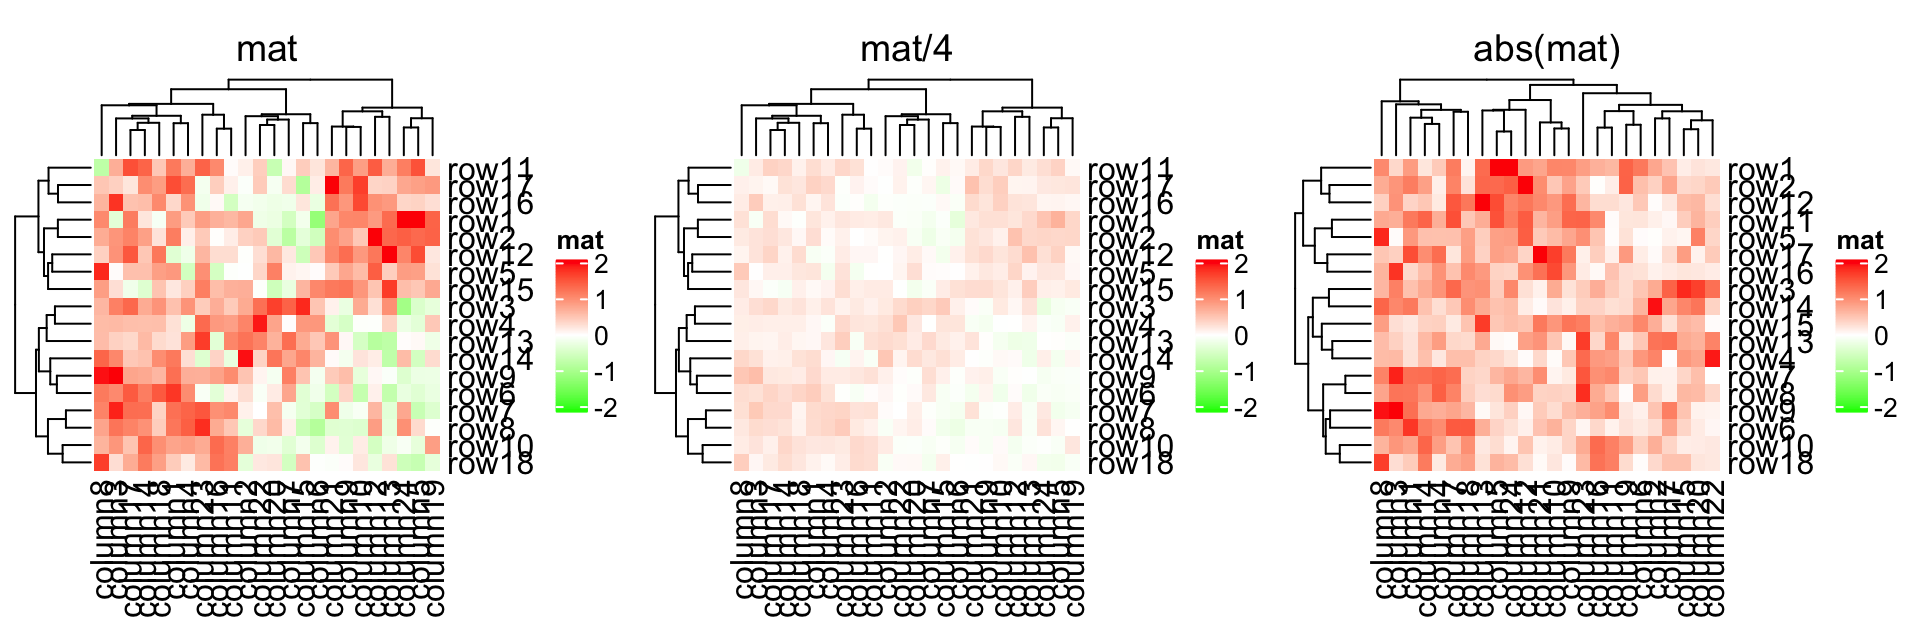
colorRamp2()makes colors in multiple heatmaps comparible if they are set with a same color mapping function. In following three heatmaps, a same color always corresponds to a same value.
更重要的是,如果使用相同的颜色映射函数设置 colorRamp2() ,则多个热图中的颜色可以比较。在以下三个热图中,相同的颜色始终对应于相同的值。
Heatmap(mat, name = "mat", col = col_fun, column_title = "mat")Heatmap(mat/4, name = "mat", col = col_fun, column_title = "mat/4")Heatmap(abs(mat), name = "mat", col = col_fun, column_title = "abs(mat)")
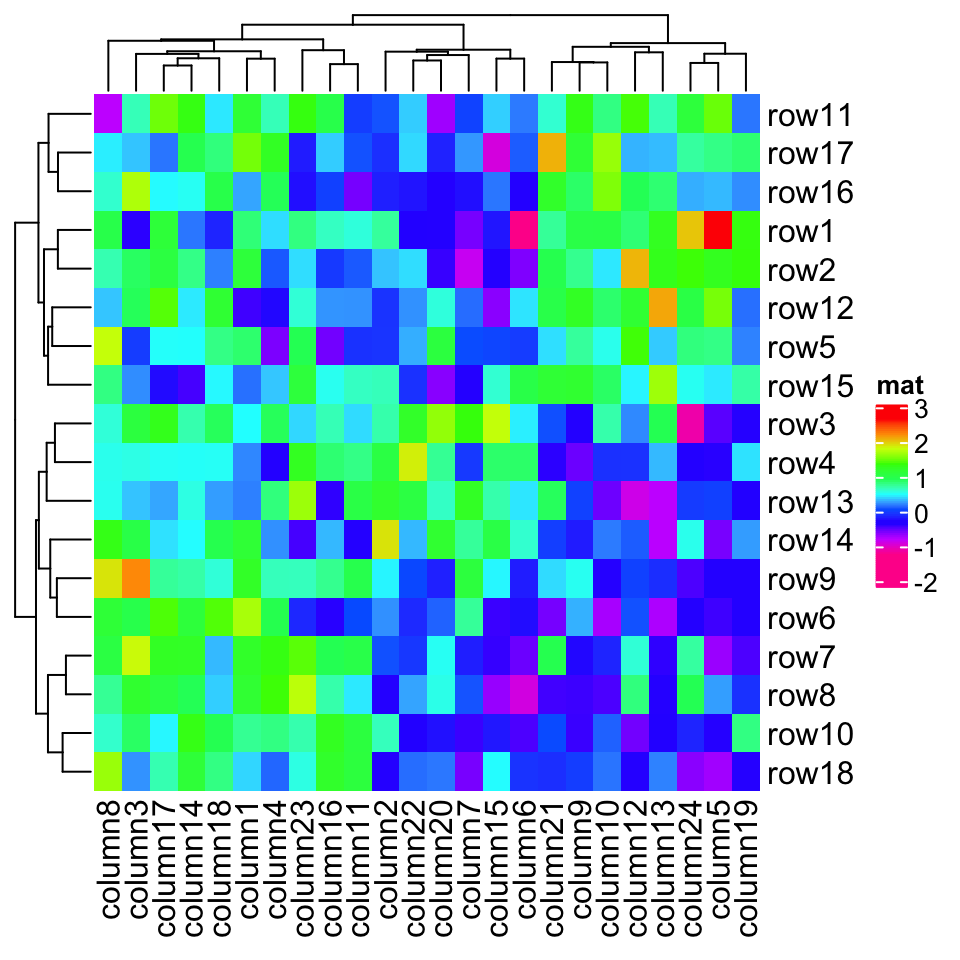
If the matrix is continuous, you can also simply provide a vector of colors and colors will be linearly interpolated. But remember this method is not robust to outliers because the mapping starts from the minimal value in the matrix and ends with the maximal value. Following color mapping setting is identical to
colorRamp2(seq(min(mat), max(mat), length = 10), rev(rainbow(10))).
如果矩阵是连续的,您还可以简单地提供颜色矢量,并且颜色将被线性插值。但请记住,此方法对异常值不稳健,因为映射从矩阵中的最小值开始,以最大值结束。以下颜色映射设置与 colorRamp2(seq(min(mat), max(mat), length = 10), rev(rainbow(10))) 相同。
Heatmap(mat, name = "mat", col = rev(rainbow(10)))
If the matrix contains discrete values (either numeric or character), colors should be specified as a named vector to make it possible for the mapping from discrete values to colors. If there is no name for the color, the order of colors corresponds to the order of
unique(mat). Note now the legend is generated from the color mapping vector.
如果矩阵包含离散值(数字或字符),则应将颜色指定为命名向量,以使从离散值到颜色的映射成为可能。如果颜色没有名称,则颜色的顺序对应于 unique(mat) 的顺序。 请注意,图例是从颜色映射矢量生成的。
Following sets colors for a discrete numeric matrix (you don’t need to convert it to a character matrix).
以下为离散数值矩阵设置颜色(您不需要将其转换为字符矩阵)。
discrete_mat = matrix(sample(1:4, 100, replace = TRUE), 10, 10)colors = structure(1:4, names = c("1", "2", "3", "4")) # black, red, green, blueHeatmap(discrete_mat, name = "mat", col = colors)
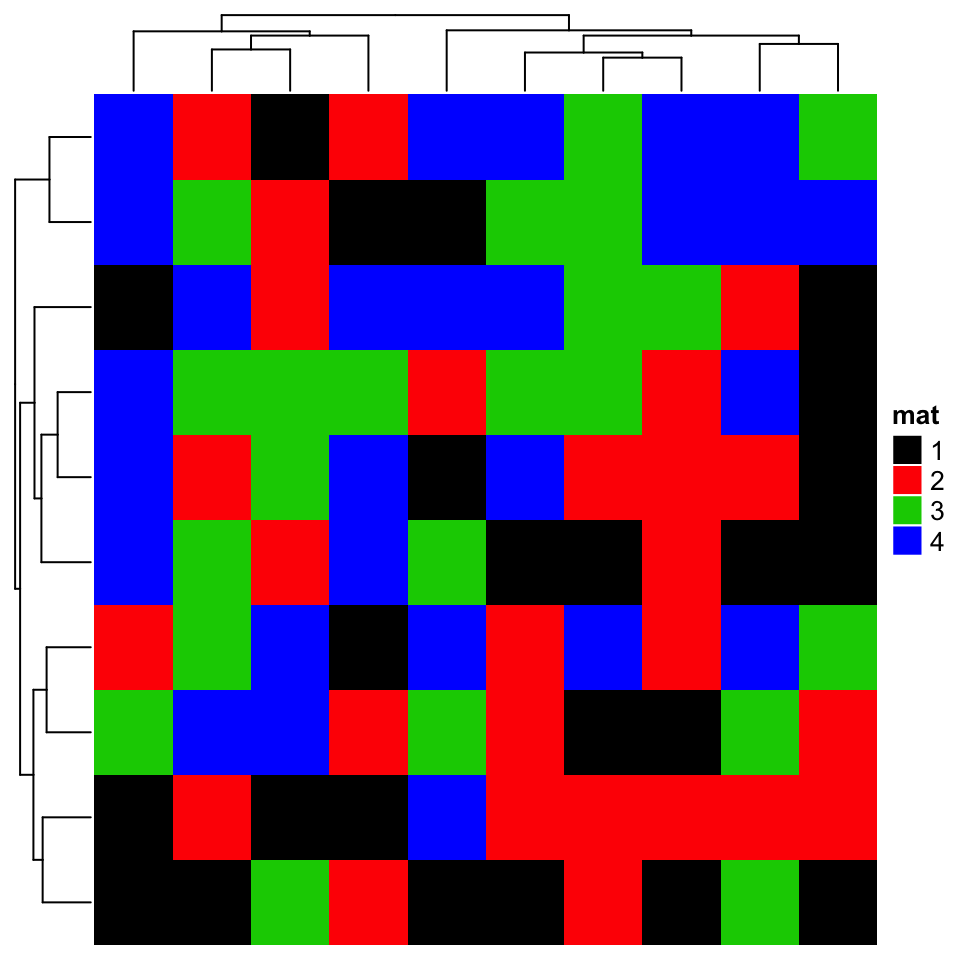
Or a character matrix:
或者是为一个字符矩阵设置颜色:
discrete_mat = matrix(sample(letters[1:4], 100, replace = TRUE), 10, 10)colors = structure(1:4, names = letters[1:4])Heatmap(discrete_mat, name = "mat", col = colors)
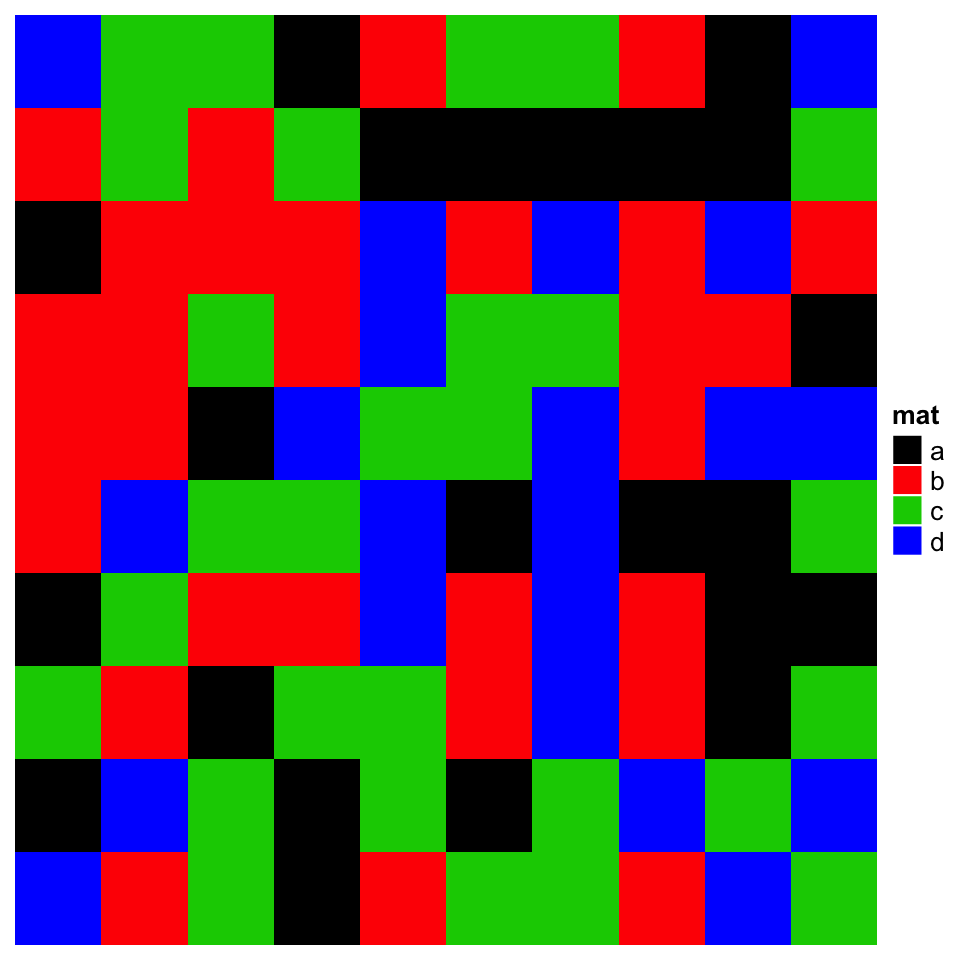
As you see in the two examples above, for the numeric matrix (no matter the color is continuous mapping or discrete mapping), by default clustering is applied on both dimensions while for character matrix, clustering is turned off (but you can still cluster a character matrix if you provide a proper distance metric for two character vectors, see example in Section 2.3.1).
正如您在上面的两个示例中所看到的,对于数值矩阵(无论颜色是连续映射还是离散映射),默认情况下,聚类应用于两个维度,而对于字符矩阵,聚类关闭(但您仍然可以聚类字符矩阵,如果您为两个字符向量提供适当的距离尺度,请参见第 2.3.1 节中的示例。)
NAis allowed in the matrix. You can control the color ofNAbyna_colargument (by default it is grey forNA). The matrix that containsNAcan be clustered byHeatmap().
NA 在矩阵中是允许的。您可以通过 na_col 参数控制 NA 的颜色(默认情况下, NA 为灰色)。包含 NA 的矩阵可以通过 Heatmap() 进行聚类。
**
Note the
NAvalue is not presented in the legend.
请注意,图例中是没有显示 NA 值的。
mat_with_na = matna_index = sample(c(TRUE, FALSE), nrow(mat)*ncol(mat), replace = TRUE, prob = c(1, 9))mat_with_na[na_index] = NAHeatmap(mat_with_na, name = "mat", na_col = "black")
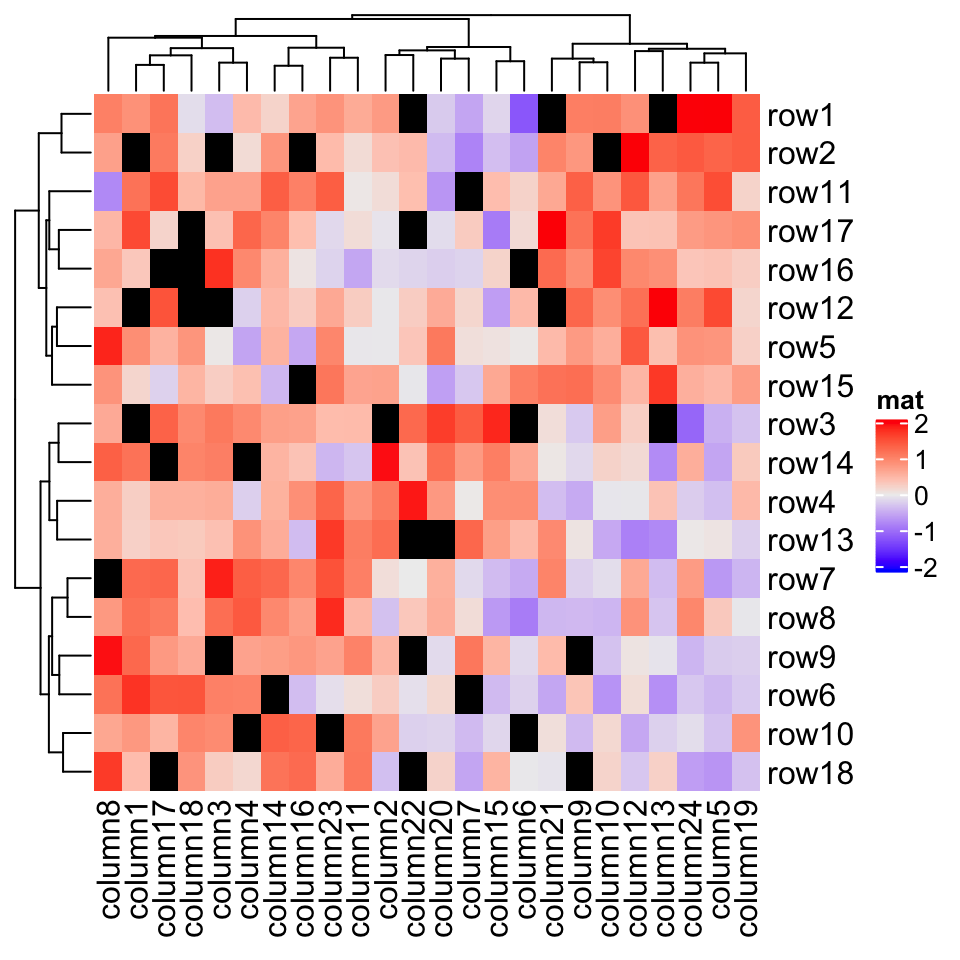
Color space is important for interpolating colors. By default, colors are linearly interpolated in LAB color space, but you can select the color space in
colorRamp2()function. Compare following two plots. Can you see the difference?
色彩空间对于插值颜色很重要。默认情况下,颜色会在 LAB 颜色空间中进行线性插值,但您可以在 colorRamp2() 函数中选择颜色空间。比较以下两个图。 你能看到区别么?
f1 = colorRamp2(seq(min(mat), max(mat), length = 3), c("blue", "#EEEEEE", "red"))f2 = colorRamp2(seq(min(mat), max(mat), length = 3), c("blue", "#EEEEEE", "red"), space = "RGB")Heatmap(mat, name = "mat1", col = f1, column_title = "LAB color space")Heatmap(mat, name = "mat2", col = f2, column_title = "RGB color space")
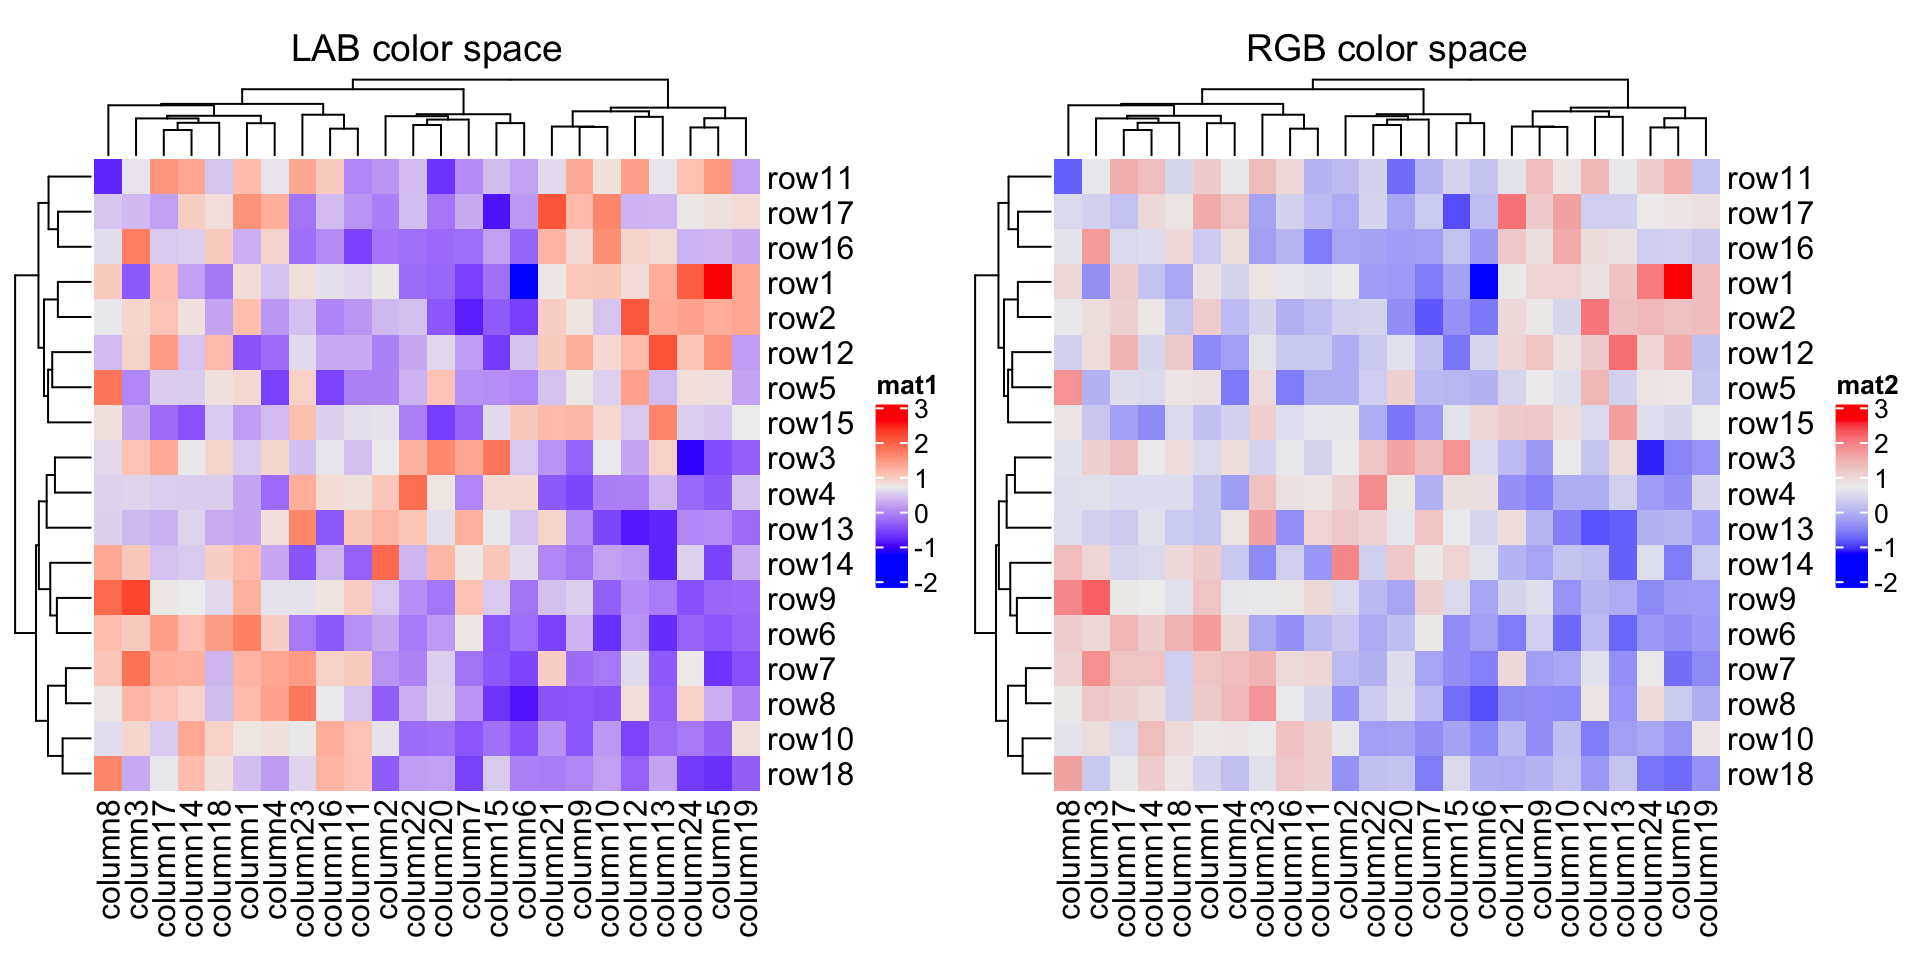
In following plots, corresponding values change evenly on the folded lines, you can see how colors change under different color spaces (top plots: green-black-red, bottom plots: blue-white-red. The plot is made by HilbertCurve package).
在下面的图中,相应的值在折叠线上均匀变化,您可以看到颜色在不同颜色空间下的变化情况(上图:绿 - 黑 - 红,底图:蓝 - 白 - 红。图由 HilbertCurve 包制作)。

Last but not the least, colors for the heatmap borders can be set by the
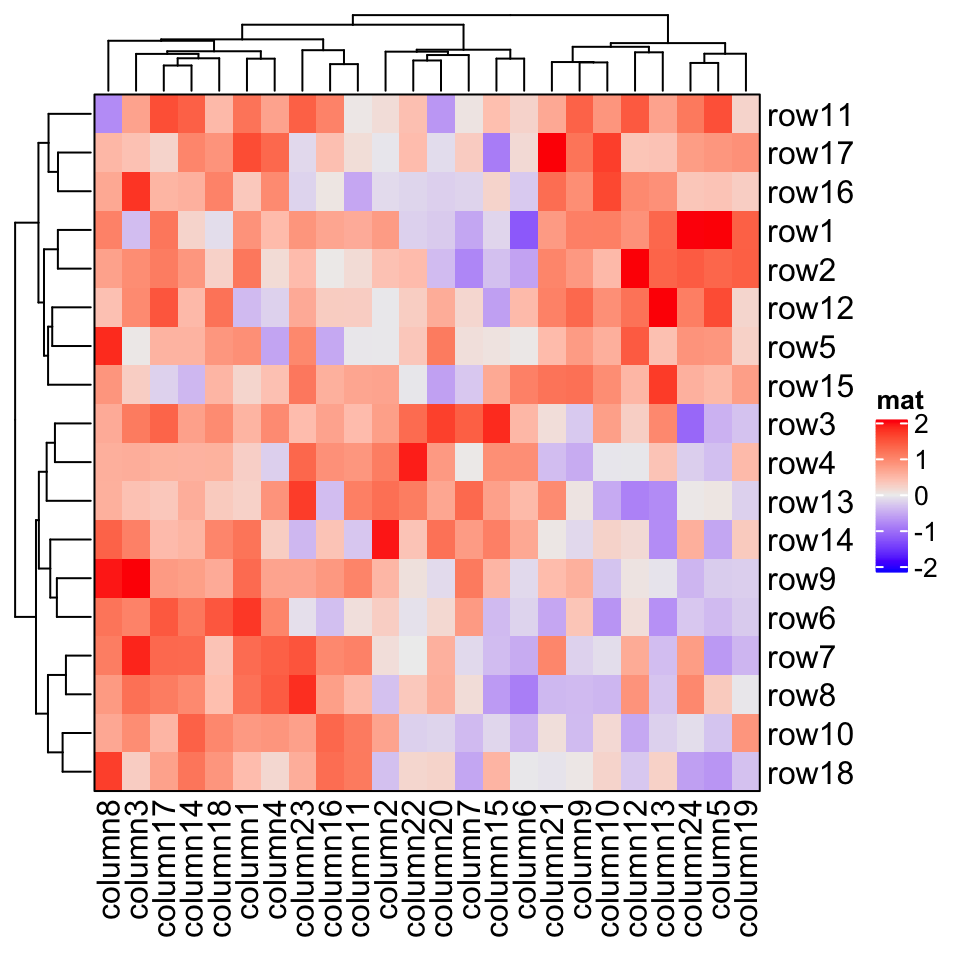
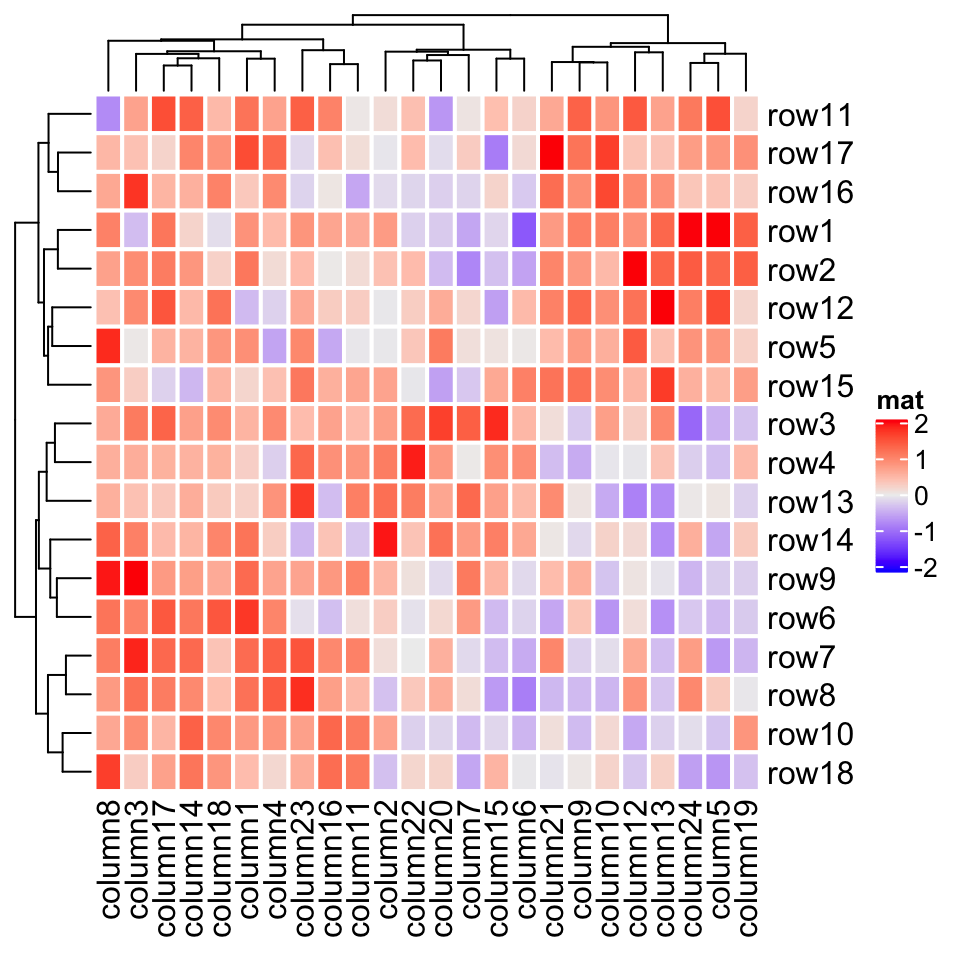
borderandrect_gparguments.bordercontrols the global border of the heatmap body andrect_gpcontrols the border of the grids in the heatmap.
最后也是重要的是,热图边框的颜色可以通过 border 和 rect_gp 参数设置。 border 控制热图主体的全局边框, rect_gp 控制热图中网格的边框。
The value of
bordercan be logical (TRUEcorresponds toblack) or a character of color (e.g.red).
border 的值可以是逻辑的( TRUE 对应于黑色)或颜色的字符(例如红色)。
rect_gpis agparobject which means you can only set it bygrid::gpar(). Since the filled color is already controlled by the heatmap color mapping, you can only set thecolparameter ingpar()to control the border of the heatmap grids.
rect_gp 是一个 gpar 对象,这意味着你只能通过 grid::gpar() 来设置它。由于填充颜色已由热图颜色映射控制,因此您只能在 gpar() 中设置 col 参数以控制热图网格的边框。
Heatmap(mat, name = "mat", border = TRUE)
Heatmap(mat, name = "mat", rect_gp = gpar(col = "white", lwd = 2))
If
colis not set, the default color mapping byHeatmap()is designed with trying to be as convinient and meaningful as possible. Following are the rules for the default color mapping (byComplexHeatmap:::default_col()):
如果未设置 col ,则 Heatmap() 的默认颜色映射旨在尽可能方便和有意义。以下是默认颜色映射的规则(通过 ComplexHeatmap:::default_col() ):
- If the values are characters, the colors are generated by
circlize::rand_color();- If the values are from the heatmap annotation and are numeric, colors are mapped between white and one random color by linearly interpolating to the mininum and maxinum.
- If the values are from the matrix (let’s denote it as MM) which corresponds to the heatmap body:
- If the fraction of positive values in MM is between 25% and 75%, colors are mapped to blue, white and red by linearly interpolating to −q−q, 0 and qq, where qq is the maximum of |M||M| if the number of unique values is less than 100, or qq is the 99^th percentile of |M||M|. This color mapping is centric to zero.
- Or else the colors are mapped to blue, white and red by linearly interpolating to q1q1, (q1+q2)/2(q1+q2)/2 and q2q2, where q1q1 and q2q2 are mininum and maxinum if the number of unique values is MM is less than 100, or q1q1 is the 1^th percentile and q2q2 is the 99^th percentile in MM.
- 如果值是字符,则通过
circlize::rand_color()生成颜色; - 如果值来自热图注释并且是数字,则通过从最小值和最大值之间的线性插值,将颜色映射到白色和一种随机颜色之间。
- 如果值来自矩阵(我们将其表示为 MM),它对应于热图主体:
- 如果 MM 中正值的分数在 25% 和 75% 之间,则通过线性插值到 -q-q,0 和 qq 将颜色映射到蓝色,白色和红色,其中 qq 是 |M||M| 的最大值。如果唯一值的数量小于 100,或 qq 是 |M||M| 的第 99 百分位数。 此颜色的映射以零为中心。
- 或者通过线性内插到 q1q1,(q1+q2)/2(q1+q2)/2 和 q2q2 将颜色映射到蓝色,白色和红色,其中 q1q1 和 q2q2 是最小值和最大值,如果唯一值的数量是 MM 小于 100,或 q1q1 是第 1 百分位数,q2q2 是 MM 中的第 99 百分位数。
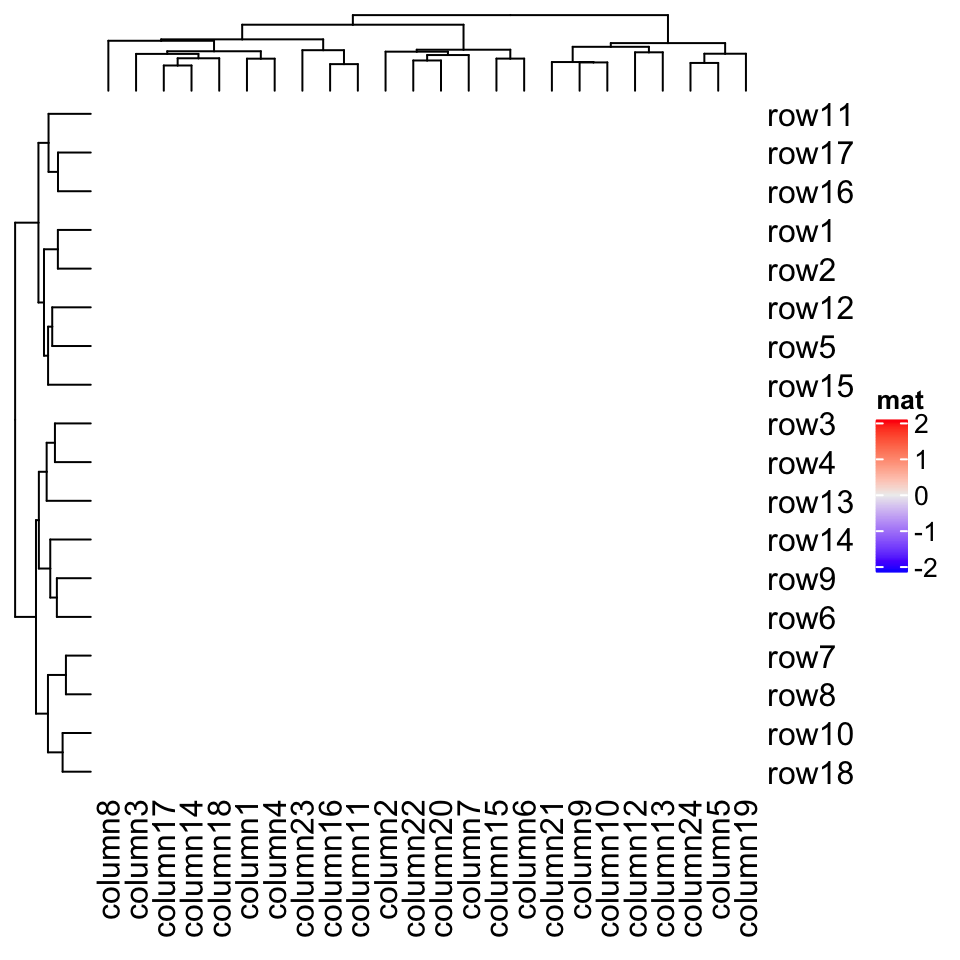
rect_gpallows a non-standard parametertype. If it is set to"none", the clustering is still applied but nothing in drawn on the heatmap body. The customized graphics on heatmap body can be added via a self-definedcell_funorlayer_fun(see Section 2.9).
rect_gp 允许非标准参数 type 。如果将其设置为 "none" ,则仍会应用聚类,但在热图主体上不会绘制任何内容。热图主体上的自定义图形可以通过自定义的 cell_fun 或 layer_fun 添加(参见第 2.9 节)。
Heatmap(mat, name = "mat", rect_gp = gpar(type = "none"))
—— 本章节完 ——

