作者:Zuguang Gu8
翻译:Steven Shen
原文:https://jokergoo.github.io/ComplexHeatmap-reference/book/oncoprint.html#input-data-format
There are two different formats of input data. The first is represented as a matrix in which each value can include multiple alterations in a form of a complicated string. In follow example, ‘g1’ in ‘s1’ has two types of alterations which are ‘snv’ and ‘indel’.
mat = read.table(textConnection("s1,s2,s3g1,snv;indel,snv,indelg2,,snv;indel,snvg3,snv,,indel;snv"), row.names = 1, header = TRUE, sep = ",", stringsAsFactors = FALSE)mat = as.matrix(mat)mat## s1 s2 s3## g1 "snv;indel" "snv" "indel"## g2 "" "snv;indel" "snv"## g3 "snv" "" "indel;snv"
In this case, we need to define a function to extract different alteration types from these long strings. The definition of such function is always simple, it accepts the complicated string and returns a vector of alteration types.
For
mat, we can define the function as:
get_type_fun = function(x) strsplit(x, ";")[[1]]get_type_fun(mat[1, 1])## [1] "snv" "indel"get_type_fun(mat[1, 2])## [1] "snv"
So, if the alterations are encoded as
snv|indel, you can define the function asfunction(x) strsplit(x, "|")[[1]]. This self-defined function is assigned to theget_typeargument inoncoPrint().Since in most cases, the separators are only single characters, If the separators are in
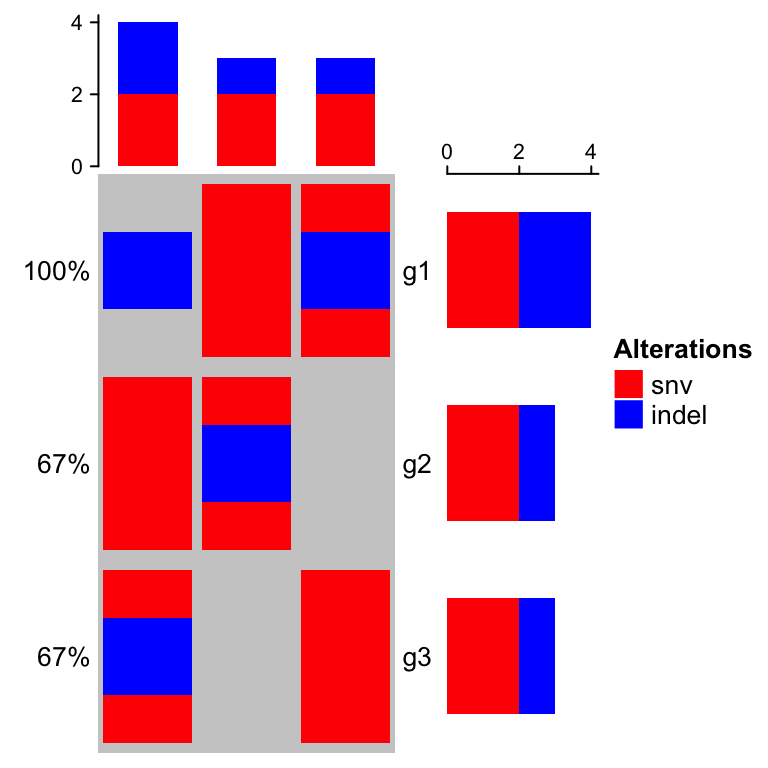
;:,|,oncoPrint()automatically spit the alteration strings so that you don’t need to explicitely specifyget_typeinoncoPrint()function. * For one gene in one sample, since different alteration types may be drawn into one same grid in the heatmap, we need to define how to add the graphics by providing a list of self-defined functions toalter_funargument. Here if the graphics have no transparency, order of adding graphics matters. In following example, snv are first drawn and then the indel. You can see rectangles for indels are actually smaller (`0.4h) than that for snvs (0.9*h) so that you can visualize both snvs and indels if they are in a same grid. Names of the function list should correspond to the alteration types (here,snvandindel`).For the self-defined graphic function (the functions in
alter_fun, there should be four arguments which are positions of the grids on the oncoPrint (xandy), and widths and heights of the grids (wandh, which is measured innpcunit). Proper values for the four arguments are sent to these functions automatically fromoncoPrint().Colors for different alterations are defined in
col. It should be a named vector for which names correspond to alteration types. It is used to generate the barplots and the legends.
col = c(snv = "red", indel = "blue")oncoPrint(mat,alter_fun = list(snv = function(x, y, w, h) grid.rect(x, y, w*0.9, h*0.9,gp = gpar(fill = col["snv"], col = NA)),indel = function(x, y, w, h) grid.rect(x, y, w*0.9, h*0.4,gp = gpar(fill = col["indel"], col = NA))), col = col)

You can see the order in barplots also correspond to the order defined in
alter_fun.If you are confused of how to generated the matrix, there is a second way. The second type of input data is a list of matrix for which each matrix contains binary value representing whether the alteration is absent or present. The list should have names which correspond to the alteration types.
mat_list = list(snv = matrix(c(1, 0, 1, 1, 1, 0, 0, 1, 1), nrow = 3),indel = matrix(c(1, 0, 0, 0, 1, 0, 1, 0, 0), nrow = 3))rownames(mat_list$snv) = rownames(mat_list$indel) = c("g1", "g2", "g3")colnames(mat_list$snv) = colnames(mat_list$indel) = c("s1", "s2", "s3")mat_list## $snv## s1 s2 s3## g1 1 1 0## g2 0 1 1## g3 1 0 1#### $indel## s1 s2 s3## g1 1 0 1## g2 0 1 0## g3 0 0 0
oncoPrint()expects all matrices inmat_listhaving same row names and column names.Pass
mat_listtooncoPrint():
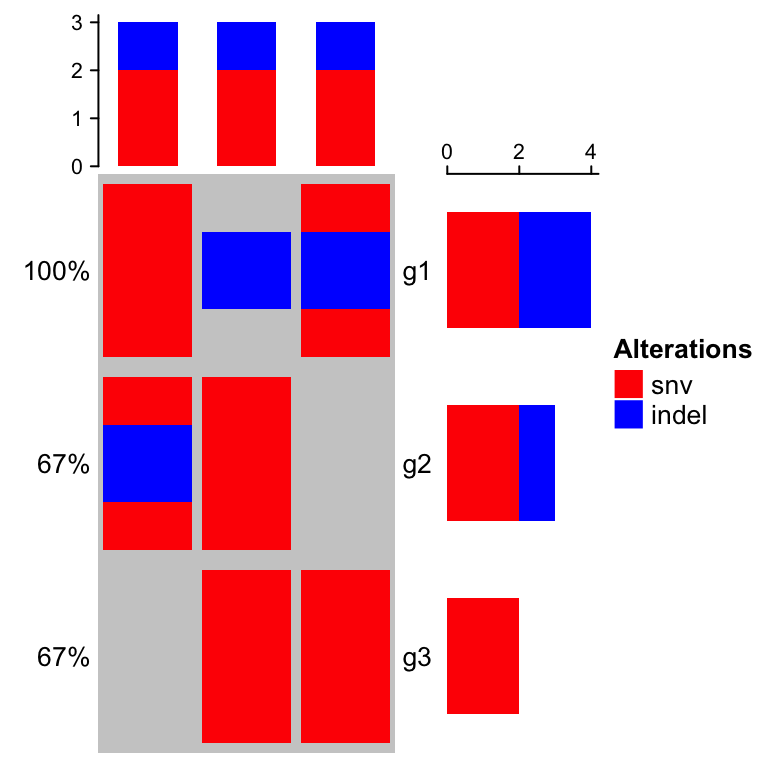
# now you don't need `get_type`oncoPrint(mat_list,alter_fun = list(snv = function(x, y, w, h) grid.rect(x, y, w*0.9, h*0.9,gp = gpar(fill = col["snv"], col = NA)),indel = function(x, y, w, h) grid.rect(x, y, w*0.9, h*0.4,gp = gpar(fill = col["indel"], col = NA))), col = col)

In following parts of this chapter, we still use the single matrix form mat to specify the input data.

