作者:Zuguang Gu8
翻译:Steven Shen
原文:https://jokergoo.github.io/ComplexHeatmap-reference/book/a-list-of-heatmaps.html
The main feature of ComplexHeatmap package is it supports to concatenate a list of heatmaps and annotations horizontally or vertically so that it makes it possible to visualize the associations from various sources of information. In this chapter, we mainly introduce the horizontal concatenation because this is the major case we will use in the analysis. In the end we show some examples of vertical concatenation. The concept behind for horizontal and vertical concatenation basically is similar.
For the horizontal concatenation, the number of rows for all heatmaps and annotations should be the same. In following we first introduce the concatenation of heatmaps and later we will show how to concatenate heatmaps with annotations.
In following example, there are three matrices where the third heatmap is a vector and it will be transformed as a one-column matrix. The one-column heatmap is sometimes useful when you concatenate a list of heatmaps that it can show e.g. annotations for each row or some scores of each row. E.g. if rows are genes, the type of the genes (i.e. protein coding or not) can be represented as a one-column character matrix, and the p-value or the fold change from differential expression analysis can be represented as a one-column numeric matrix, and be concatenated to the main expression heatmap.
set.seed(123)mat1 = matrix(rnorm(80, 2), 8, 10)mat1 = rbind(mat1, matrix(rnorm(40, -2), 4, 10))rownames(mat1) = paste0("R", 1:12)colnames(mat1) = paste0("C", 1:10)mat2 = matrix(runif(60, max = 3, min = 1), 6, 10)mat2 = rbind(mat2, matrix(runif(60, max = 2, min = 0), 6, 10))rownames(mat2) = paste0("R", 1:12)colnames(mat2) = paste0("C", 1:10)le = sample(letters[1:3], 12, replace = TRUE)names(le) = paste0("R", 1:12)ind = sample(12, 12)mat1 = mat1[ind, ]mat2 = mat2[ind, ]le = le[ind]
To concatenate heatmaps, simply use
+operator.
ht1 = Heatmap(mat1, name = "rnorm")ht2 = Heatmap(mat2, name = "runif")ht3 = Heatmap(le, name = "letters")ht1 + ht2 + ht3
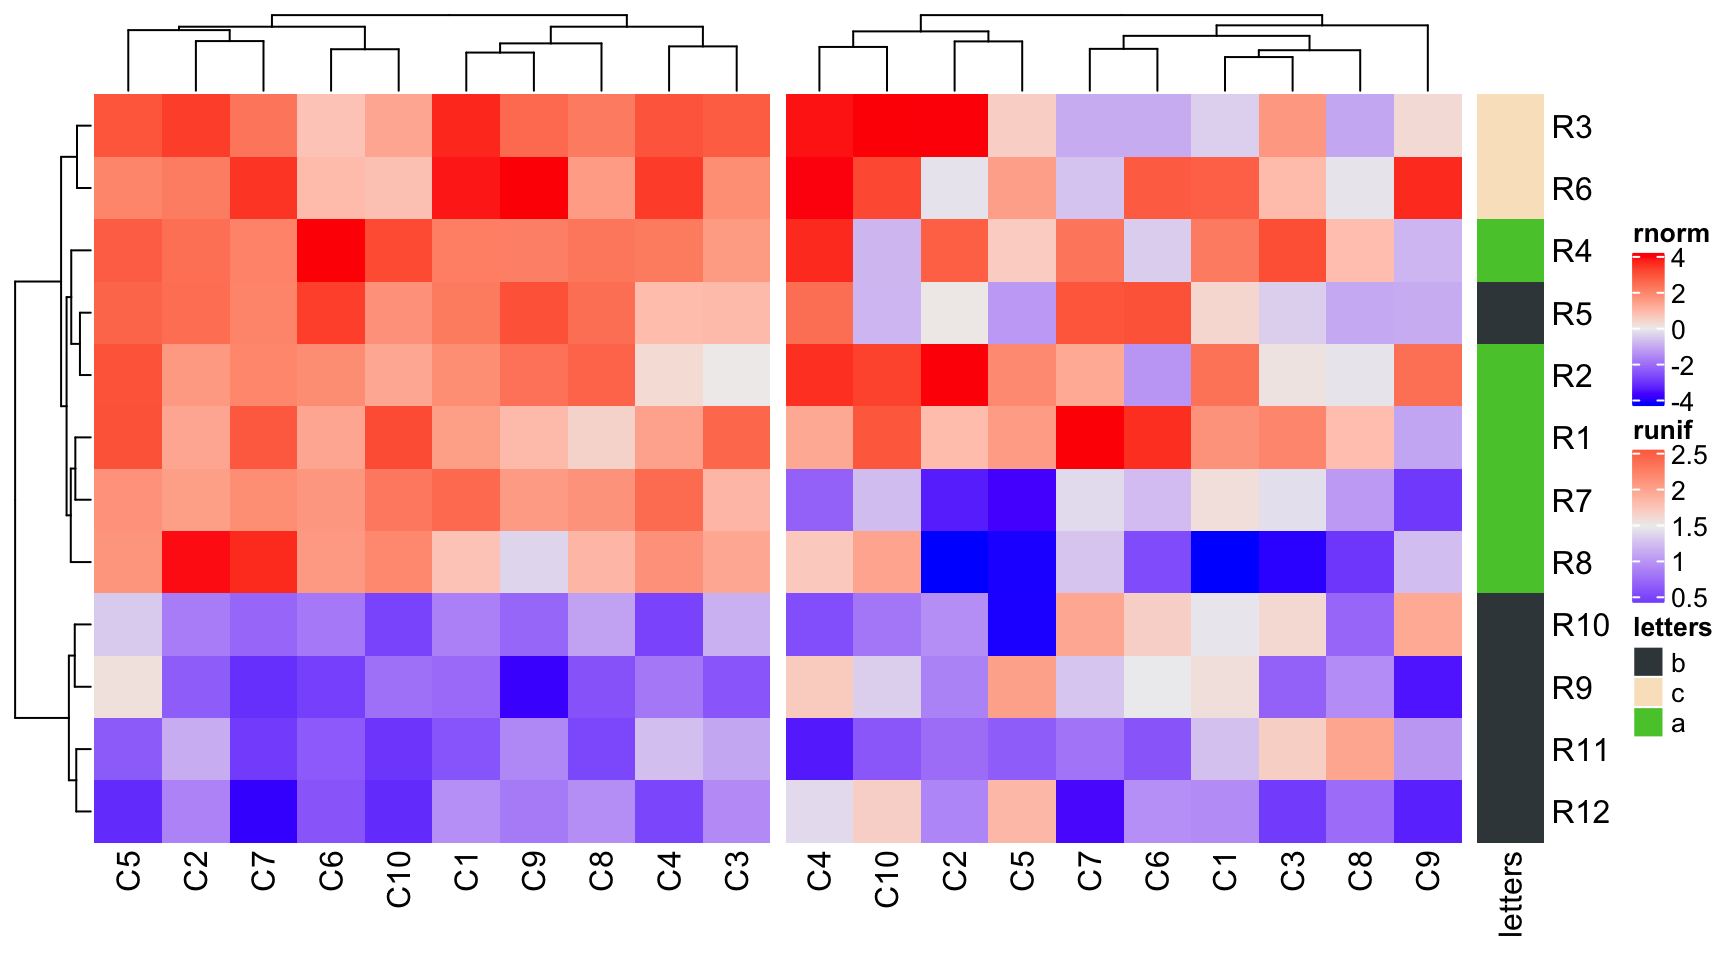
Under default mode, dendrograms from the second heatmap will be removed and row orders will be the same as the first one. Also row names for the first two heatmaps are removed as well.
The returned value of the concatenation is a
HeatmapListobject. Similar as explained in Section 2.11, directly printinght_listwill calldraw()method with default settings. With explicitly callingdraw()method, you can have more controls on the heatmap list.
ht_list = ht1 + ht2 + ht3class(ht_list)## [1] "HeatmapList"## attr(,"package")## [1] "ComplexHeatmap"
You can append any number of heatmaps to the heatmap list. Also you can append a heatmap list to a heatmap list.
# code only for demonstrationht1 + ht_listht_list + ht1ht_list + ht_list
NULLcan be added to the heatmap list. It would be convinient when users want to construct a heatmap list through aforloop.
# code only for demonstrationht_list = NULL ## Heatmap(...) + NULL gives you a HeatmapList objectfor(s in sth) {ht_list = ht_list + Heatmap(...)}
You can also add heatmap annotations to the heatmap list, see more details in Section 4.7.

若有收获,就点个赞吧
0 人点赞
