作者:Zuguang Gu
翻译:Steven Shen
原文:https://jokergoo.github.io/ComplexHeatmap-reference/book/a-single-heatmap.html#heatmap-split
One major advantage of ComplexHeatmap package is it supports splitting the heatmap by rows and columns to better group the features and additionally highlight the patterns.
ComplexHeatmap 包的一个主要优点是它支持按行和列拆分热图,以便更好地对功能进行分组,并突出显示模式。
Following arguments control the splitting: row_km, row_split, column_km, column_split. In following, we call the sub-clusters generated by splitting “slices”.
以下参数控制拆分: row_km , row_split , column_km , column_split 。在下文中,我们把通过拆分生成的sub-clusters 为 “slices” 。
2.7.1 按 k-means 聚类拆分
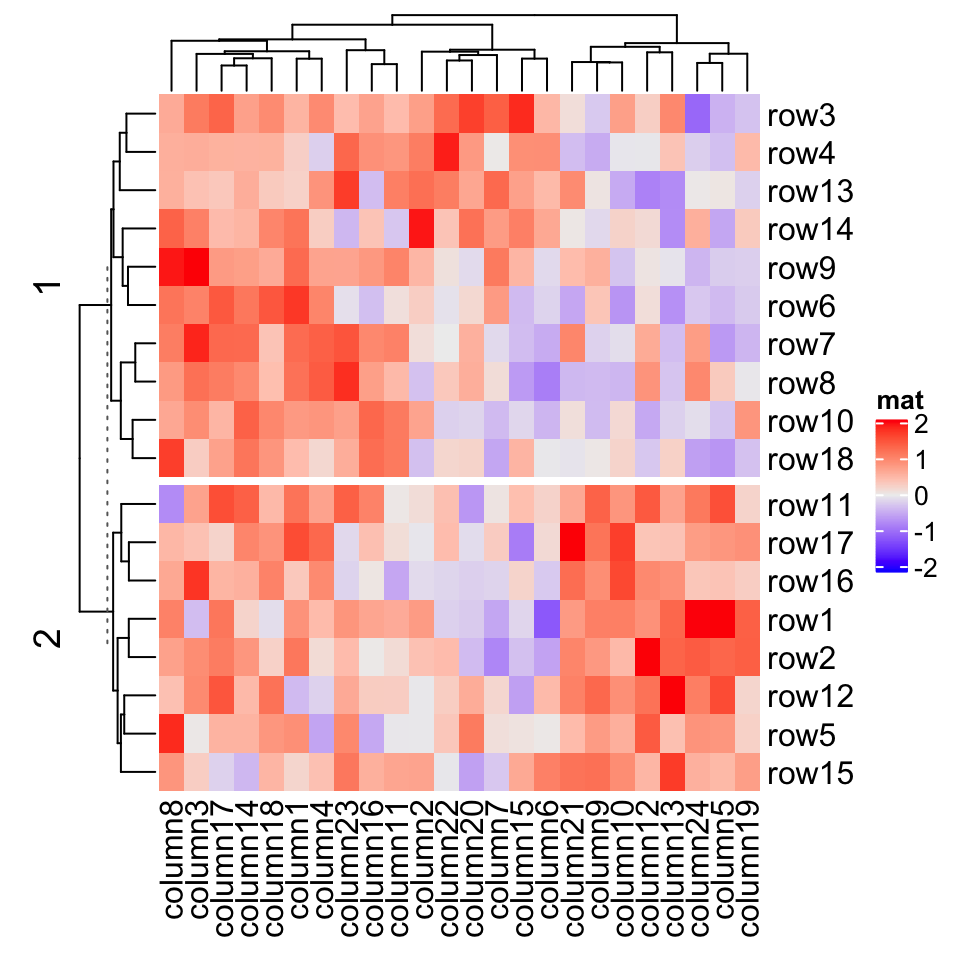
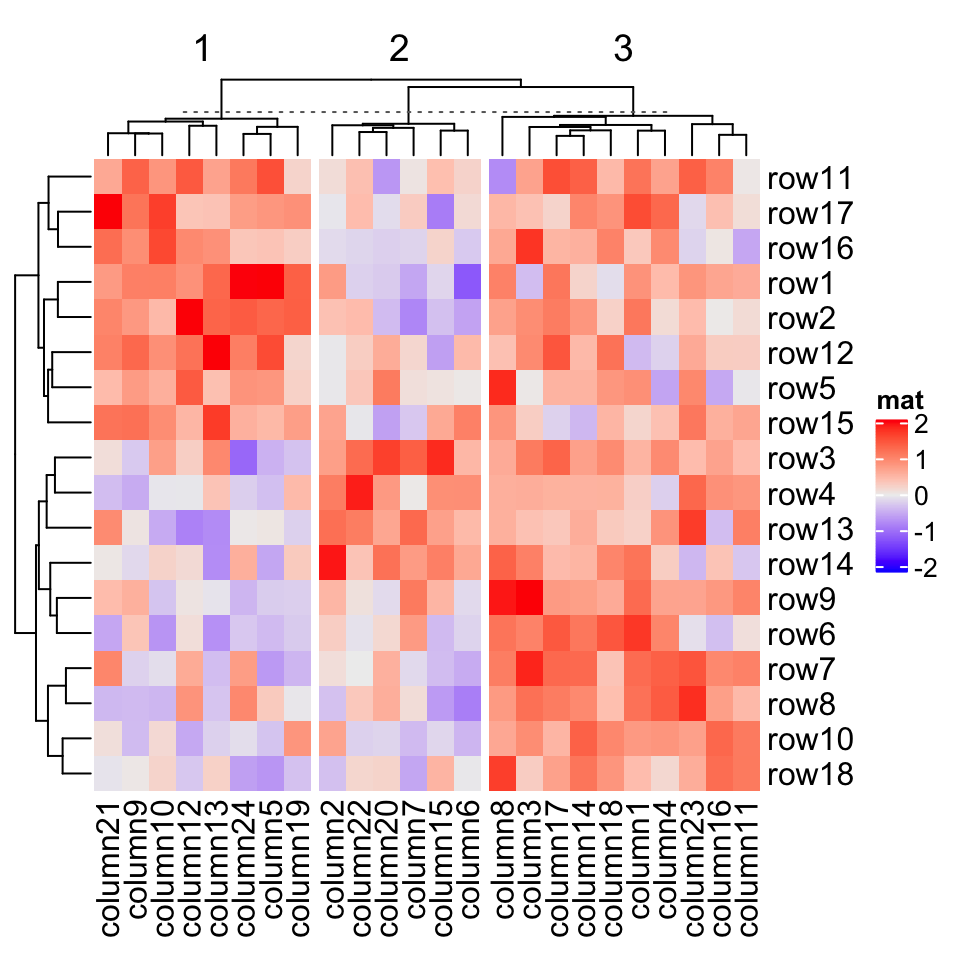
row_km and column_km apply k-means partitioning.row_km 和 column_km 应用 k-means 进行拆分。
Heatmap(mat, name = "mat", row_km = 2)
Heatmap(mat, name = "mat", column_km = 3)
Row splitting and column splitting can be performed simultaneously.
行拆分和列拆分可以同时执行。
Heatmap(mat, name = "mat", row_km = 2, column_km = 3)
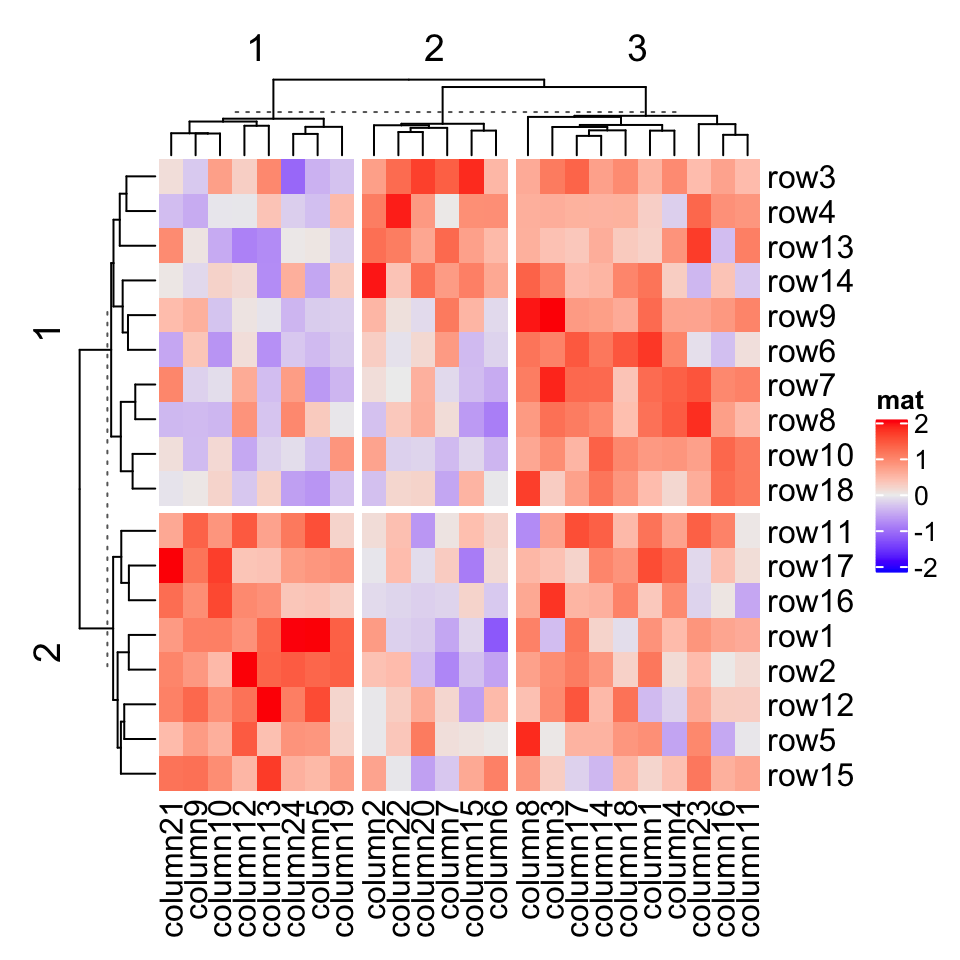
You might notice there are dashed lines in the row and column dendrograms, it will be explained in Section 2.7.2 (last paragraph).
您可能会注意到行和列树形图中有虚线,将在第 2.7.2 节(最后一段)中进行说明。
Heatmap() internally calls kmeans() with random start points, which results in, for some cases, generating different clusters from repeated runs. To get rid of this problem, row_km_repeats and column_km_repeats can be set to a number larger than 1 to run kmeans() multiple times and a final consensus k-means clustering is used. Please note the final number of clusters form consensus k-means might be smaller than the number set in row_km and column_km.Heatmap() 在内部调用了 kmeans() 作为随机起始点,这会导致在某些情况下从重复运行中生成不同的集群。为了解决这个问题,可以将 row_km_repeats 和 column_km_repeats 设置为大于 1 的数字以多次运行 kmeans() ,并使用最终的 consensus k-means 值聚类。 请注意,consensus k-means 的最终簇数可能小于 row_km 和 column_km 中设置的数量。
Heatmap(mat, name = "mat",row_km = 2, row_km_repeats = 100,column_km = 3, column_km_repeats = 100)
2.7.2 按分类变量拆分
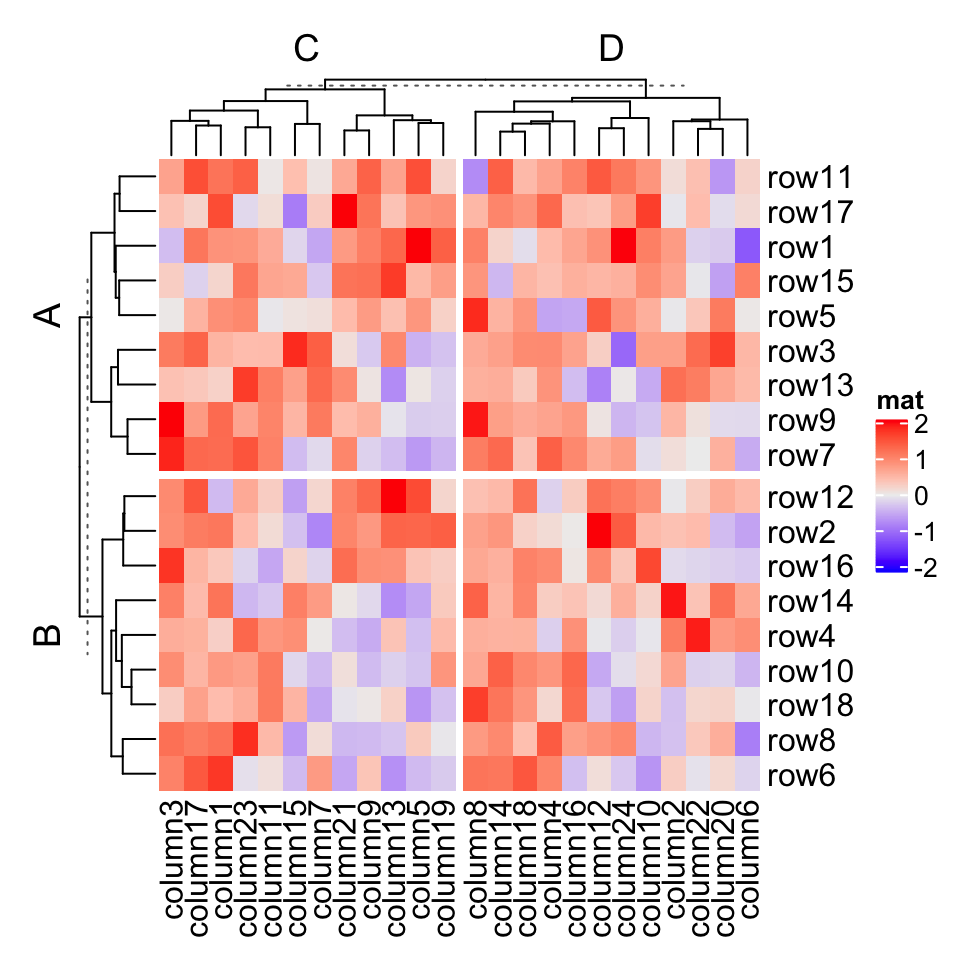
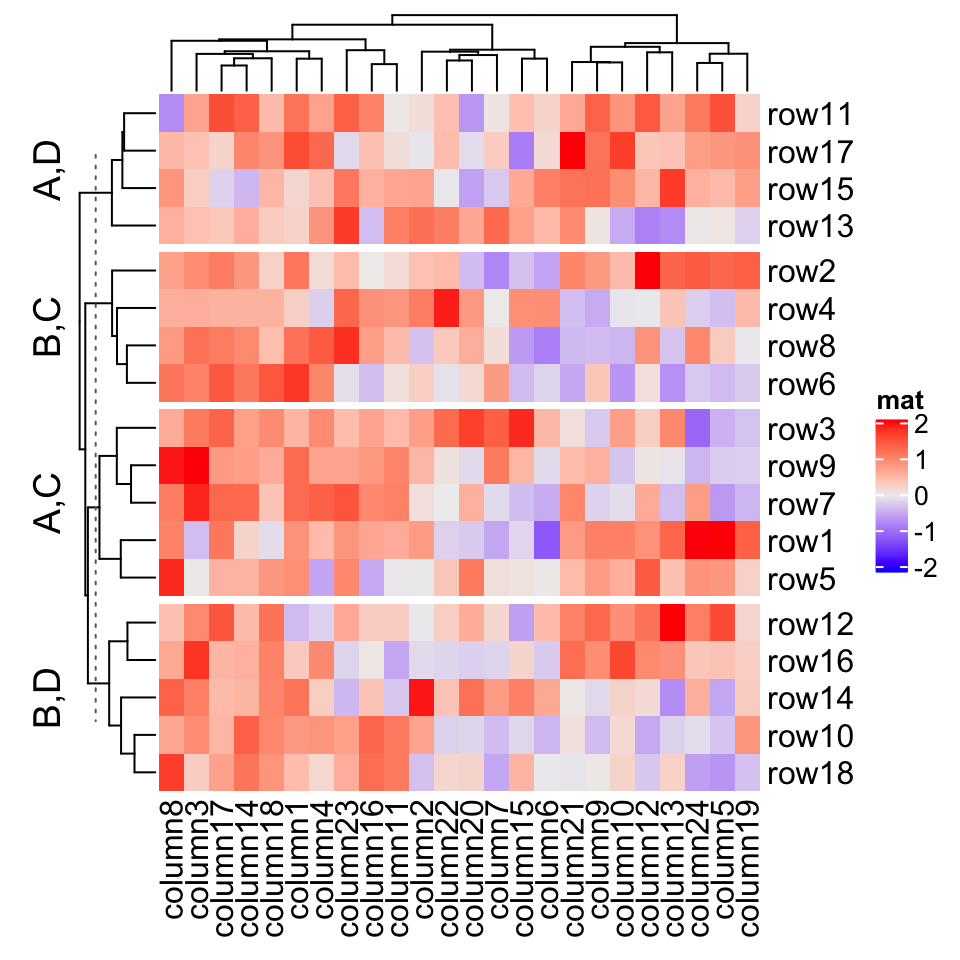
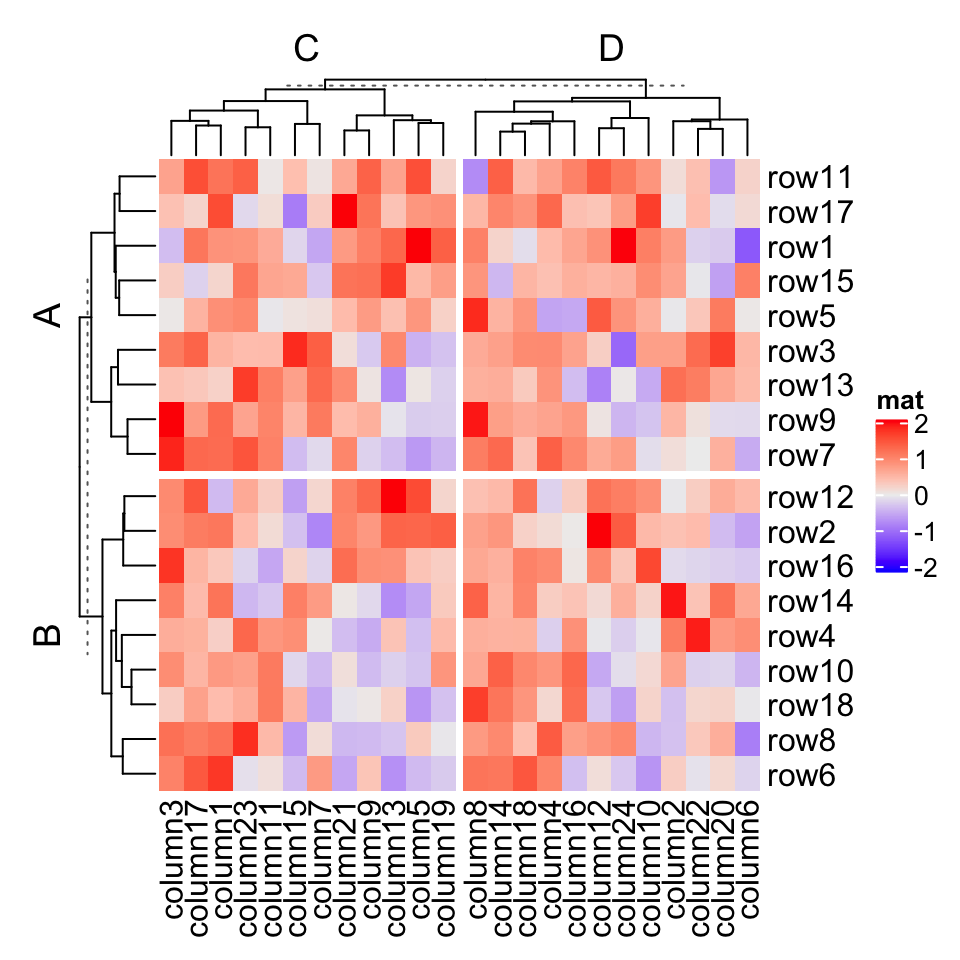
More generally, row_split or column_split can be set to a categorical vector or a data frame where different combinations of levels split the rows/columns in the heatmap. How to control the order of the slices is introduced in Section 2.7.4.
更常用的是, row_split 或 column_split 可以设置为分类向量或数据框,其中不同的级别组合分割热图中的行/列。 第 2.7.4 节介绍了如何控制切片的顺序。
# split by a vectorHeatmap(mat, name = "mat",row_split = rep(c("A", "B"), 9), column_split = rep(c("C", "D"), 12))
# split by a data frameHeatmap(mat, name = "mat",row_split = data.frame(rep(c("A", "B"), 9), rep(c("C", "D"), each = 9)))
# split on both dimensionsHeatmap(mat, name = "mat", row_split = factor(rep(c("A", "B"), 9)),column_split = factor(rep(c("C", "D"), 12)))
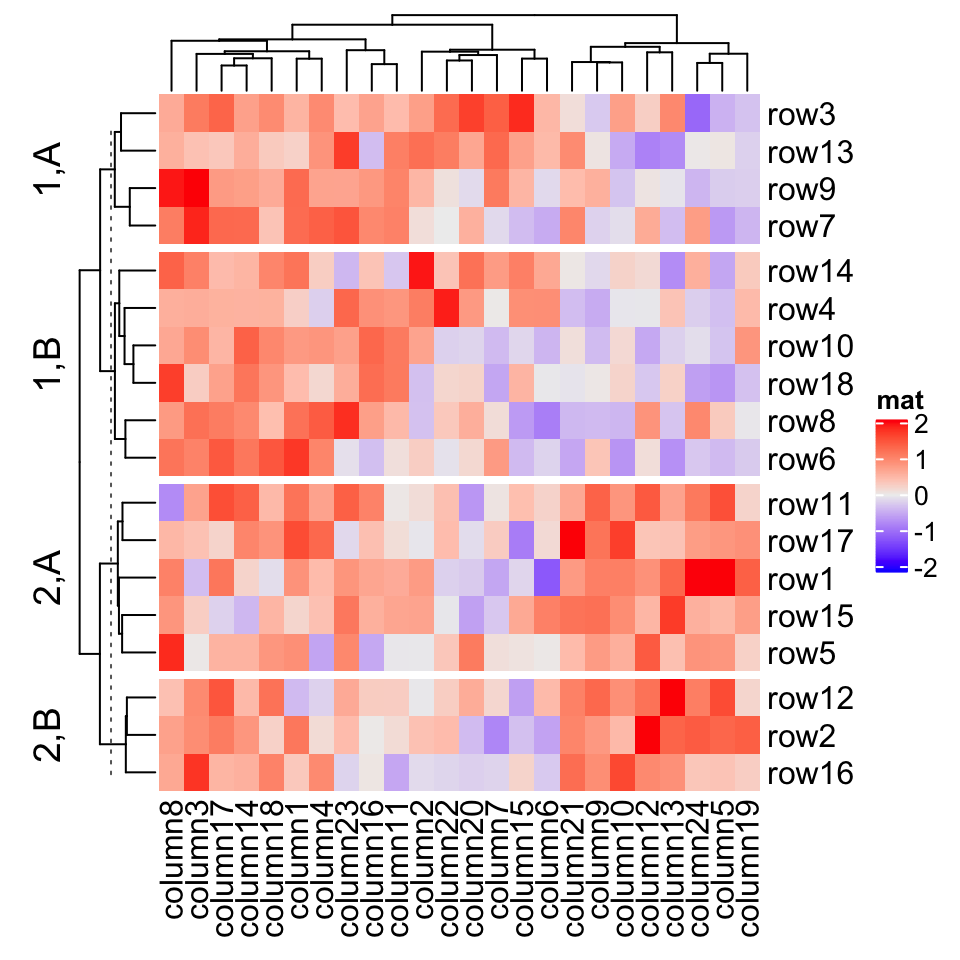
Actually, k-means clustering just generates a vector of cluster classes and appends to row_split or column_split. row_km/column_km and be used mixed with row_split and column_split.
实际上,k-means 聚类只生成一个簇类向量,并附加到 row_split 或 column_split 。row_km / column_km 与 row_split 和 column_split 混合使用。
Heatmap(mat, name = "mat", row_split = rep(c("A", "B"), 9), row_km = 2)
which is the same as:
这与下面是一样的:
# code only for demonstrationcl = kmeans(mat, centers = 2)$cluster# classes from k-means are always put as the first column in `row_split`Heatmap(mat, name = "mat", row_split = cbind(cl, rep(c("A", "B"), 9)))
If you are not happy with the default k-means partition, it is easy to use other partition methods by just assigning the partition vector to row_split/column_split.
如果您对默认的 k-means 分区不满意,只需将分区向量分配给 row_split / column_split 就可以轻松使用其他分区方法。
pa = cluster::pam(mat, k = 3)Heatmap(mat, name = "mat", row_split = paste0("pam", pa$clustering))
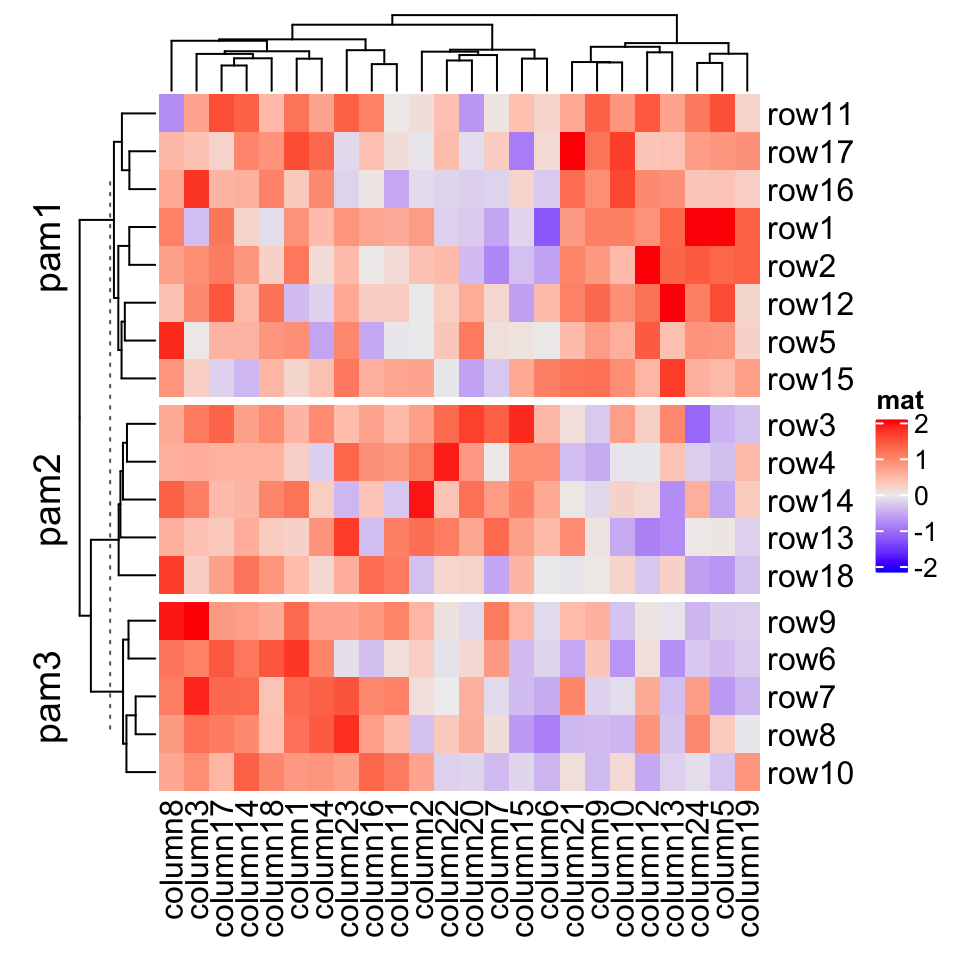
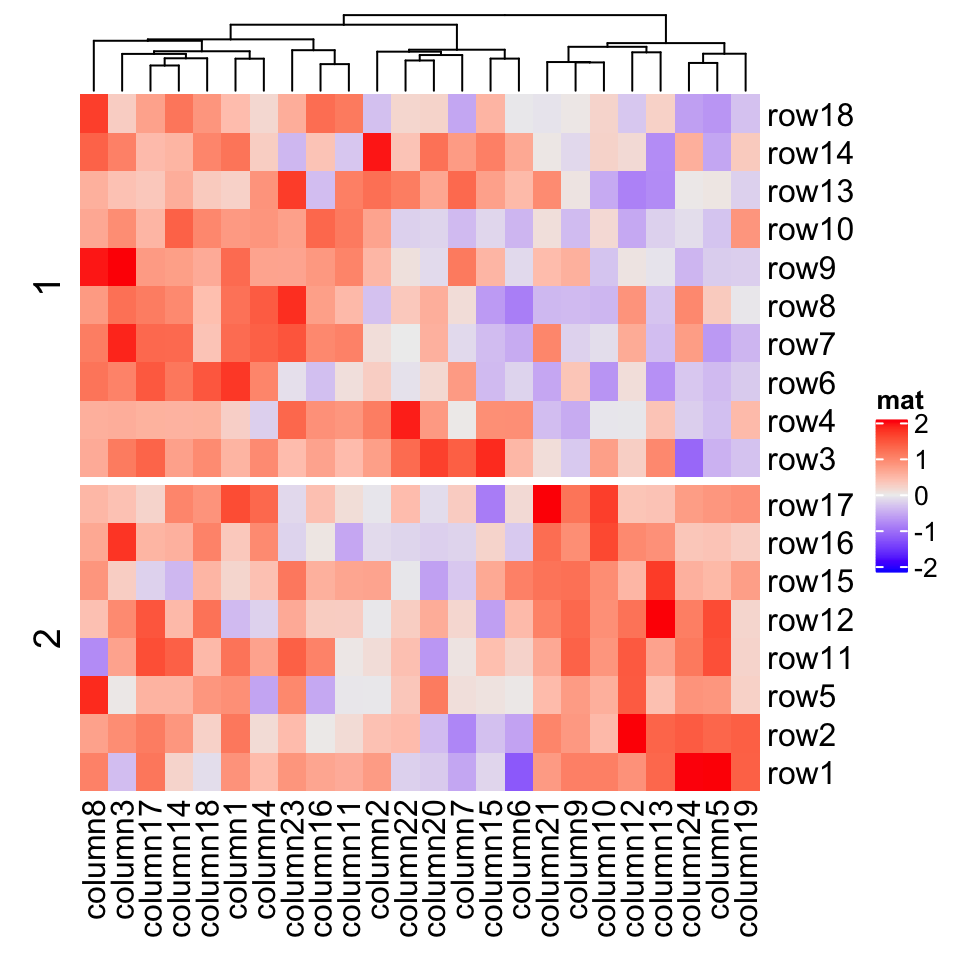
If row_order or column_order is set, in each row/column slice, it is still ordered.
如果设置了 row_order 或 column_order ,则在每个行/列切片中仍然会对其进行排序。
# remember when `row_order` is set, row clustering is turned offHeatmap(mat, name = "mat", row_order = 18:1, row_km = 2)
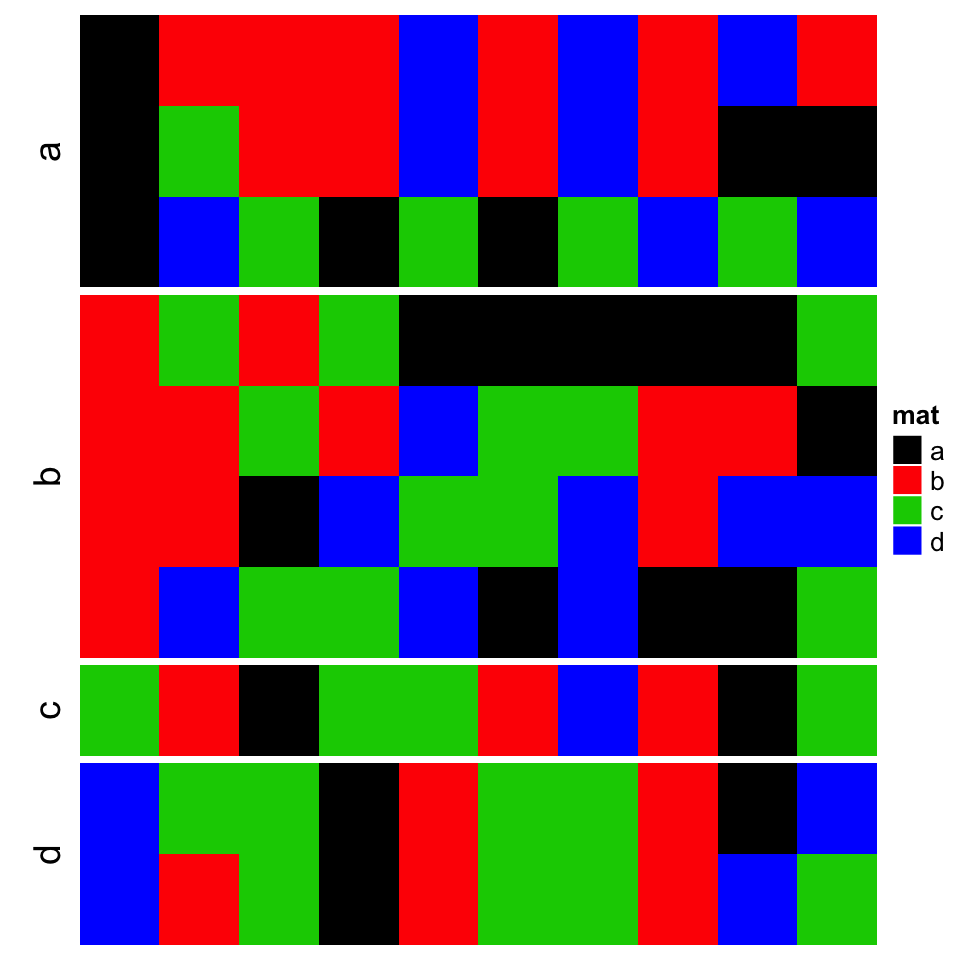
Character matrix can only be split by row_split/column_split argument.
字符矩阵只能通过 row_split / column_split 参数进行拆分。
# split by the first column in `discrete_mat`Heatmap(discrete_mat, name = "mat", col = 1:4, row_split = discrete_mat[, 1])
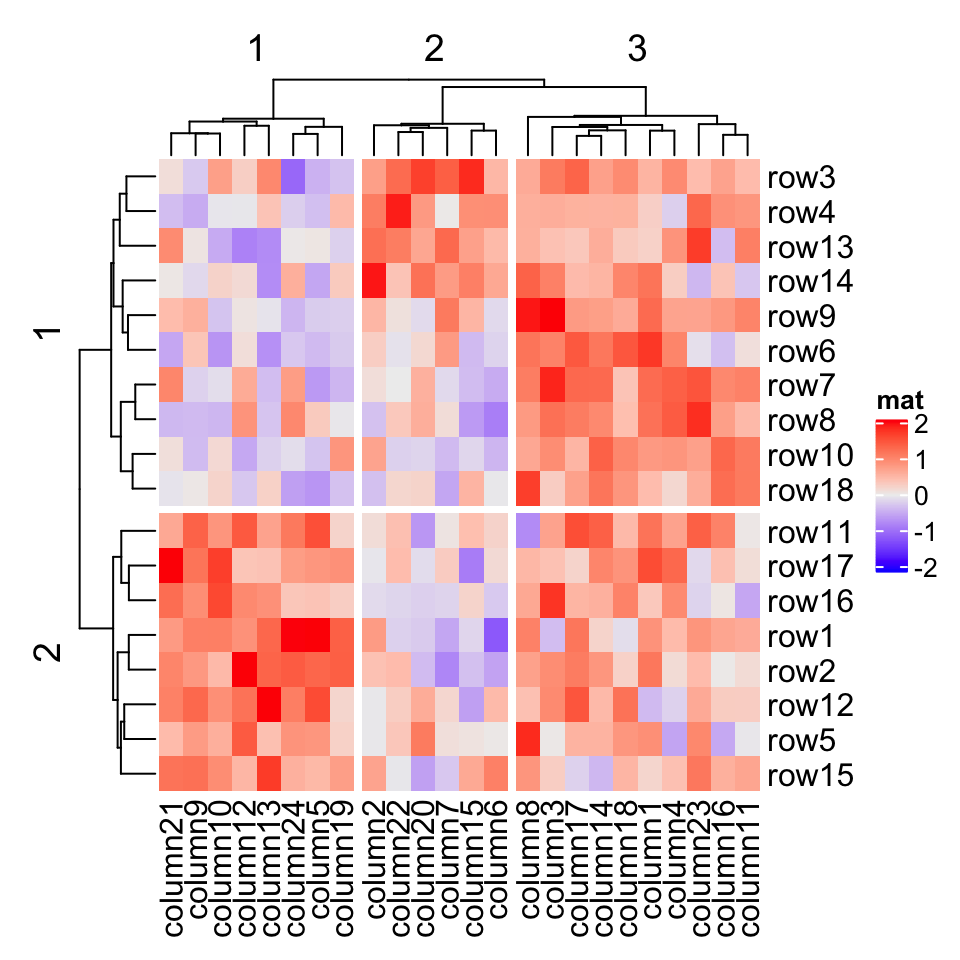
If row_km/column_km is set or row_split/column_split is set as a vector or a data frame, hierarchical clustering is first applied to each slice (of course, clustering should be turned on) which generates k dendrograms, then a parent dendrogram is generated based on the mean values of each slice. The height of the parent dendrogram is adjusted by adding the maximal height of the dendrograms in all children slices and the parent dendrogram is added on top of the children dendrograms to form a single global dendrogram. This is why you see dashed lines in the dendrograms in previous heatmaps. They are used to mark the parent dendrogram and the children dendrograms, and alert users they are calculated in different ways. These dashed lines can be removed by setting show_parent_dend_line = FALSE in Heatmap(), or set it as a global option: ht_opt$show_parent_dend_line = FALSE.
如果设置了 row_km / column_km 或者将 row_split / column_split 设置为向量或数据框,则分层聚类将会首先应用于每个切片(当然,聚类将会开启),生成 k 树形图,然后根据在每个切片的平均值生成基于树形图的父树形图。通过在所有子切片中添加树形图的最大高度来调整父树形图的高度,并在子树形图之上添加父树形图以形成单个全局树状图。这就是您在之前的热图中看到树形图中虚线的原因。它们用于标记父树形图和子树形图,并提醒用户以不同方式计算它们。可以通过在 Heatmap() 中设置 show_parent_dend_line = FALSE 来删除这些虚线,或将其设置为全局选项: ht_opt$show_parent_dend_line = FALSE 。
Heatmap(mat, name = "mat", row_km = 2, column_km = 3, show_parent_dend_line = FALSE)
2.7.3 按树状图拆分
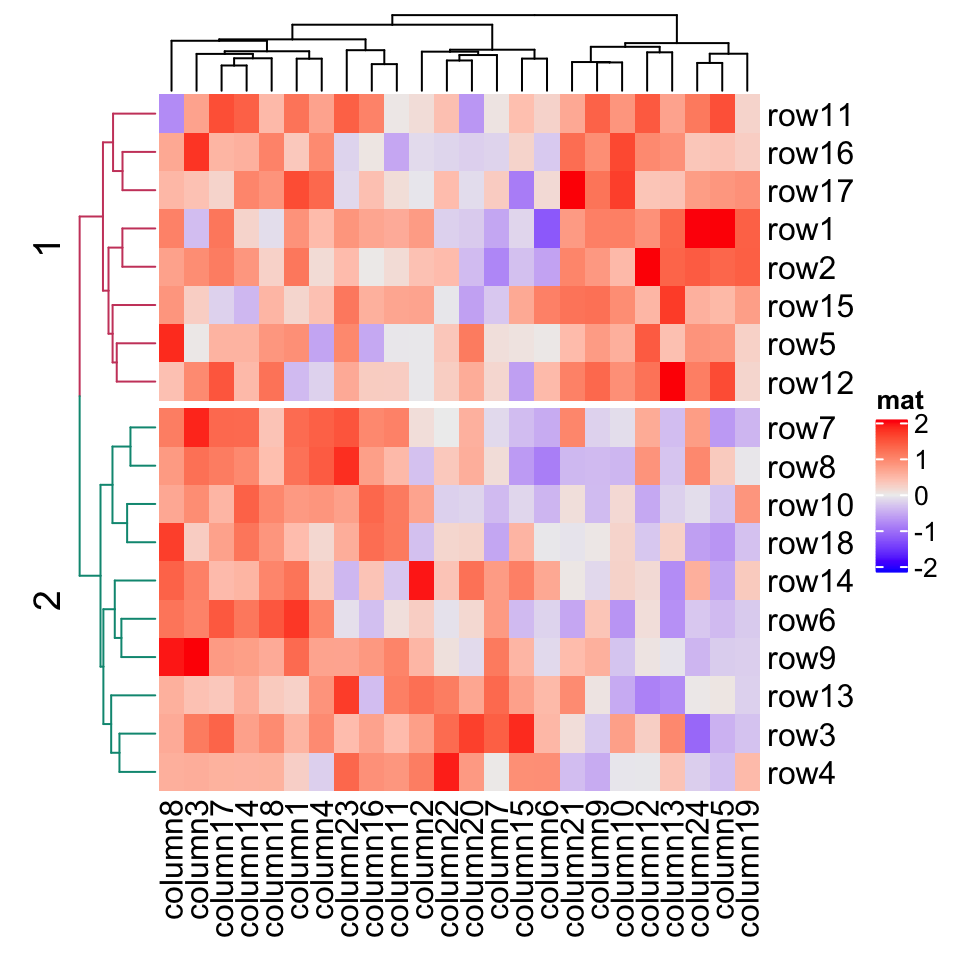
A second scenario for splitting is that users may still want to keep the global dendrogram which is generated from the complete matrix while not split it in the first place. In this case, row_split/column_split can be set to a single number which will apply cutree() on the row/column dendrogram. This works when cluster_rows/cluster_columns is set to TRUE or is assigned with a hclust/dendrogram object.
拆分的第二种情况是用户可能仍希望保留从完整矩阵生成的全局树形图,而不是首先将其拆分。在这种情况下, row_split / column_split 可以设置为单个数字,它将在行/列树形图上应用 cutree() 。当 cluster_rows / cluster_columns 设置为 TRUE 或把它们分配给 hclust / dendrogram 对象时,此方法才生效。
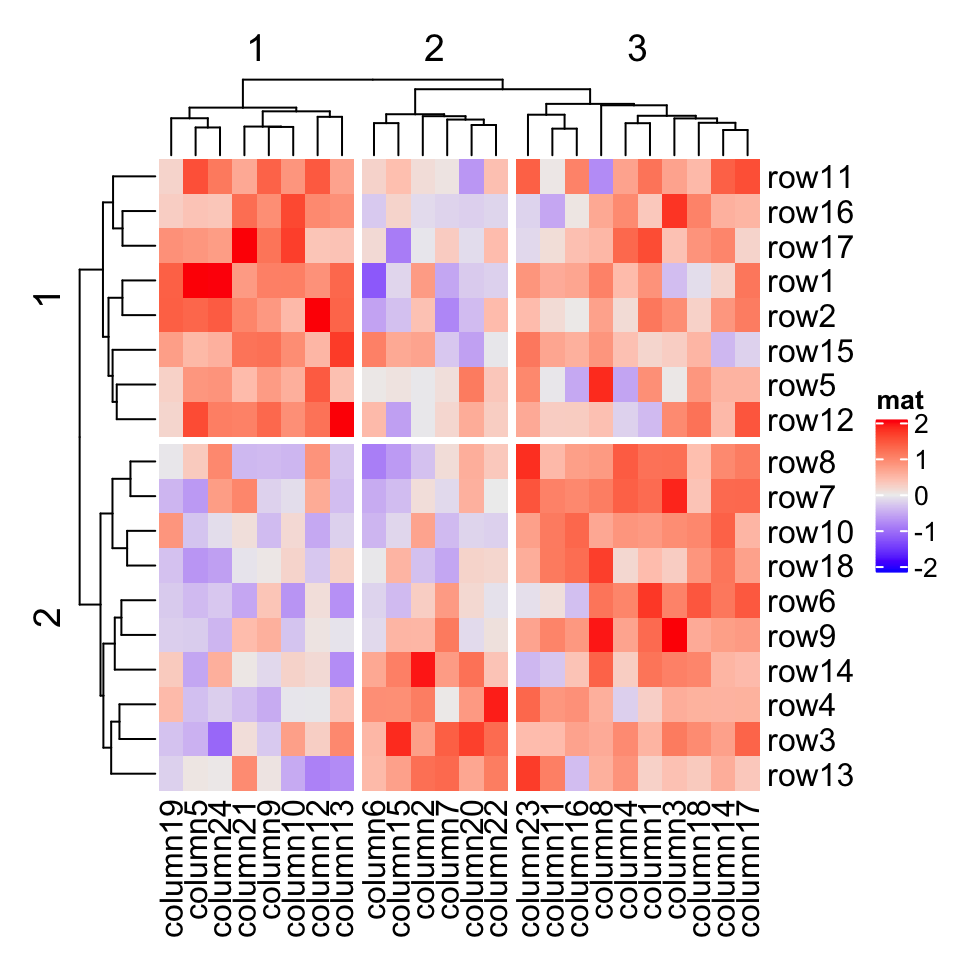
For this case, the dendrogram is still as same as the original one, expect the positions of dendrogram leaves are slightly adjusted by the gaps between slices. (There is no dashed lines, because here the dendrogram is calcualted as a complete one and there is no parent dendrogram or children dendrograms.)
对于这种情况,树形图仍然与原始树形图相同,期望树形图叶片的位置通过切片之间的间隙稍微调整。(没有虚线,因为这里树形图被计算为完整的树形图,并且没有父树形图或子树形图。)
Heatmap(mat, name = "mat", row_split = 2, column_split = 3)
dend = hclust(dist(mat))dend = color_branches(dend, k = 2)Heatmap(mat, name = "mat", cluster_rows = dend, row_split = 2)
If you want to combine splitting from cutree() and other categorical variables, you need to generate the classes from cutree() in the first place, append to e.g. row_split as a data frame and then send it to row_split argument.
如果你想组合 cutree() 和其他分类变量的拆分,你需要首先从 cutree() 生成类,附加到,例如 row_split 作为数据框,然后将其传递给 row_split 参数。
# code only for demonstrationsplit = data.frame(cutree(hclust(dist(mat)), k = 2), rep(c("A", "B"), 9))Heatmap(mat, name = "mat", row_split = split)
2.7.4 切片顺序
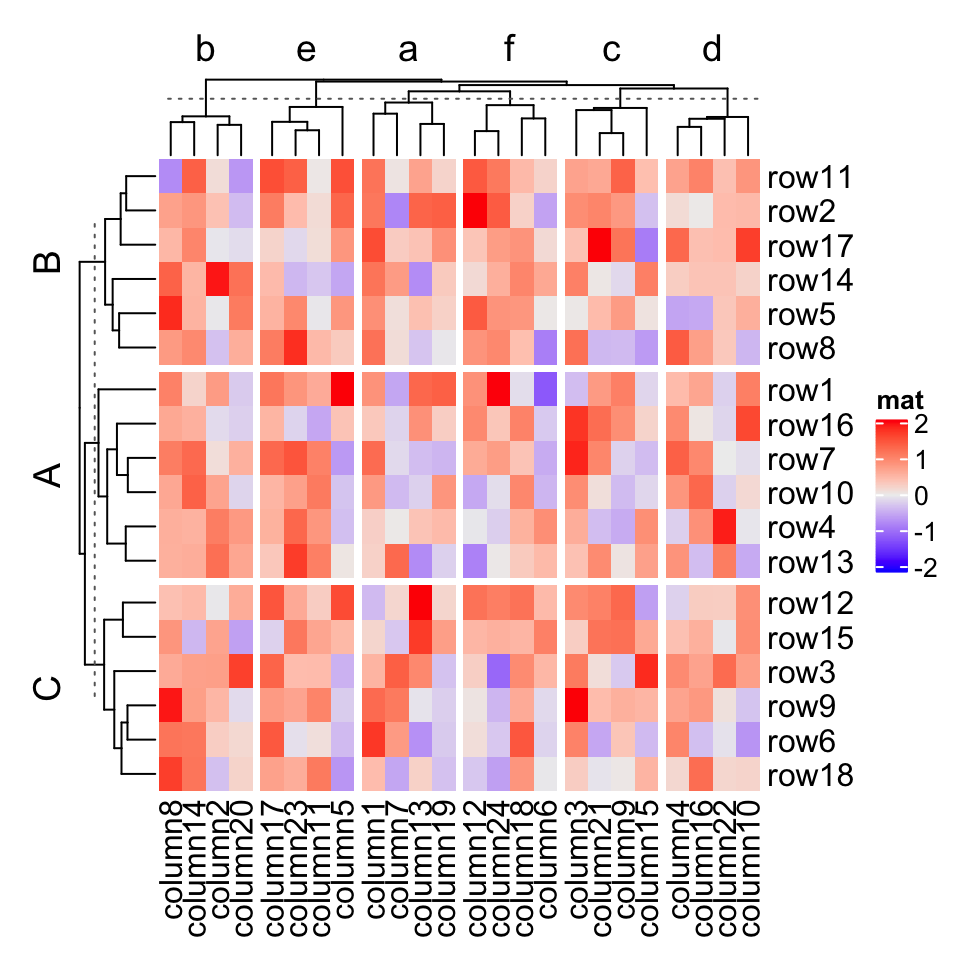
When row_split/column_split is set as categorical variable (a vector or a data frame) or row_km/column_km is set, by default, there is an additional clustering applied to the mean of slices to show the hierarchy in the slice level. Under this scenario, you cannot precisely control the order of slices because it is controlled by the clustering of slices.
当 row_split / column_split 设置为分类变量(向量或数据框)或已经设置了 row_km / column_km 时,默认情况下,会有一个额外的聚类应用于切片的平均值,以显示切片级别的层次结构。在这种情况下,您无法精确控制切片的顺序,因为它由切片的聚类控制。
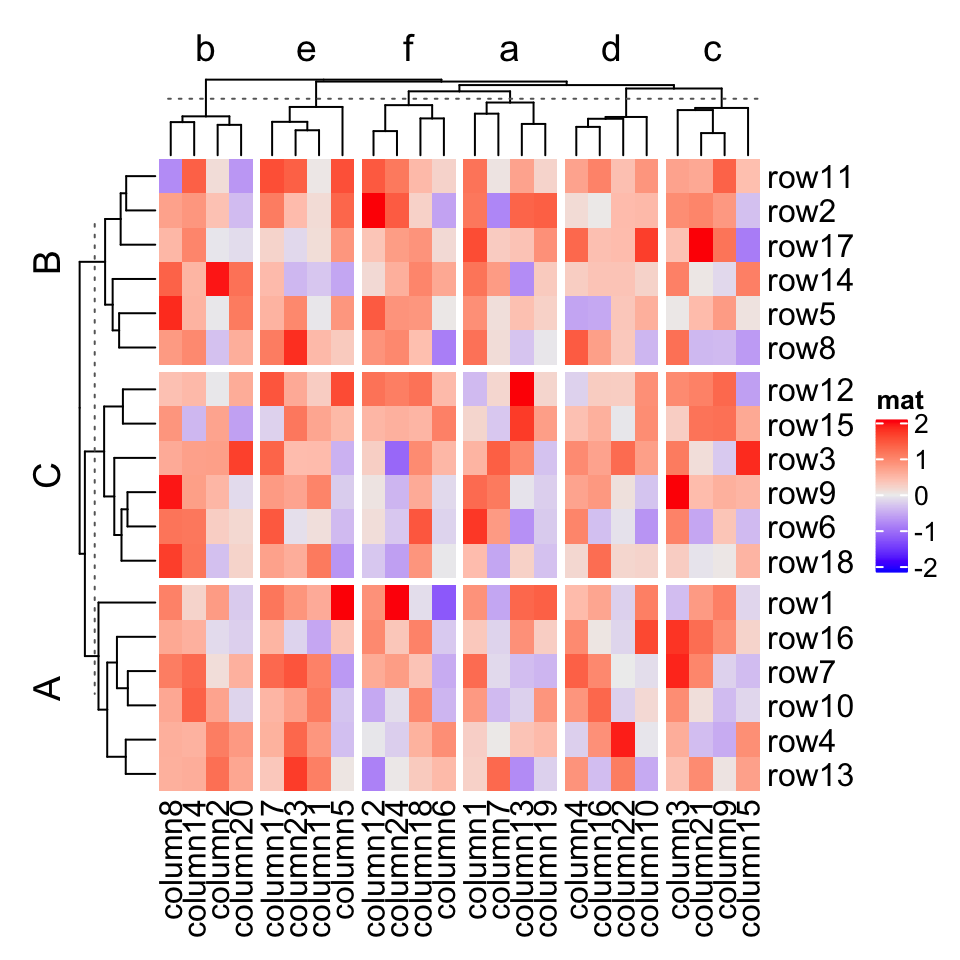
Nevertheless, you can set cluster_row_slices or cluster_column_slices to FALSE to turn off the clustering on slices, and now you can precisely control the order of slices.
不过,您可以将 cluster_row_slices 或 cluster_column_slices 设置为 FALSE 以关闭切片上的聚类,现在您可以精确控制切片的顺序。
When there is no slice clustering, the order of each slice can be controlled by levels of each variable in row_split/column_split (in this case, each variable should be a factor). If all variables are characters, the default order is unique(row_split) or unique(column_split). Compare following heatmaps:
当没有切片聚类时,每个切片的顺序可以通过 row_split / column_split 中每个变量的级别来控制(在这种情况下,每个变量应该是一个因子)。如果所有变量都是字符,则默认顺序为 unique(row_split) 或 unique(column_split)。比较以下热图:
Heatmap(mat, name = "mat",row_split = rep(LETTERS[1:3], 6),column_split = rep(letters[1:6], 4))
# clustering is similar as previous heatmap with branches in some nodes in the dendrogram flippedHeatmap(mat, name = "mat",row_split = factor(rep(LETTERS[1:3], 6), levels = LETTERS[3:1]),column_split = factor(rep(letters[1:6], 4), levels = letters[6:1]))
# now the order is exactly what we setHeatmap(mat, name = "mat",row_split = factor(rep(LETTERS[1:3], 6), levels = LETTERS[3:1]),column_split = factor(rep(letters[1:6], 4), levels = letters[6:1]),cluster_row_slices = FALSE,cluster_column_slices = FALSE)
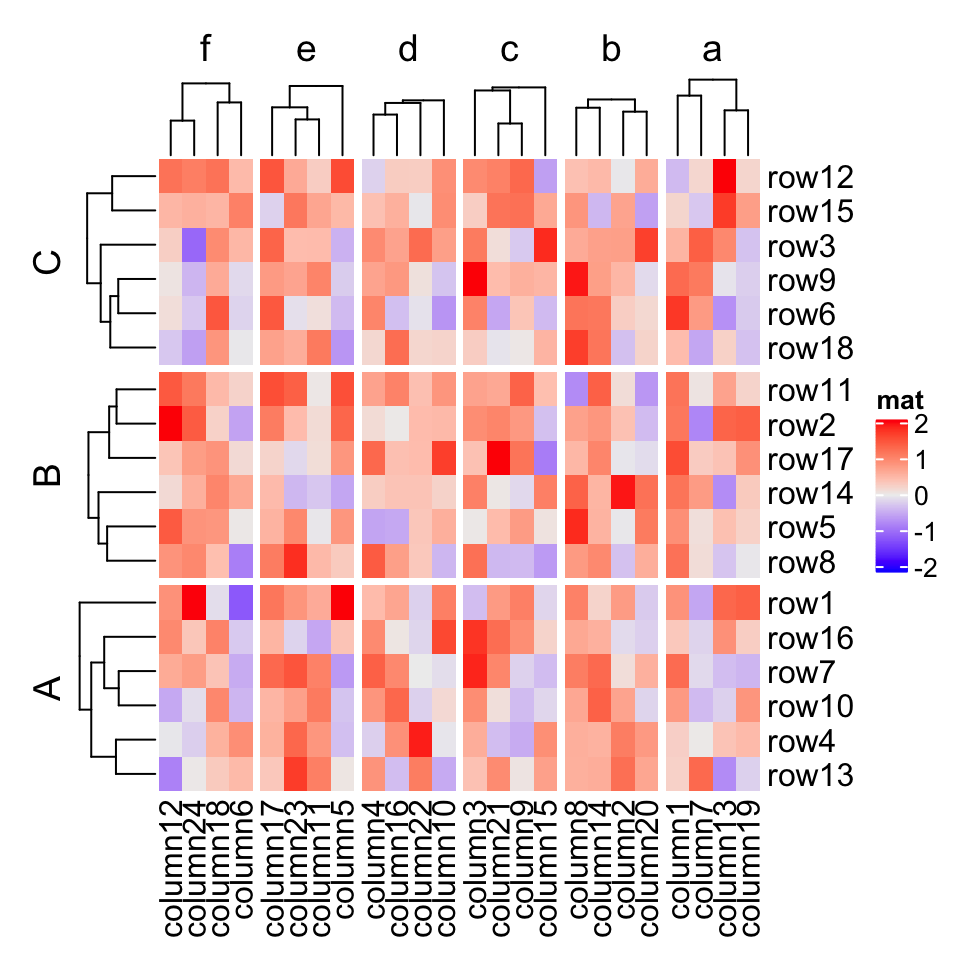
2.7.5 拆分标题
When row_split/column_split is set as a single number, there is only one categorical variable, while when row_km/column_km is set and/or row_split/column_split is set as categorical variables, there will be multiple categorical variables. By default, the titles are in a form of "level1,level2,..." which corresponds to every combination of levels in all categorical variables. The titles for splitting can be controlled by “a title template”.
当 row_split / column_split 设置为单个数字时,只有一个分类变量;而当设置了 row_km / column_km 和/或将 row_split / column_split 设置为分类变量时,将有多个分类变量。默认情况下,标题采用 “level1,level2, …”的形式,对应于所有分类变量中的每个级别组合。拆分的标题可以通过 “标题模板” 来控制。
ComplexHeatmap supports three types of templates. The first one is by sprintf() where the %s is replaced by the corresponding level. In following example, since all combinations of split are A,C, A,D, B,C and B,D, if row_title is set to %s|%s, the four row titles will be A|C, A|D, B|C, B|D.
ComplexHeatmap 支持三种类型的模板。第一个是 sprintf() ,其中 %s 被相应的级别替换。在下面的示例中,由于所有的 split 组合都是 A, C , A, D , B, C 和 B, D ,如果 row_title 设置为 %s|%s ,则四行标题将变成 A|C , A|D , B|C , B|D 。
split = data.frame(rep(c("A", "B"), 9), rep(c("C", "D"), each = 9))Heatmap(mat, name = "mat", row_split = split, row_title = "%s|%s")
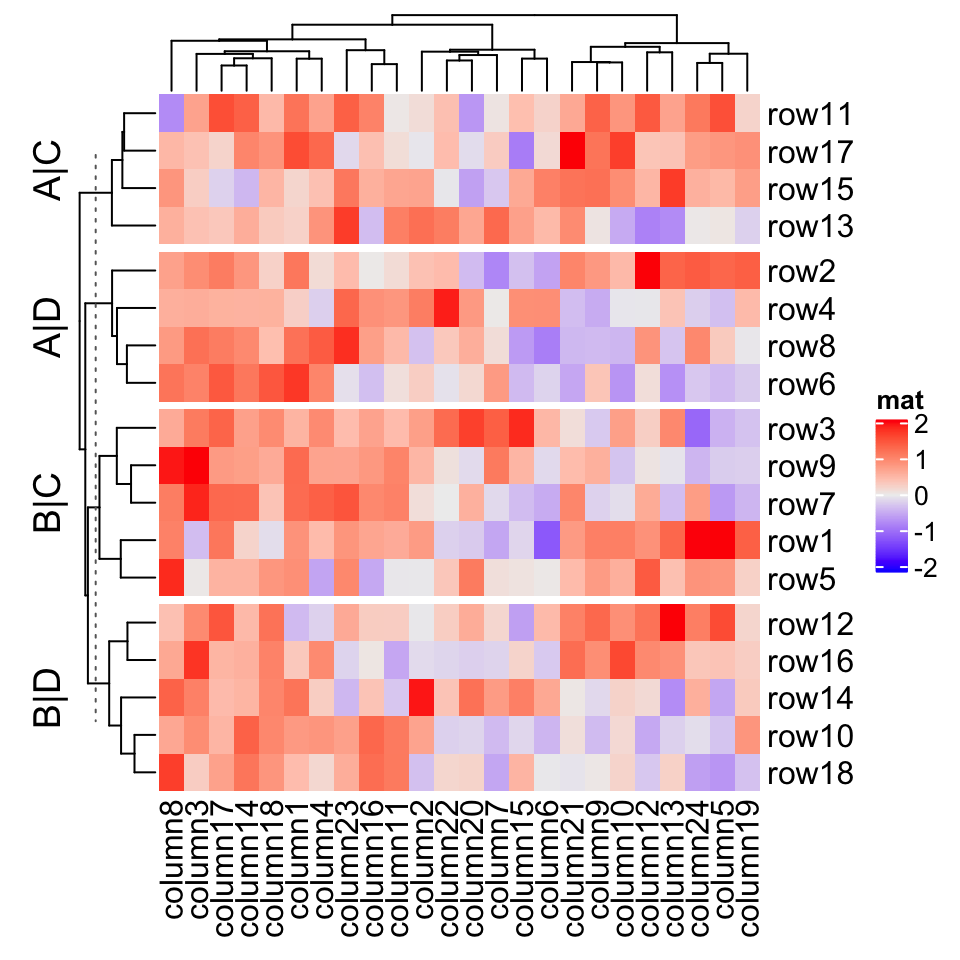
For the sprintf() template, you can only put the levels which are A,B,C,D in the title, and C,D is always after A,B. However, when making the heatmap, you might want to put more meaningful text instead of the internal levels. Once you know how to correspond the text to the level, you can add it by following two template methods.
对于 sprintf() 模板,您只能在标题中放置 A, B, C, D 等级,而 C, D 始终在 A, B 之后。但是,在制作热图时,您可能希望放置更有意义的文本而不是内部级别。一旦您知道如何将文本与级别对应,您可以通过以下两种模板方法添加它。
In the following two template methods, special marks are used to mark the R code which is executable (it is called variable interpolation where the code is extracted and executed and the returned value in put back to the string). There are two types of template marks @{}and {}. The first one is from GetoptLong package which should already be installed when you install the ComplexHeatmap package and the second one is from glue package which you need to install first.
在以下两种模板方法中,使用特殊标记来标记可执行的 R 代码(称为变量插值,其中代码被提取并执行,返回的值被放回到字符串中)。有两种类型的模板标记 @{} 和 {} 。第一个来自 GetoptLong 包,它应该在安装 ComplexHeatmap 软件包时安装;第二个软件包来自 glue 包,您需要先安装它。
There is an internal variable x you should use when you use the latter two templates. x is just a simple vector which contains current category levels (e.g. c("A", "C")).
当您使用后两个模板时,您应该使用内部变量 x 。 x 只是一个包含当前类别级别的简单向量(例如 c("A", "C")) 。
# We only run the code for the first heatmapmap = c("A" = "aaa", "B" = "bbb", "C" = "333", "D" = "444")Heatmap(mat, name = "mat", row_split = split, row_title = "@{map[ x[1] ]}|@{map[ x[2] ]}")Heatmap(mat, name = "mat", row_split = split, row_title = "{map[ x[1] ]}|{map[ x[2] ]}")
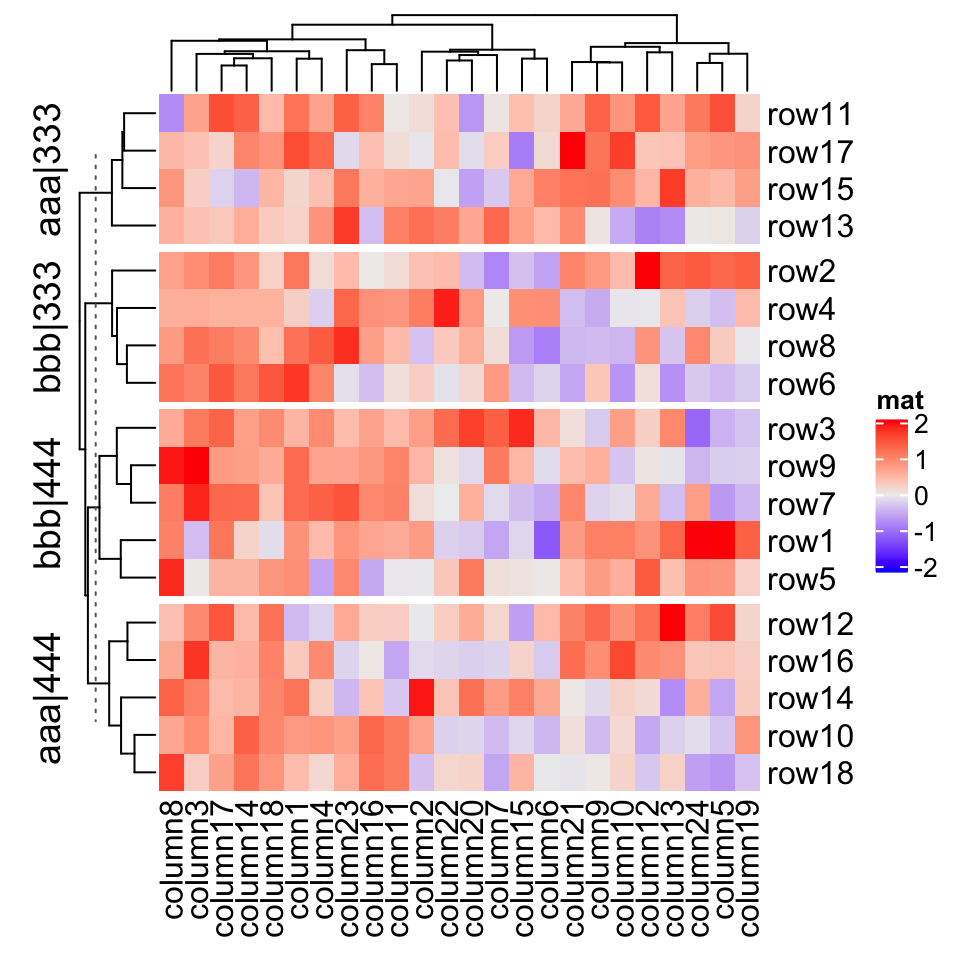
The row title is rotated by default, you can set row_title_rot = 0 to make it horizontal:
默认情况下会旋转行标题,您可以设置 row_title_rot = 0 使其变成水平:
Heatmap(mat, name = "mat", row_split = split, row_title = "%s|%s", row_title_rot = 0)
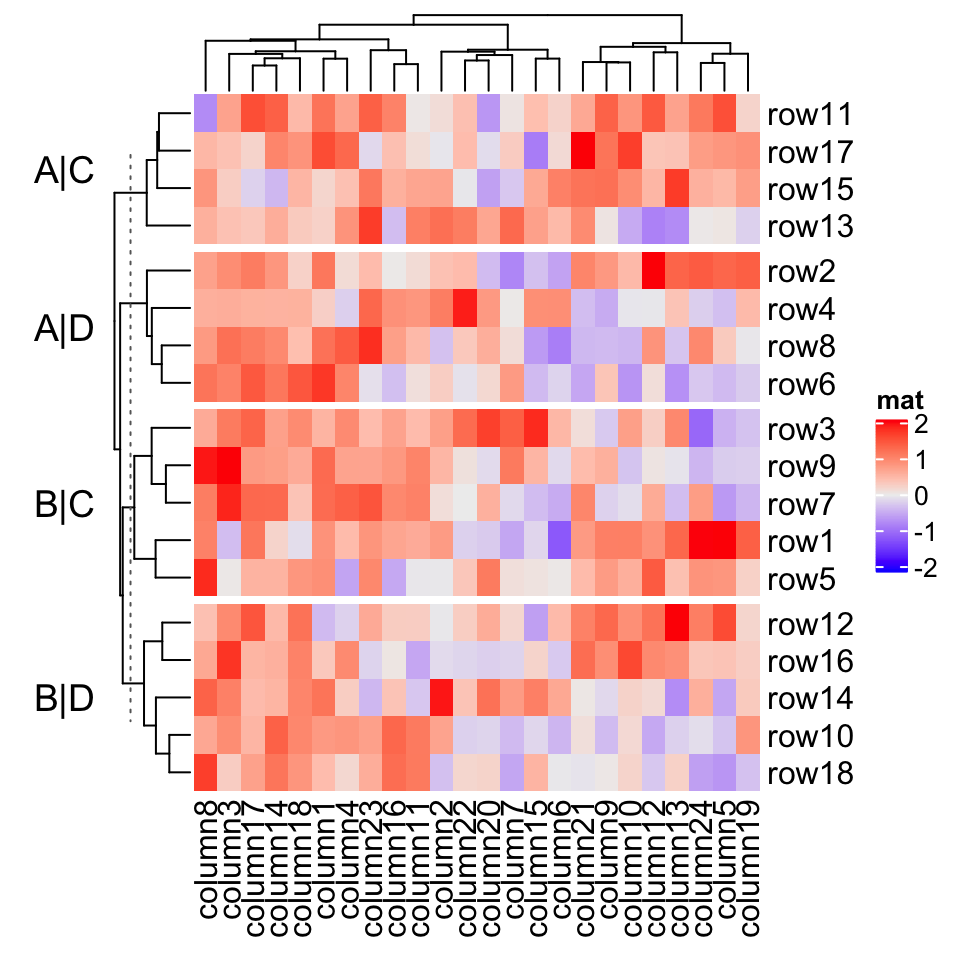
When row_split/column_split is set as a number, you can also use template to adjust the titles for slices.
当 row_split / column_split 设置为数字时,您还可以使用模板来调整切片的标题。
Heatmap(mat, name = "mat", row_split = 2, row_title = "cluster_%s")
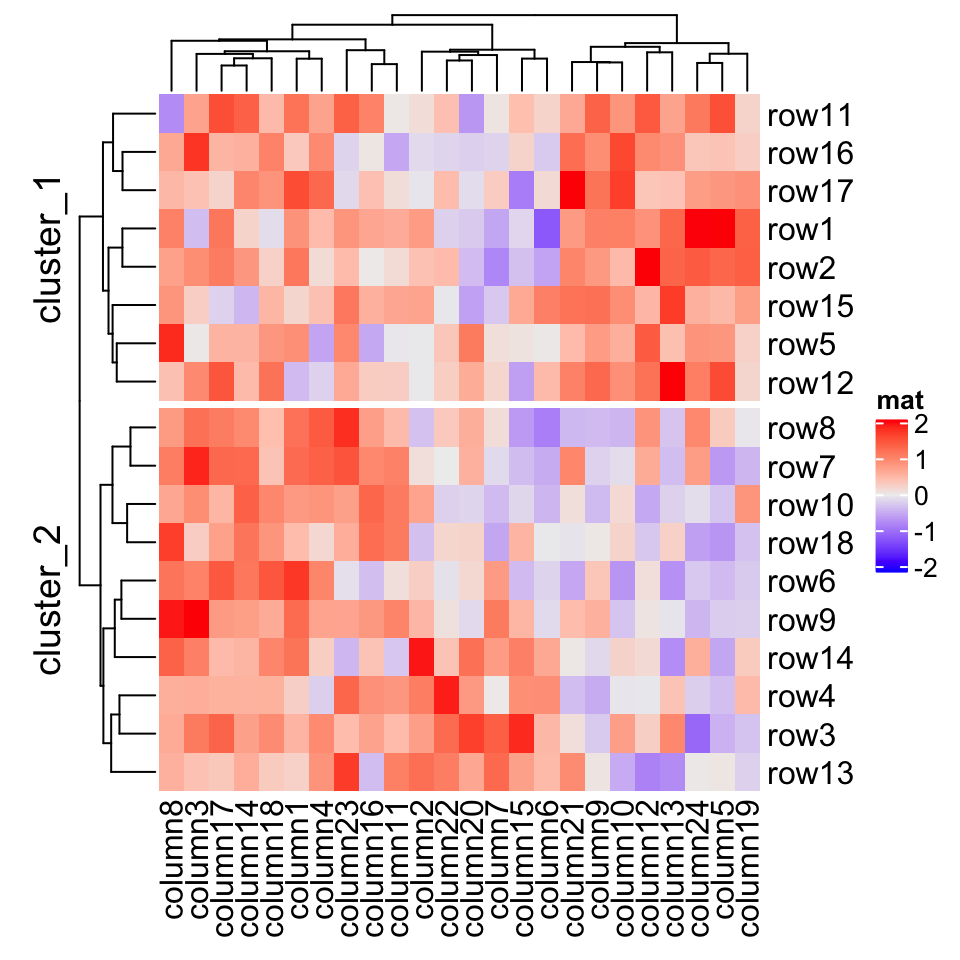
If you know the final number of row slices, you can directly set a vector of titles to row_title. Be careful the number of row slices is not always identical to nlevel_1*nlevel_2*....
如果您知道行切片的最终数量,则可以直接将标题向量设置为 row_title 。小心行切片的数量并不总是与 nlevel_1*nlevel_2*... 相同。
Heatmap(mat, name = "mat", row_split = split,row_title = c("top_slice", "middle_top_slice", "middle_bottom_slice", "bottom_slice"),row_title_rot = 0)
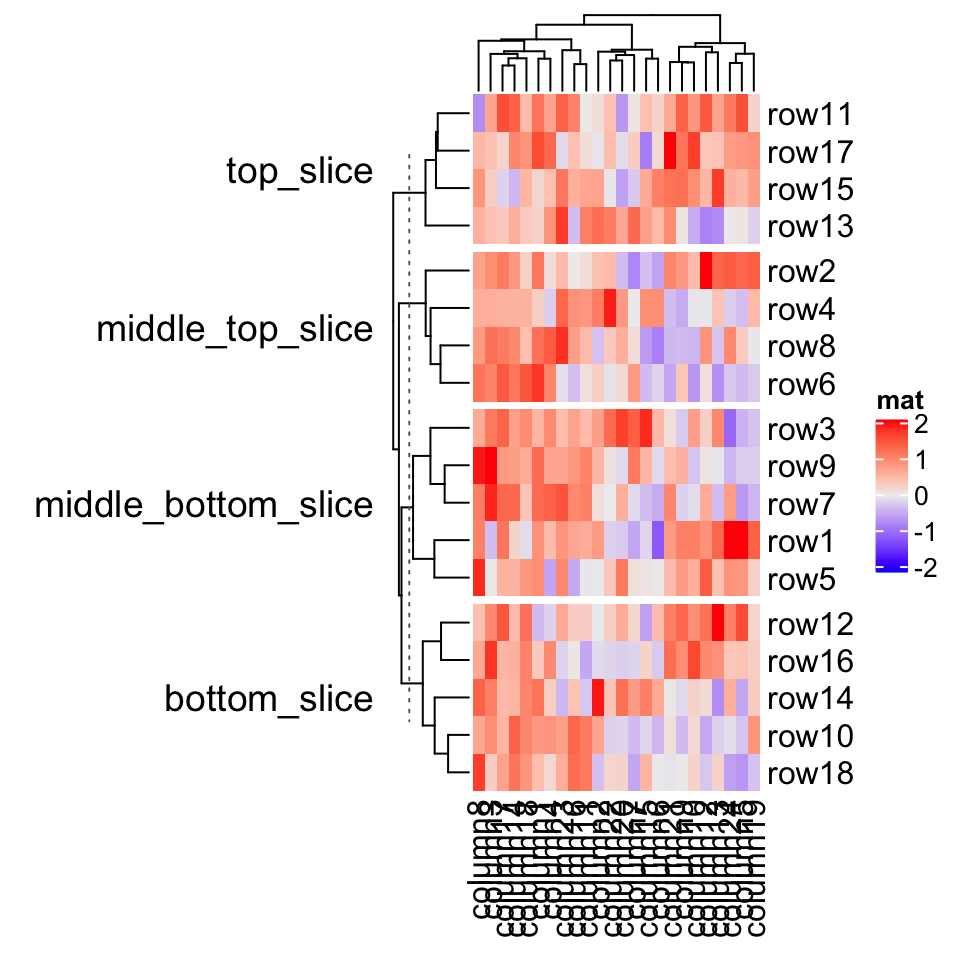
If the length of row_title is specified as a single string, it will be like a single title for all slices.
如果将 row_title 的长度指定为单个字符串,则它将类似于所有切片的单个标题。
Heatmap(mat, name = "mat", row_split = split, row_title = "there are four slices")
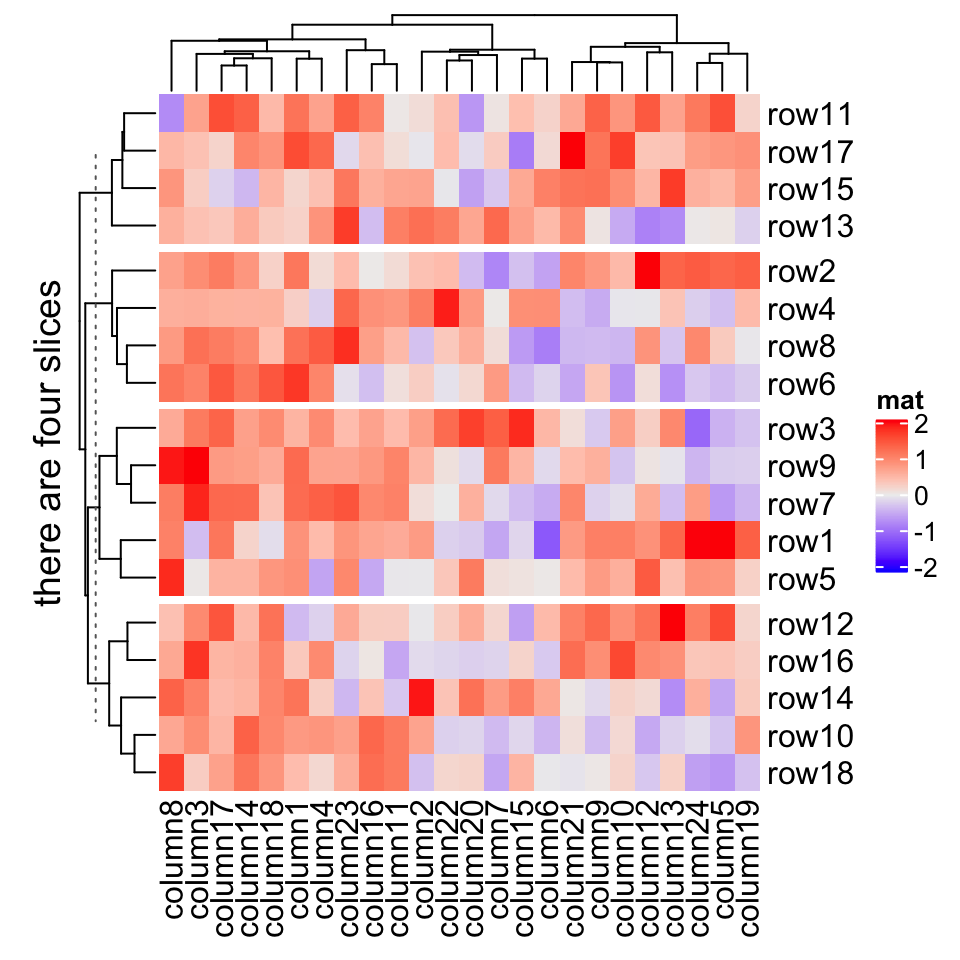
If you still want titles for each slice, but also a global title, you can do as follows.
如果您仍想要每个切片的标题,还需要全局标题,则可以执行以下操作。
ht = Heatmap(mat, name = "mat", row_split = split, row_title = "%s|%s")draw(ht, row_title = "I am a row title")
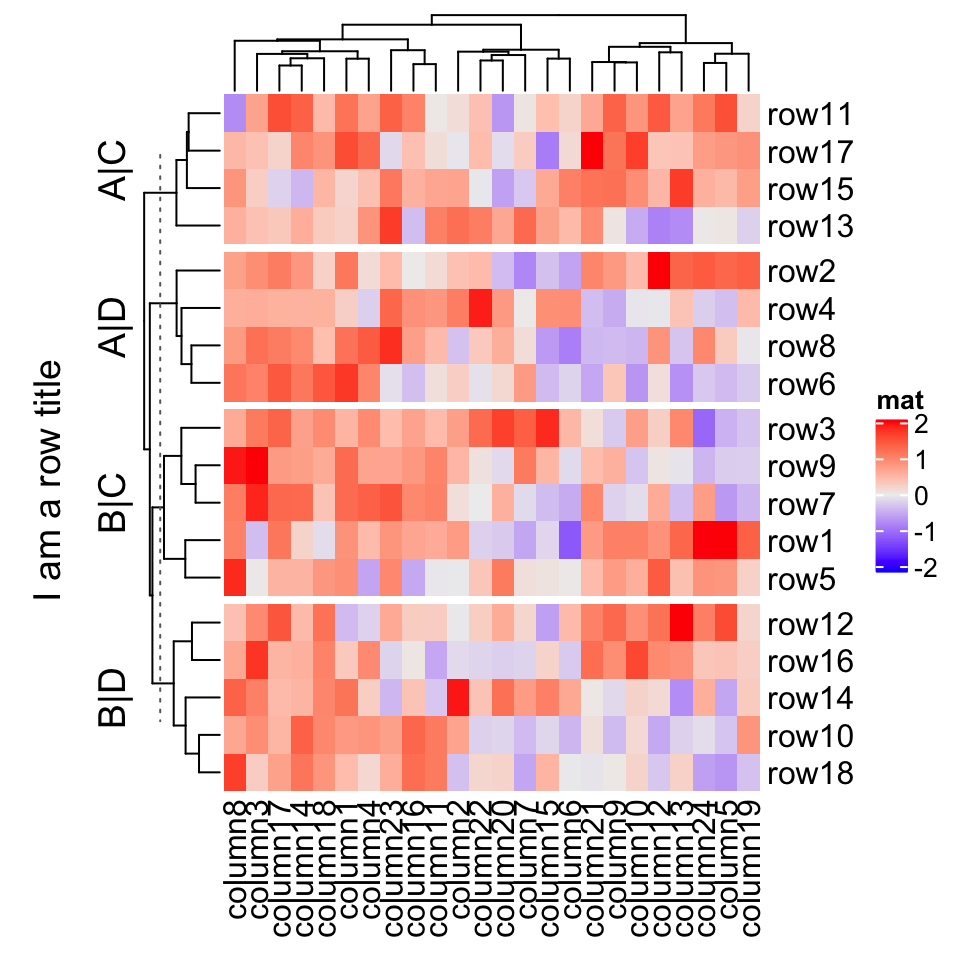
Actually the row_title used in draw() function is the row title of the heatmap list, although in the example there is only one heatmap. The draw() function and the heatmap list will be introduced in Chapter 4.
实际上, draw() 函数中使用的 row_title 是热图列表的行标题,尽管在该示例中只有一个热图。 draw() 函数和热图列表将在第 4 章中介绍。
If row_title is set to NULL, no row title will be drawn.
如果 row_title 设置为 NULL ,则不会绘制行标题。
Heatmap(mat, name = "mat", row_split = split, row_title = NULL)
All these rules also work for column titles for slices.
所有这些规则也适用于切片的列标题。
2.7.6 拆分图形参数
2.7.6 Graphic parameters for splitting
When splitting is applied on rows/columns, graphic parameters for row/column title and row/column names can be specified as same length as number of slices.
在行/列上应用拆分时,可以将行/列标题和行/列名称的图形参数指定为与切片数相同的长度。
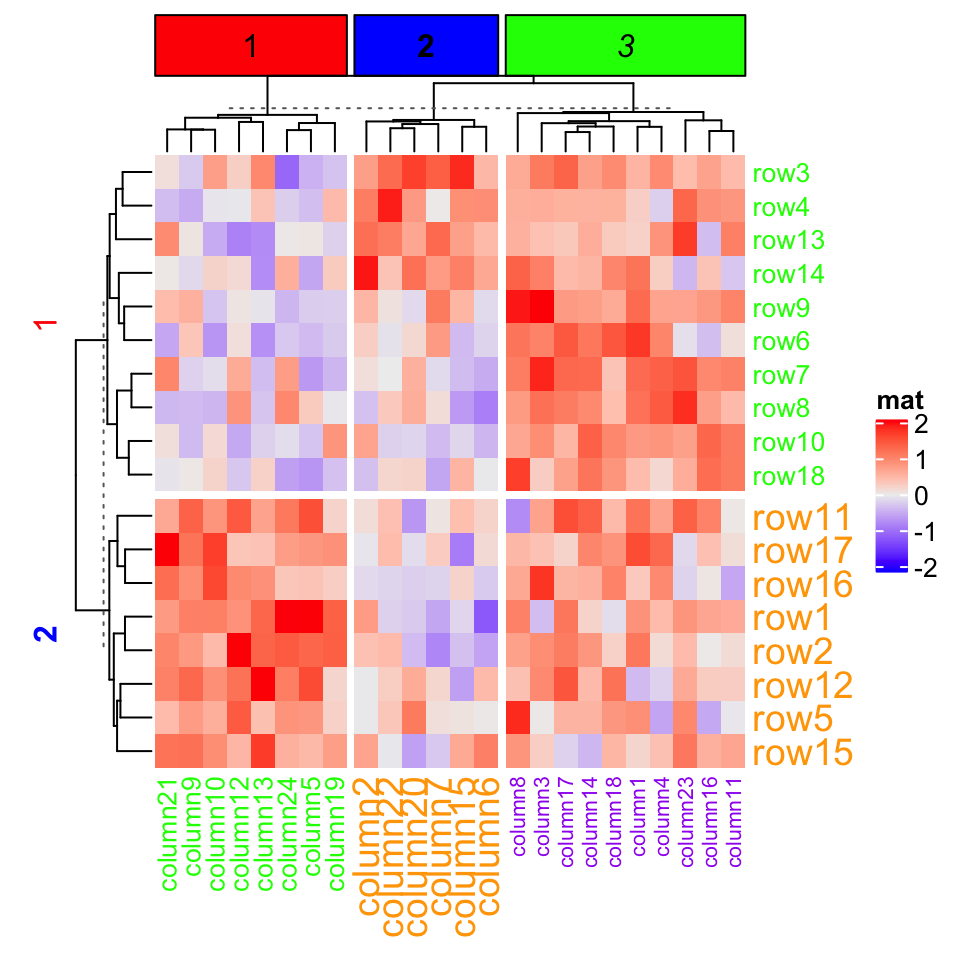
Heatmap(mat, name = "mat",row_km = 2, row_title_gp = gpar(col = c("red", "blue"), font = 1:2),row_names_gp = gpar(col = c("green", "orange"), fontsize = c(10, 14)),column_km = 3, column_title_gp = gpar(fill = c("red", "blue", "green"), font = 1:3),column_names_gp = gpar(col = c("green", "orange", "purple"), fontsize = c(10, 14, 8)))
2.7.7 切片之间的间距
2.7.7 Gaps between slices
**
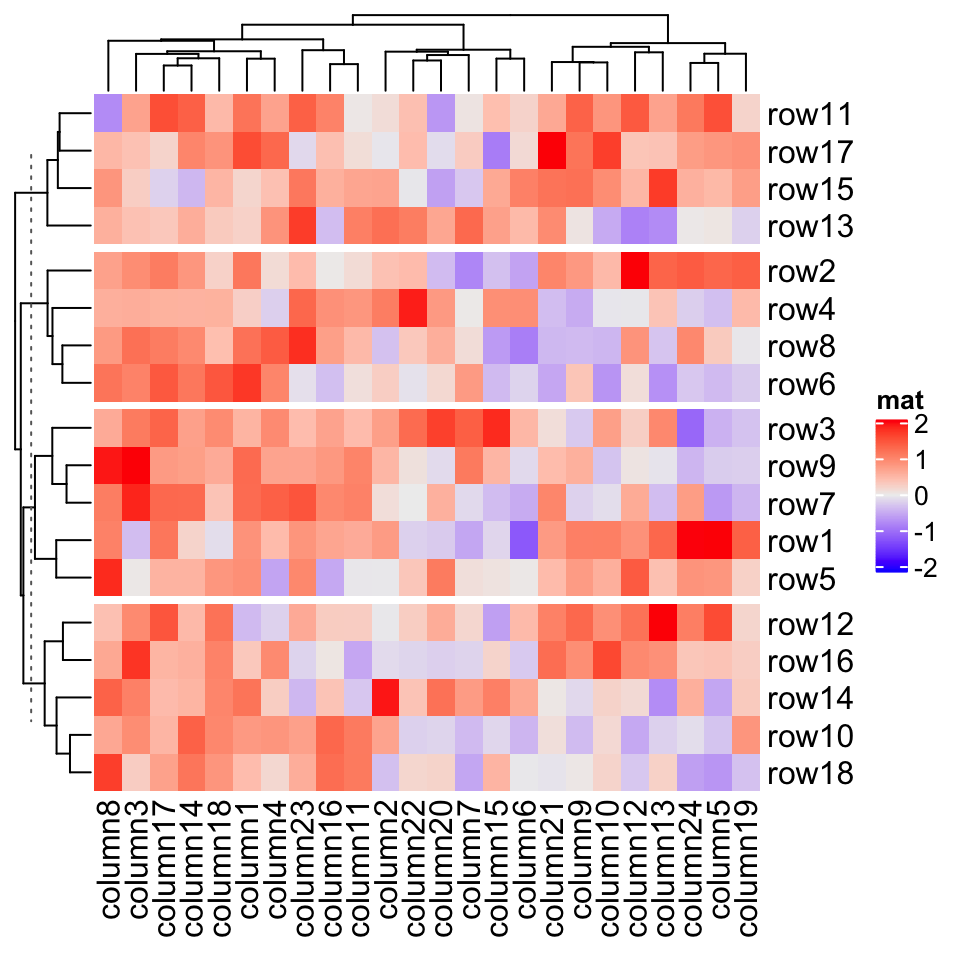
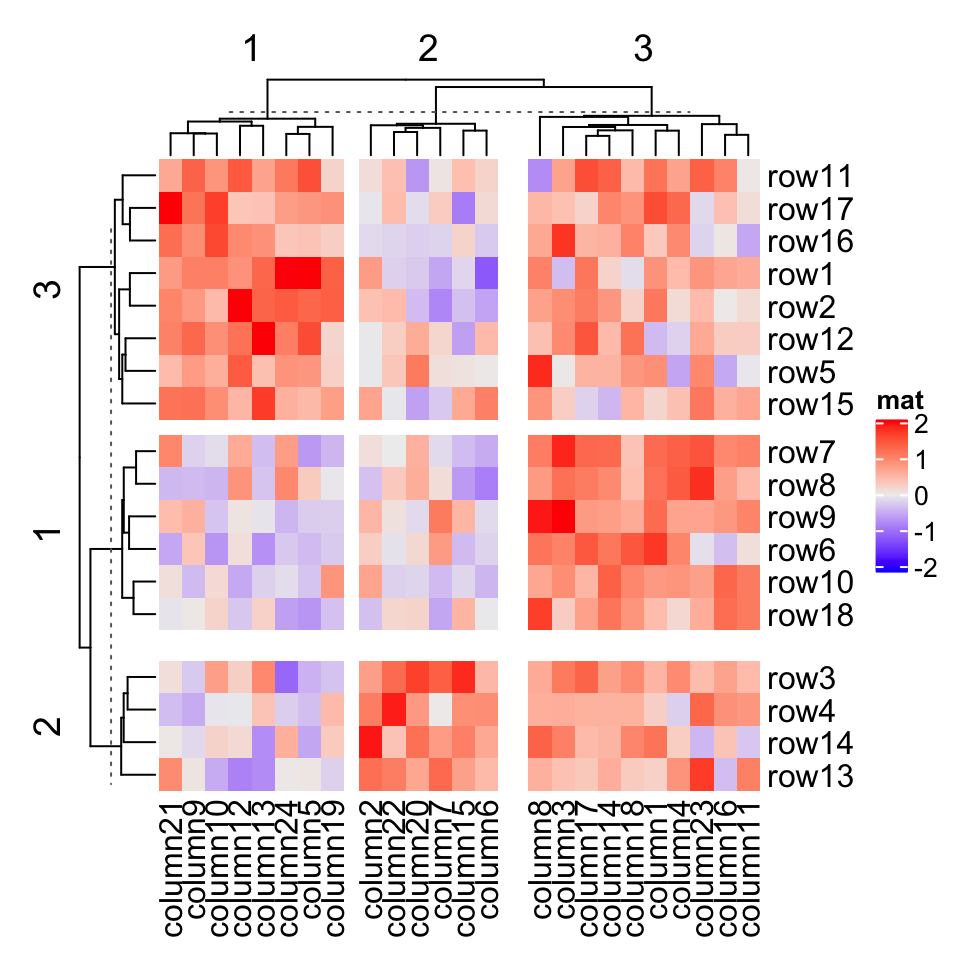
The space of gaps between row/column slices can be controlled by row_gap/column_gap. The value can be a single unit or a vector of units.
行/列切片之间的间隙空间可以由 row_gap / column_gap 控制。该值可以是单个单位或单位矢量。
Heatmap(mat, name = "mat", row_km = 3, row_gap = unit(5, "mm"))
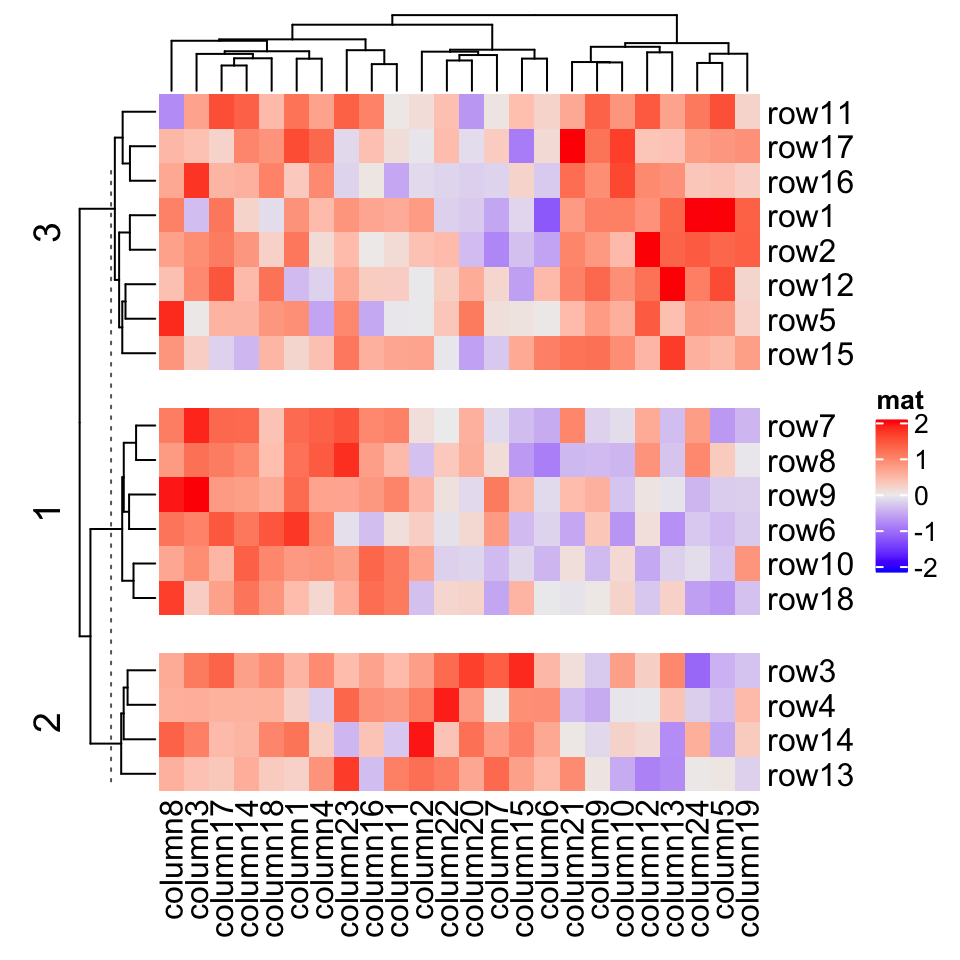
Heatmap(mat, name = "mat", row_km = 3, row_gap = unit(c(2, 4), "mm"))
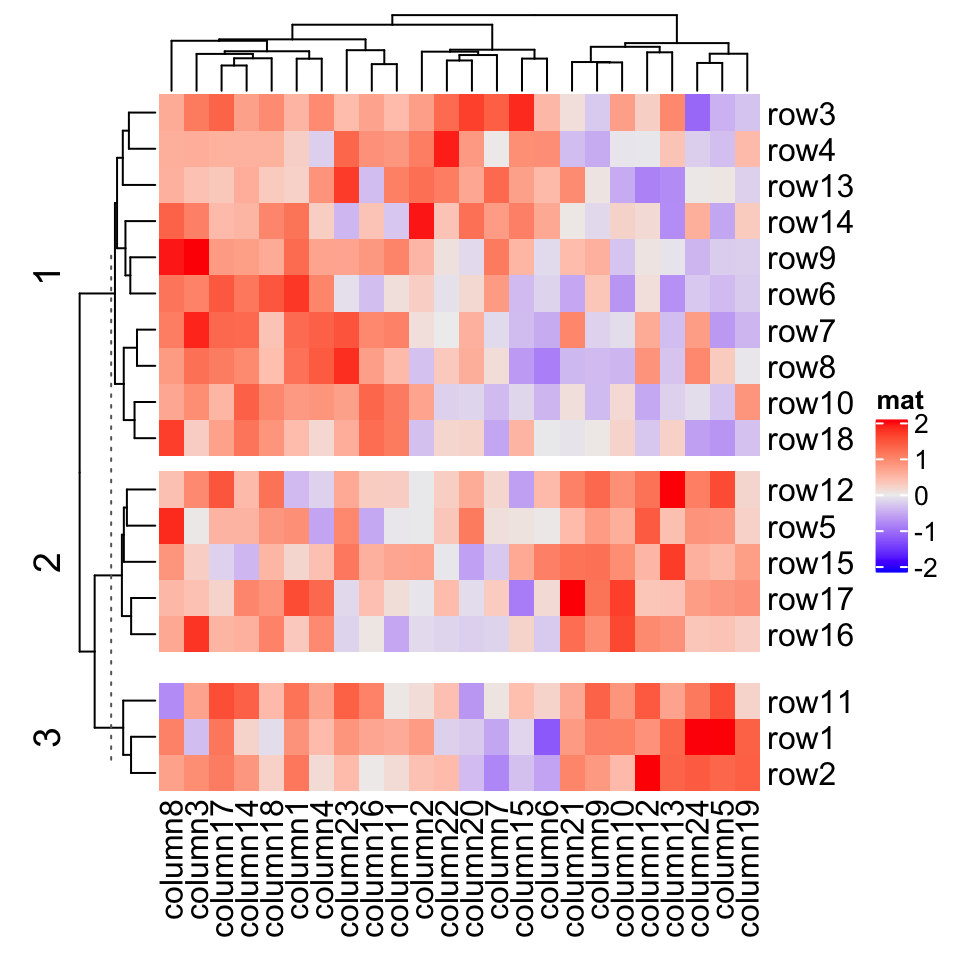
Heatmap(mat, name = "mat", row_km = 3, row_gap = unit(c(2, 4), "mm"),column_km = 3, column_gap = unit(c(2, 4), "mm"))
When heatmap border is added by setting border = TRUE, the border of every slice is added.
通过设置 border = TRUE 添加热图边框时,每个切片都会添加边框。
Heatmap(mat, name = "mat", row_km = 2, column_km = 3, border = TRUE)
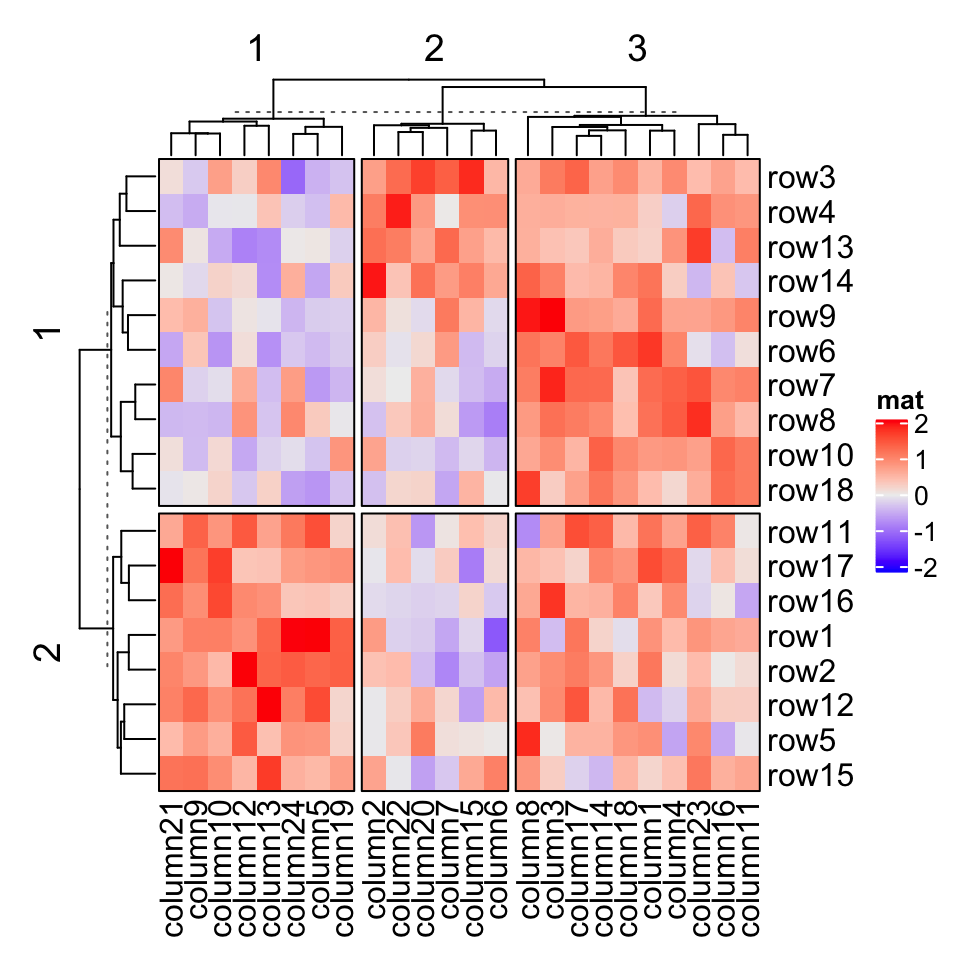
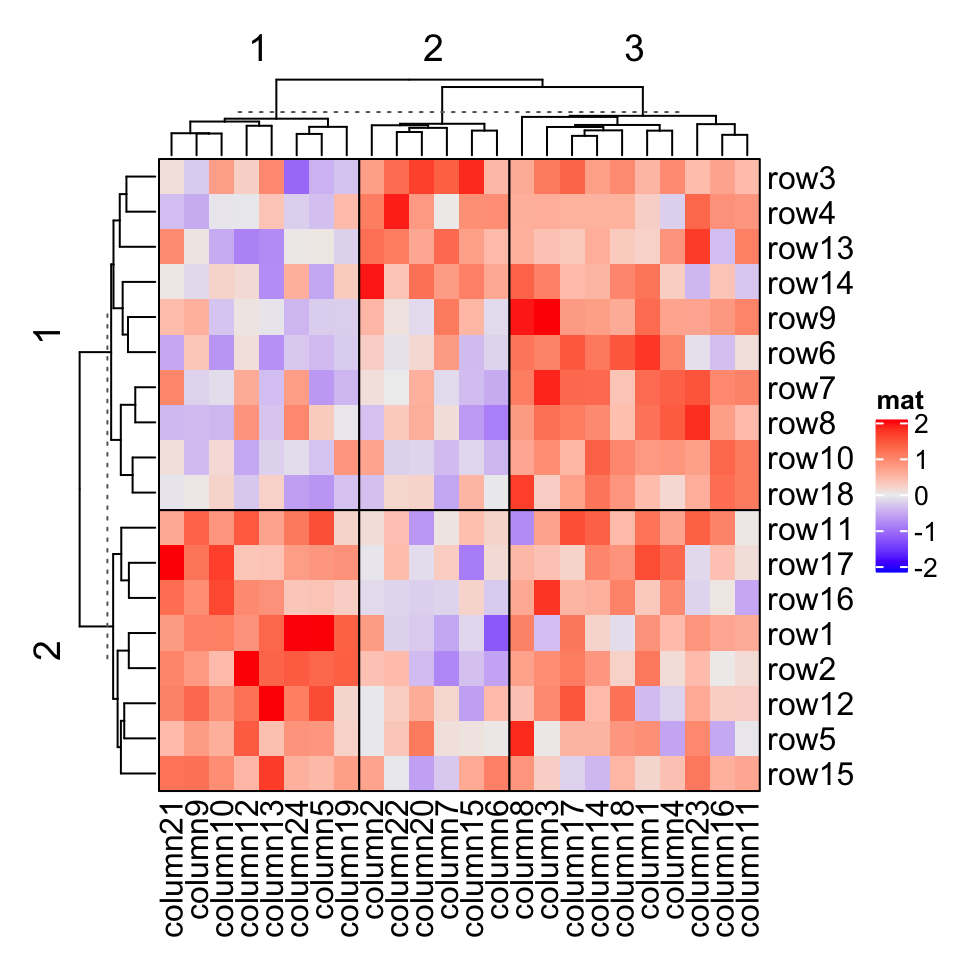
If you set gap size to zero, the heatmap will look like it is partitioned by vertical and horizontal lines.
如果将间大小设置为零,则热图将看起来像是由垂直和水平线分隔。
Heatmap(mat, name = "mat", row_km = 2, column_km = 3,row_gap = unit(0, "mm"), column_gap = unit(0, "mm"), border = TRUE)
2.7.8 拆分热图注释
2.7.8** Split heatmap annotations
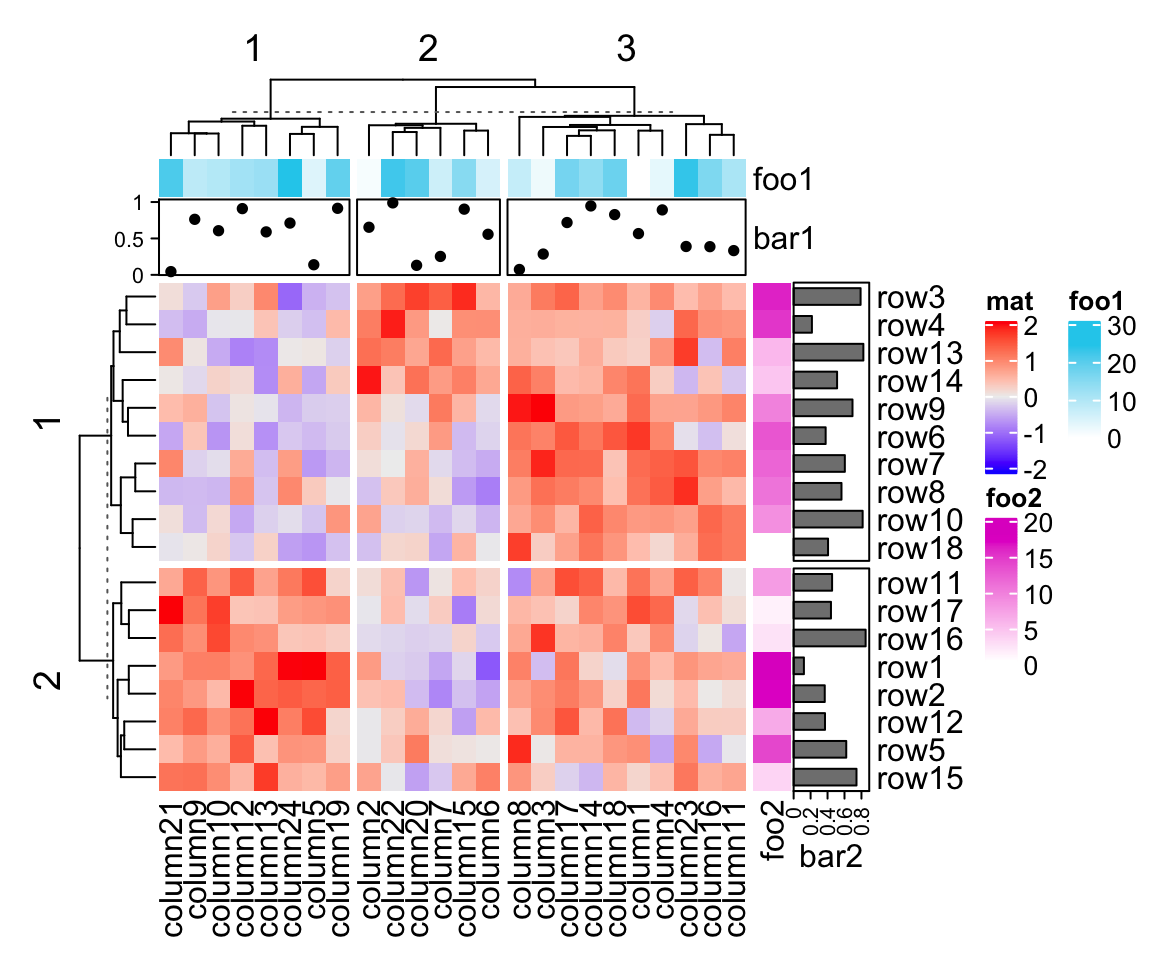
When the heatmap is split, all the heatmap components are split accordingly. Following gives you a simple example and the heatmap annotation will be introduced in Chapter 3.
分割热图时,会相应地拆分所有热图组件。下面给出一个简单的例子,热图注释将在第 3 章中介绍。
Heatmap(mat, name = "mat", row_km = 2, column_km = 3,top_annotation = HeatmapAnnotation(foo1 = 1:24, bar1 = anno_points(runif(24))),right_annotation = rowAnnotation(foo2 = 18:1, bar2 = anno_barplot(runif(18))))
—— 本节完(创建:2019-06-13) ——
