作者:Zuguang Gu8
编译:Steven Shen
原文:Adjust blank space caused by annotations
Heatmap annotations may have annotation names and axes, for which the spaces are also taken into account when arranging heatmap components in the final layout. Sometimes, this adjustment is not smart that you may see blank areas in the plot that are not necessary.
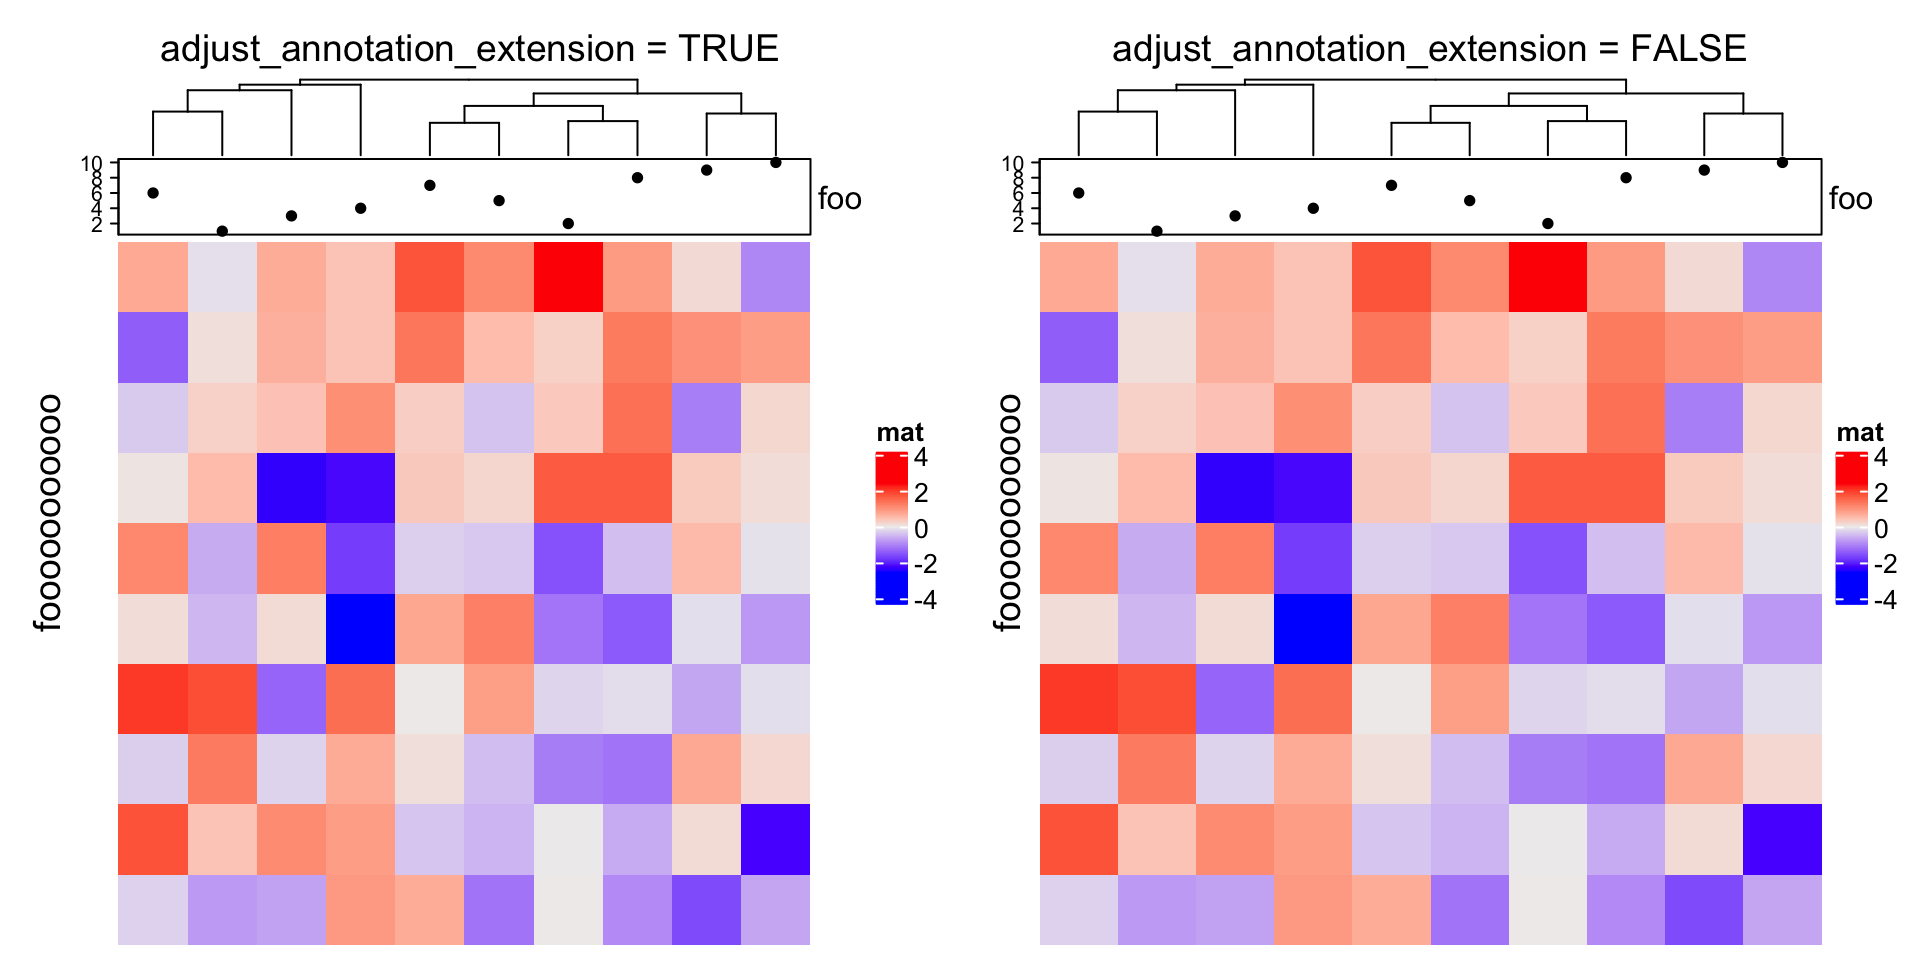
One scenario is for a matrix with no row names, the space to the right of the heatmap is determined by the size of annotation name, which results in blank space between the heatmap and the legend. Also the heatmap list level row title is plotted to the left of the annotation axis, which gives blank area if there is no row dendrogram.
adjust_annotation_extensioncontrols whether to take account of the space of annotation names and axes for the layout. Compare following two plots.
m = matrix(rnorm(100), 10)ht = Heatmap(m, name = "mat",top_annotation = HeatmapAnnotation(foo = anno_points(1:10)),show_row_dend = FALSE)draw(ht, row_title = "fooooooooooo", adjust_annotation_extension = TRUE, # defaultcolumn_title = "adjust_annotation_extension = TRUE")draw(ht, row_title = "fooooooooooo", adjust_annotation_extension = FALSE,column_title = "adjust_annotation_extension = FALSE")

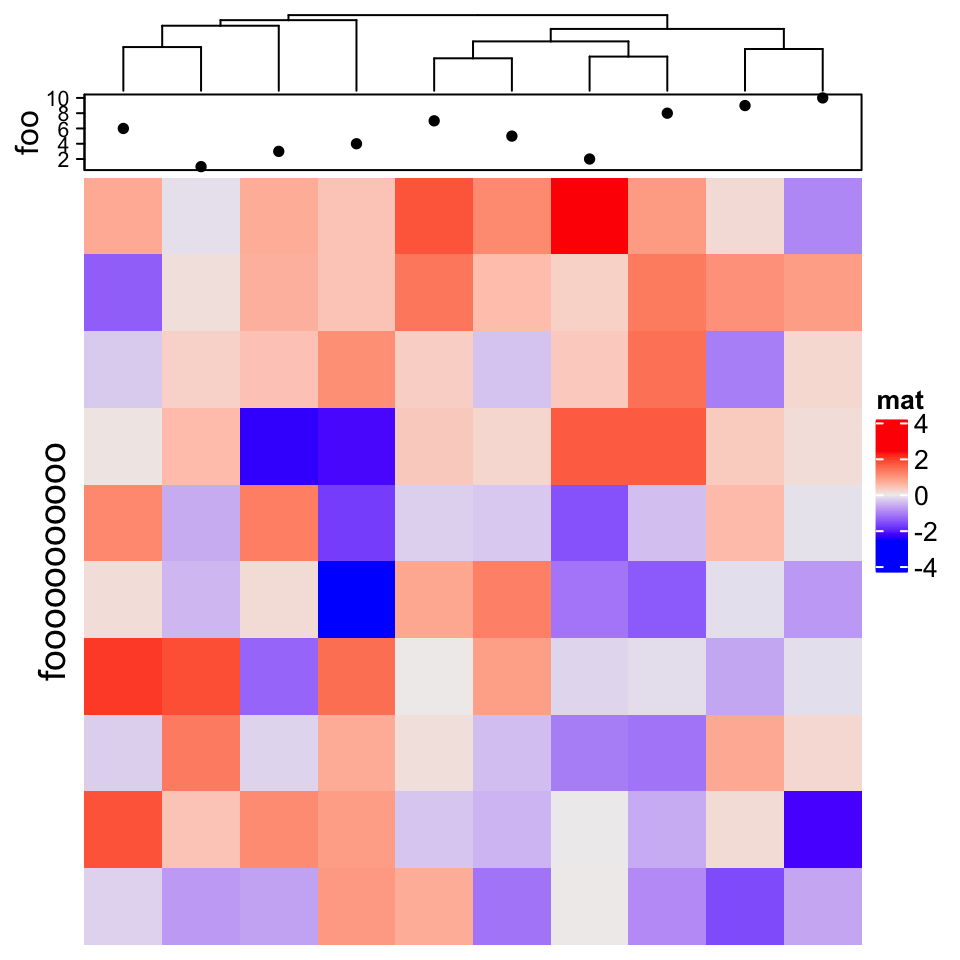
Another way to partially solve the space problem is to move the annotation name to the left and use heamtap-level row title.
Heatmap(m, name = "mat",top_annotation = HeatmapAnnotation(foo = anno_points(1:10),annotation_name_side = "left"),row_title = "fooooooooooo",show_row_dend = FALSE)

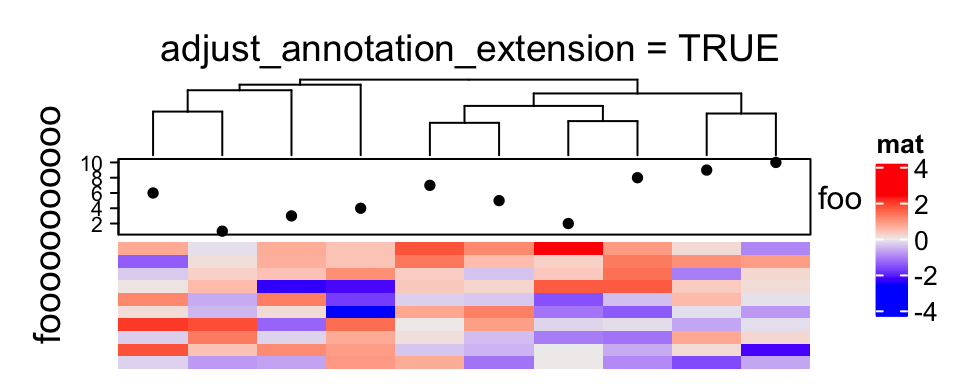
However, this adjustment for annotations sometimes is also necessary, e.g. when the heatmap is very short:
ht = Heatmap(m, name = "mat",top_annotation = HeatmapAnnotation(foo = anno_points(1:10)),show_row_dend = FALSE)draw(ht, row_title = "fooooooooooo", adjust_annotation_extension = TRUE,column_title = "adjust_annotation_extension = TRUE")

Therefore, we set
TRUEas the default ofadjust_annotation_extensionand users can configure it based on specific scenarios.

