作者:Zuguang Gu8
编译:Steven Shen
原文:Simple annotation as an annotation function
HeatmapAnnotation()supports “complex annotation” by setting the annotation as a function. The annotation function defines how to draw the graphics at a certain position corresponding to the column or row in the heatmap. There are quite a lot of annotation functions predefined in ComplexHeatmap package. In the end of this chapter, we will introduce how to construct your own annotation function by theAnnotationFunctionclass.For all the annotation functions in forms of
anno_*(), if it is specified inHeatmapAnnotation()orrowAnnotation(), you don’t need to do anything explicitly onanno_*()to tell whether it should be drawn on rows or columns.anno_*()automatically detects whether it is a row annotation environment or a column annotation environment.The simple annotation shown in previous section is internally constructed by
anno_simple()annotation function. Directly usinganno_simple()will not automatically generate legends for the final plot, but, it can provide more flexibility for more annotation graphics (note In Chapter 5 we will show, althoughanno_simple()cannot automatically generate the legends, the legends can be controlled and added to the final plot manually).For an example in previous section:
# code only for demonstrationha = HeatmapAnnotation(foo = 1:10)
is actually identical to:
# code only for demonstrationha = HeatmapAnnotation(foo = anno_simple(1:10))
anno_simple()makes heatmap-like annotations (or the simple annotations). Basically if users only make heatmap-like annotations, they do not need to directly useanno_simple(), but this function allows to add more symbols on the annotation grids.
anno_simple()allows to add “points” or single-letter symbols on top of the annotation grids.pch,pt_gpandpt_sizecontrol the settings of the points. The value ofpchcan be a vector with possibleNAvalues.
ha = HeatmapAnnotation(foo = anno_simple(1:10, pch = 1,pt_gp = gpar(col = "red"), pt_size = unit(1:10, "mm")))

Set
pchas a vector:
ha = HeatmapAnnotation(foo = anno_simple(1:10, pch = 1:10))

Set
pchas a vector of letters:
ha = HeatmapAnnotation(foo = anno_simple(1:10,pch = sample(letters[1:3], 10, replace = TRUE)))

Set
pchas a vector withNAvalues (nothing is drawn forNApch values):
ha = HeatmapAnnotation(foo = anno_simple(1:10, pch = c(1:4, NA, 6:8, NA, 10, 11)))

pchalso works if the value foranno_simple()is a matrix. The length ofpchshould be as same as the number of matrix rows or columns or even the length of the matrix (the length of the matrix is the length of all data points in the matrix).Length of
pchcorresponds to matrix columns:
ha = HeatmapAnnotation(foo = anno_simple(cbind(1:10, 10:1), pch = 1:2))

Lenght of
pchcorresponds to matrix rows:
ha = HeatmapAnnotation(foo = anno_simple(cbind(1:10, 10:1), pch = 1:10))

pchis a matrix:
pch = matrix(1:20, nc = 2)pch[sample(length(pch), 10)] = NAha = HeatmapAnnotation(foo = anno_simple(cbind(1:10, 10:1), pch = pch))

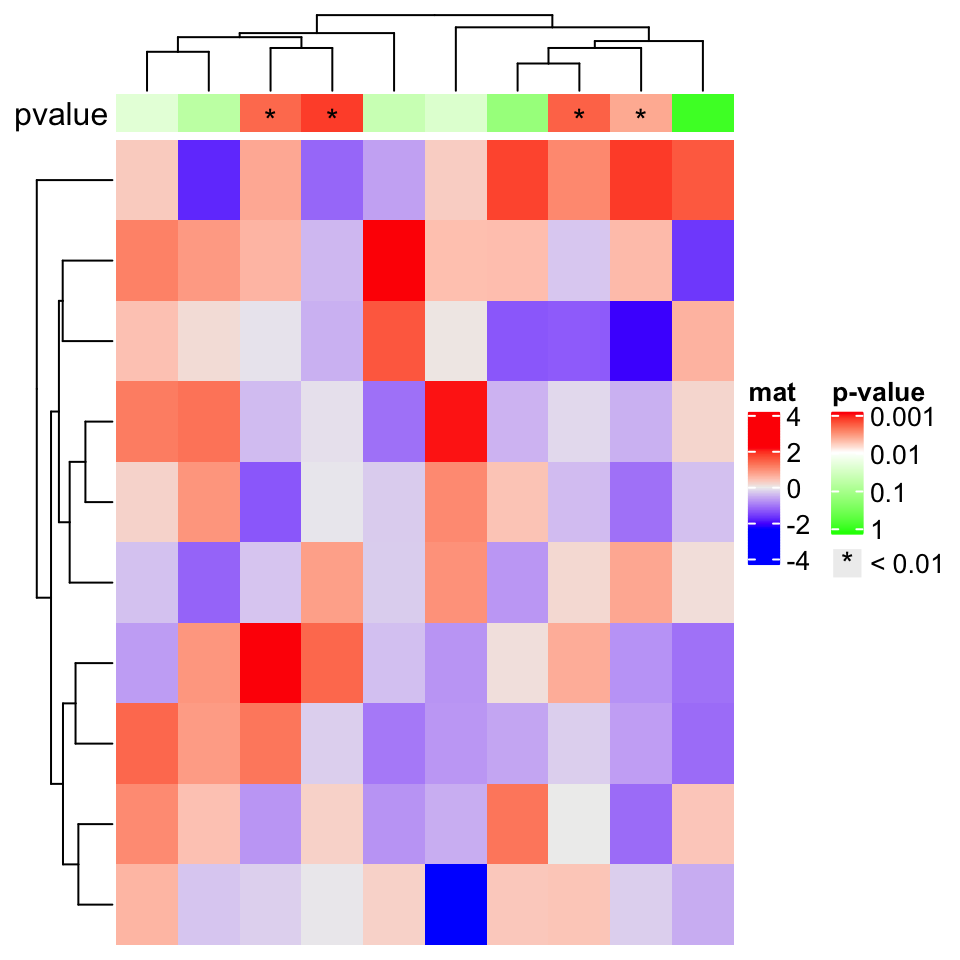
Till now, you might wonder how to set the legends of the symbols you’ve added to the simple annotations. Here we will only show you a simple example and this functionality will be discussed in Chapter 5. In following example, we assume the simple annotations are kind of p-values and we add
*for p-values less than 0.01.
set.seed(123)pvalue = 10^-runif(10, min = 0, max = 3)is_sig = pvalue < 0.01pch = rep("*", 10)pch[!is_sig] = NA# color mapping for -log10(pvalue)pvalue_col_fun = colorRamp2(c(0, 2, 3), c("green", "white", "red"))ha = HeatmapAnnotation(pvalue = anno_simple(-log10(pvalue), col = pvalue_col_fun, pch = pch),annotation_name_side = "left")ht = Heatmap(matrix(rnorm(100), 10), name = "mat", top_annotation = ha)# now we generate two legends, one for the p-value# see how we define the legend for pvaluelgd_pvalue = Legend(title = "p-value", col = pvalue_col_fun, at = c(0, 1, 2, 3),labels = c("1", "0.1", "0.01", "0.001"))# and one for the significant p-valueslgd_sig = Legend(pch = "*", type = "points", labels = "< 0.01")# these two self-defined legends are added to the plot by `annotation_legend_list`draw(ht, annotation_legend_list = list(lgd_pvalue, lgd_sig))

The height of the simple annotation can be controled by
heightargument orsimple_anno_sizeinsideanno_simple().simple_anno_sizecontrols the size for single-row annotation andheight/widthcontrols the total height/width of the simple annotations. Ifheight/widthis set,simple_anno_sizeis ignored.
ha = HeatmapAnnotation(foo = anno_simple(1:10, height = unit(2, "cm")))

ha = HeatmapAnnotation(foo = anno_simple(cbind(1:10, 10:1),
    simple_anno_size = unit(2, "cm")))

For all the annotation functions we introduce later, the height or the width for individual annotations should all be set inside the
anno_*()functions.
# code only for demonstration
anno_*(..., width = ...)
anno_*(..., height = ...)
Again, the
width,height,annotation_widthandannotation_heightarguments inHeatmapAnnotation()are used to adjust the size of multiple annotations.

