作者:Zuguang Gu
版本:last revised on 2019-06-08
翻译:Steven
原文:https://jokergoo.github.io/ComplexHeatmap-reference/book/a-single-heatmap.html#dimension-names
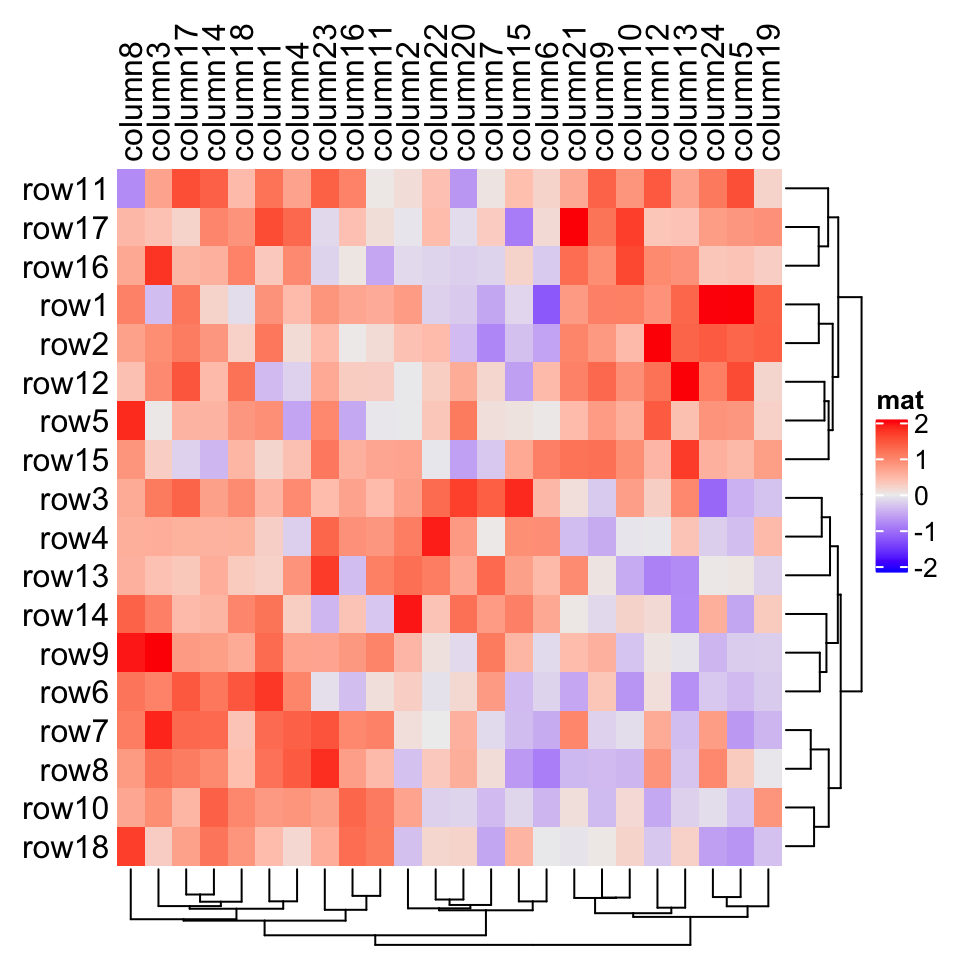
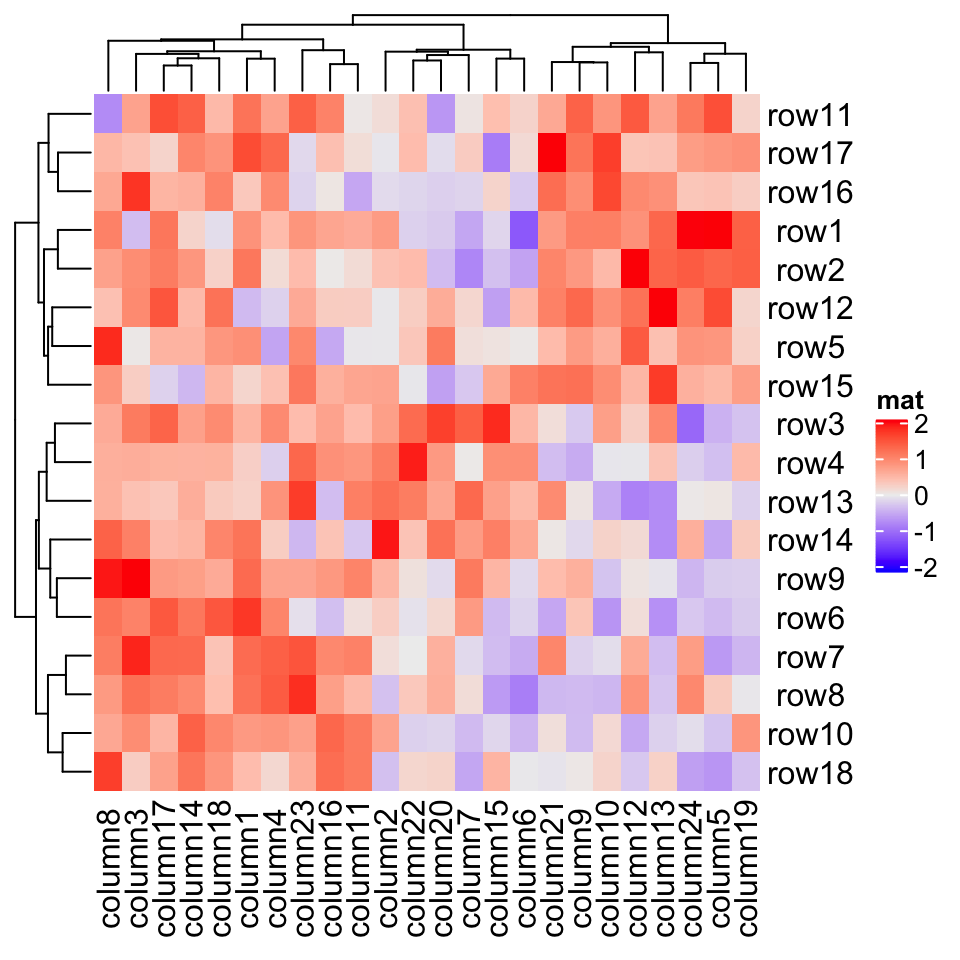
The row names and column names are drawn on the right and bottom sides of the heatmap by default. Side, visibility and graphic parameters for dimension names can be set as follows:
默认情况下,行名称和列名称在热图的右侧和底部绘制。维名称所在的边,可见性和图形参数可以设置如下:
Heatmap(mat, name = "mat", row_names_side = "left", row_dend_side = "right",column_names_side = "top", column_dend_side = "bottom")
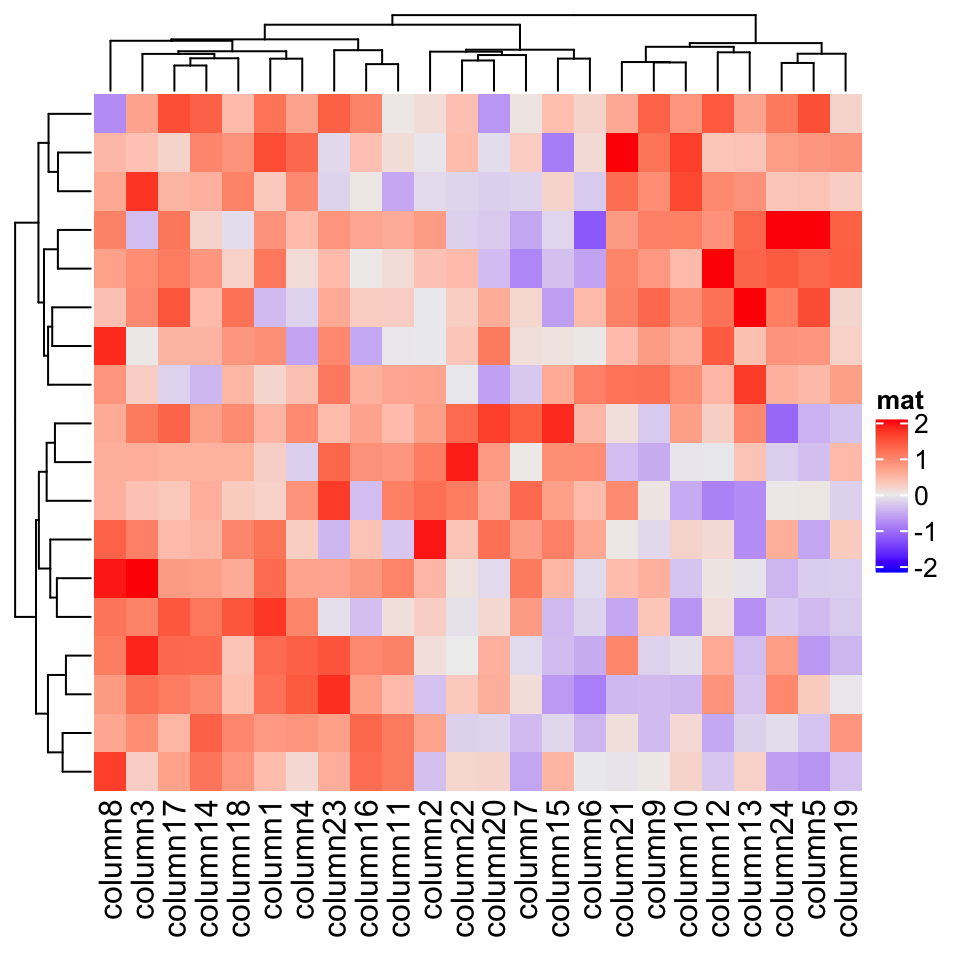
Heatmap(mat, name = "mat", show_row_names = FALSE)
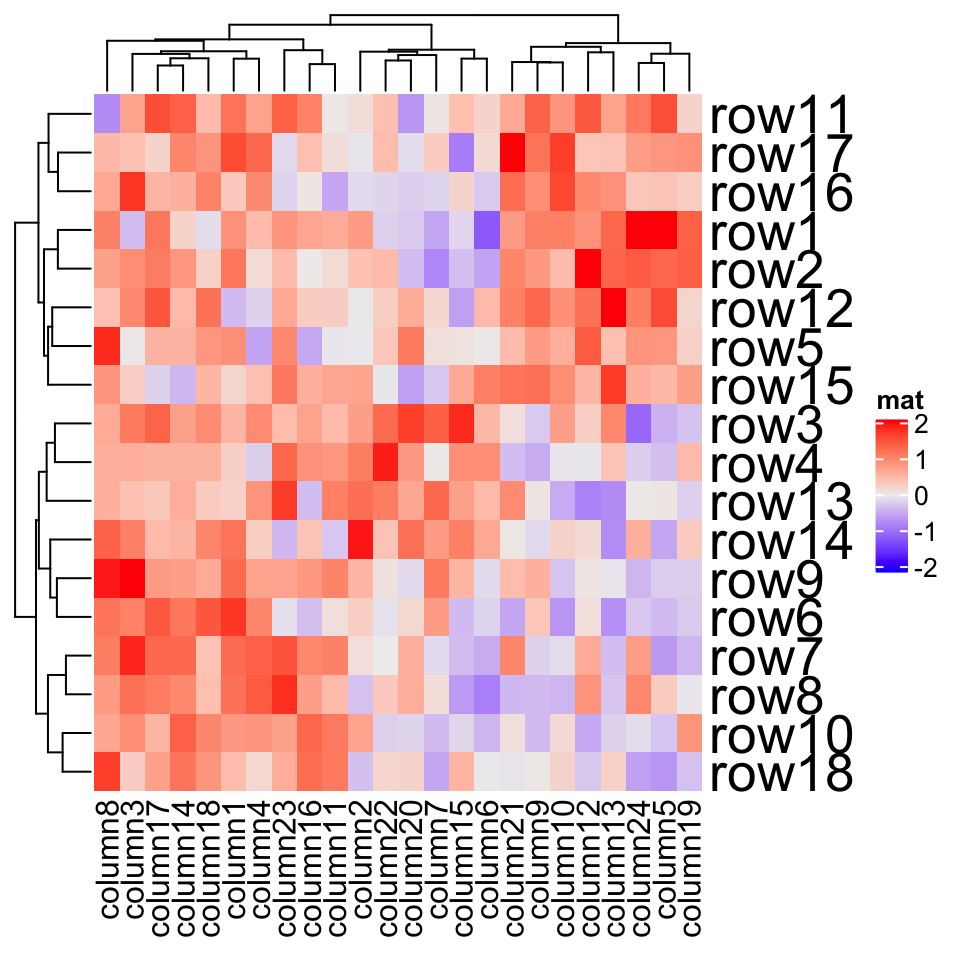
Heatmap(mat, name = "mat", row_names_gp = gpar(fontsize = 20))
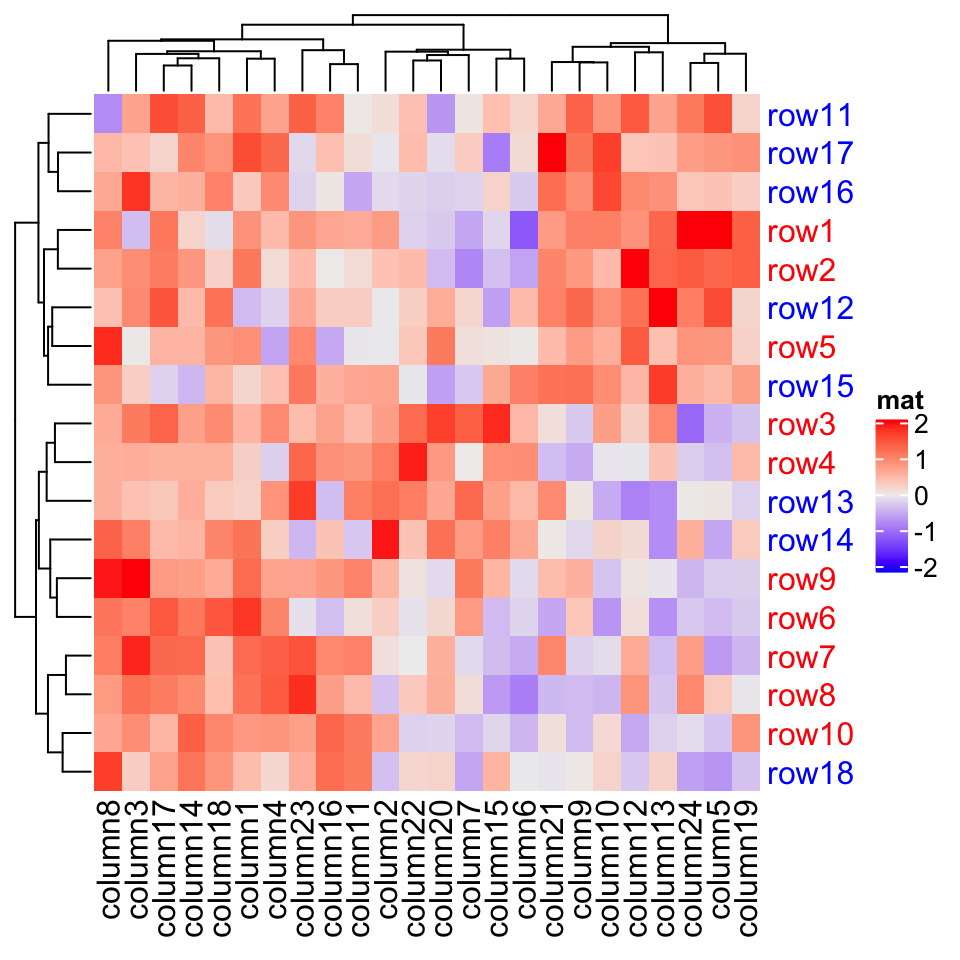
Heatmap(mat, name = "mat", row_names_gp = gpar(col = c(rep("red", 10), rep("blue", 8))))
Heatmap(mat, name = "mat", row_names_centered = TRUE, column_names_centered = TRUE)
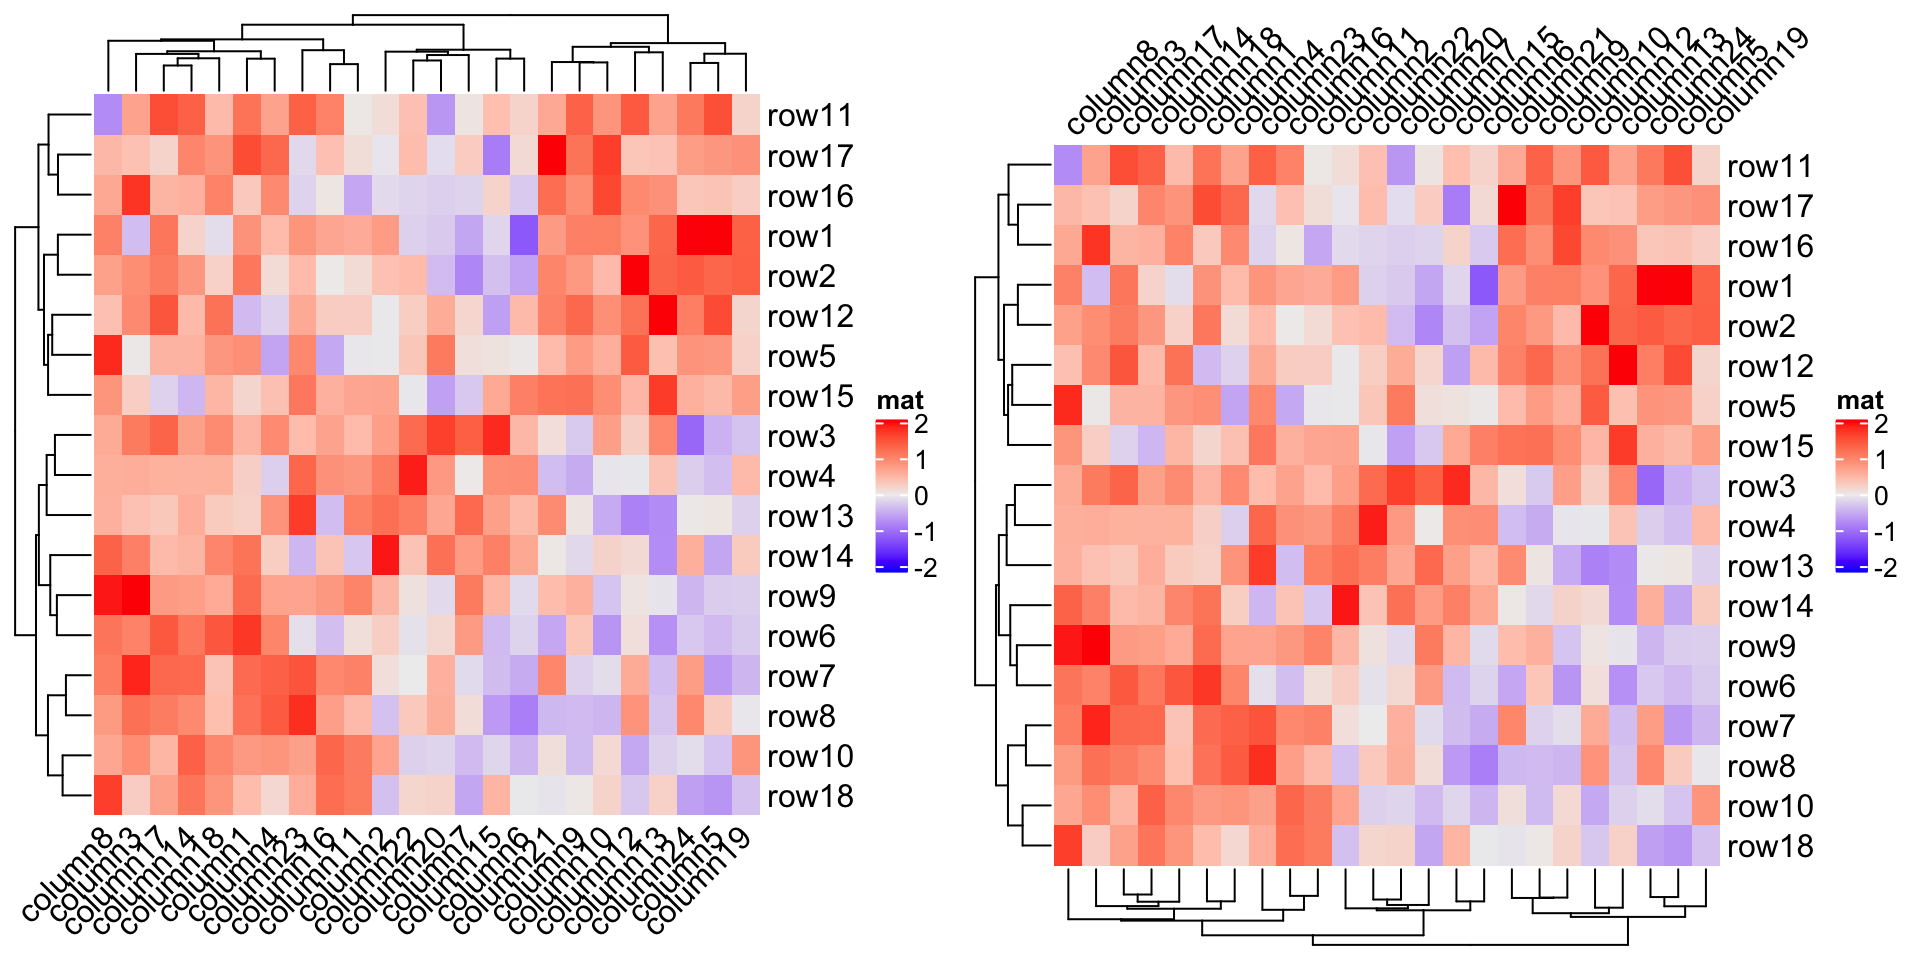
The rotation of column names can be set by column_names_rot:
列名称的旋转可以通过 column_names_rot 设置:
Heatmap(mat, name = "mat", column_names_rot = 45)Heatmap(mat, name = "mat", column_names_rot = 45, column_names_side = "top",column_dend_side = "bottom")
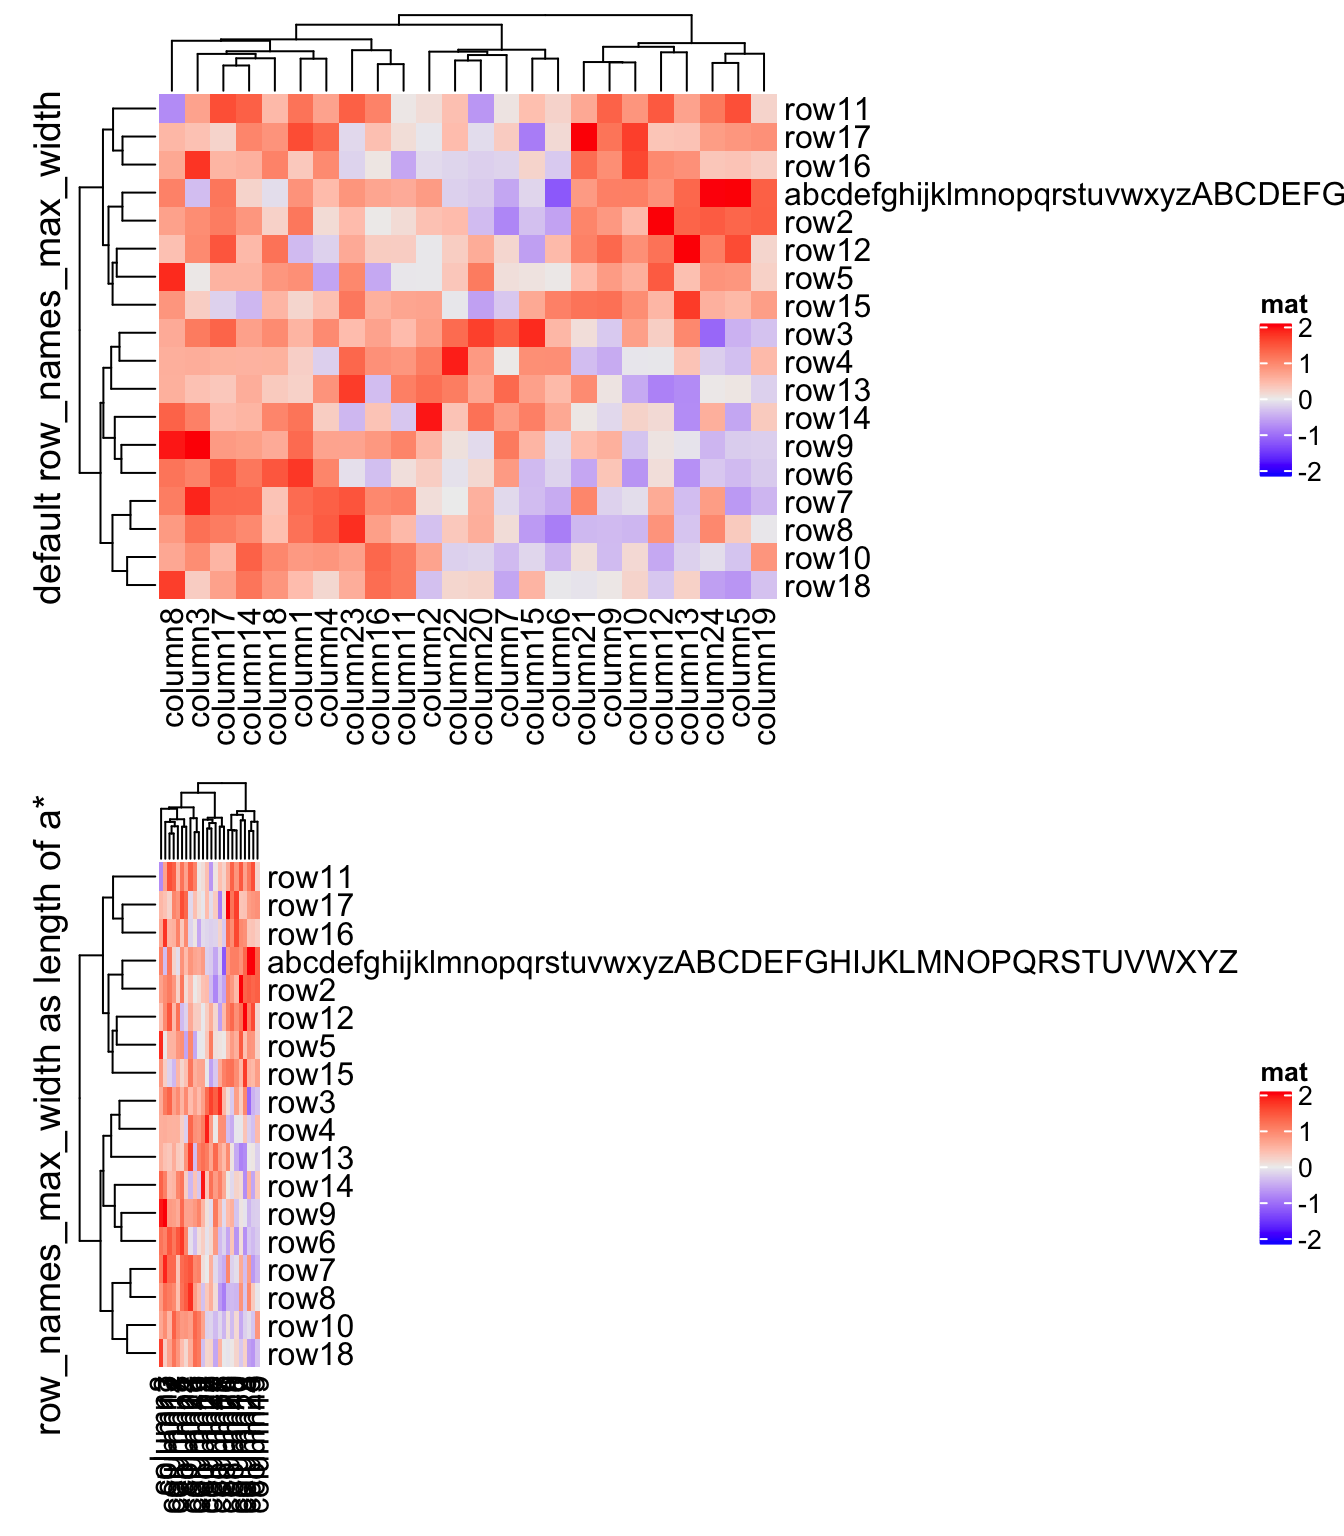
If you have row names or column names which are too long, row_names_max_width or column_names_max_height can be used to set the maximal space for them. The default maximal space for row names and column names are all 6 cm. In following code, max_text_width() is a helper function to quick calculate maximal width from a vector of text.
如果行名称或列名太长,可以使用 row_names_max_width 或 column_names_max_height 为它们设置最大空间。 行名和列名的默认最大空间均为 6 厘米。在下面的代码中, max_text_width() 是一个辅助函数,可以快速计算文本向量的最大宽度。
mat2 = matrownames(mat2)[1] = paste(c(letters, LETTERS), collapse = "")Heatmap(mat2, name = "mat")Heatmap(mat2, name = "mat",row_names_max_width = max_text_width(rownames(mat2),gp = gpar(fontsize = 12)))
Instead of directly using the row/column names from the matrix, you can also provide another character vector which corresponds to the rows or columns and set it by row_labels or column_labels. This is useful because you don’t need to change the dimension names of the matrix to change the labels on the heatmap while you can directly provide the new labels.
您也可以提供另一个与行或列对应的字符向量,并通过 row_labels 或 column_labels 设置,而不是直接使用矩阵中的行/列名称。这很有用,因为您无需更改矩阵的尺寸名称即可更改热图上的标签,同时可以直接提供新标签。
There is one typical scenario that row_labels and column_labels are useful. For the gene expression analysis, we might use Ensembl ID as the gene ID which is used as row names of the gene expression matrix. However, the Ensembl ID is for the indexing of the Ensembl database but not for the human reading. Instead, we would prefer to put gene symbols on the heatmap as the row names which is easier to read. To do this, we only need to assign the corresponding gene symbols to row_labels without modifying the original matrix.
有一种典型的情况很适合 row_labels 和 column_labels 的使用。对于基因表达分析,我们可能使用 Ensembl ID 作为基因 ID,这些 ID 可以用作基因表达矩阵的行名。但是,Ensembl ID 用于 Ensembl 数据库的索引,但不用于人类阅读。相反,我们更倾向于将热图上的基因符号作为更容易阅读的行名称。为此,我们只需要将相应的基因符号分配给 row_labels 而不修改原始矩阵。
The second advantage is row_labels or column_labels allows duplicated labels, while duplicated row names or column names are not allowed in the matrix.
第二个优点是 row_labels 或 column_labels 允许重复的标签,而矩阵中不允许重复的行名称或列名称。
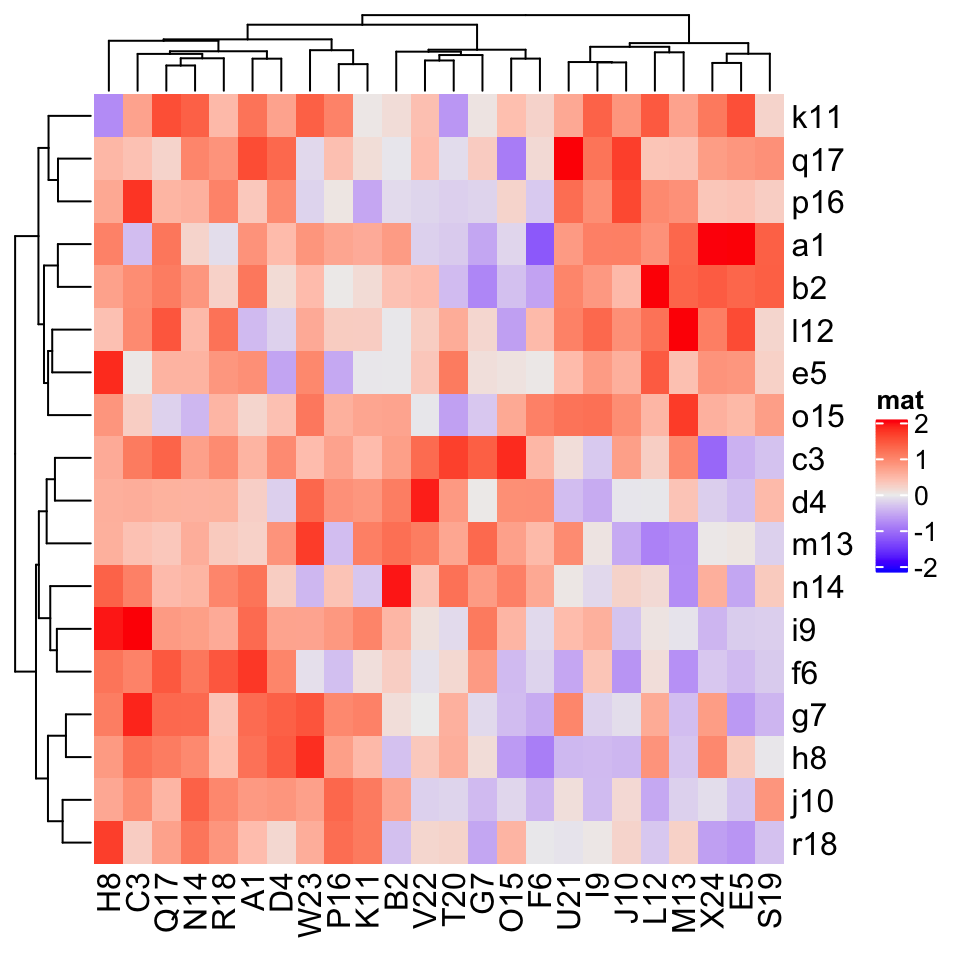
Following gives a simple example that we put letters as row labels and column labels:
下面给出了一个简单的例子,我们将字母作为行标签和列标签:
# use a named vector to make sure the correspondance between# row names and row labels is correctrow_labels = structure(paste0(letters[1:24], 1:24), names = paste0("row", 1:24))column_labels = structure(paste0(LETTERS[1:24], 1:24), names = paste0("column", 1:24))row_labels## row1 row2 row3 row4 row5 row6 row7 row8 row9 row10 row11 row12## "a1" "b2" "c3" "d4" "e5" "f6" "g7" "h8" "i9" "j10" "k11" "l12"## row13 row14 row15 row16 row17 row18 row19 row20 row21 row22 row23 row24## "m13" "n14" "o15" "p16" "q17" "r18" "s19" "t20" "u21" "v22" "w23" "x24"
Heatmap(mat, name = "mat", row_labels = row_labels[rownames(mat)],column_labels = column_labels[colnames(mat)])
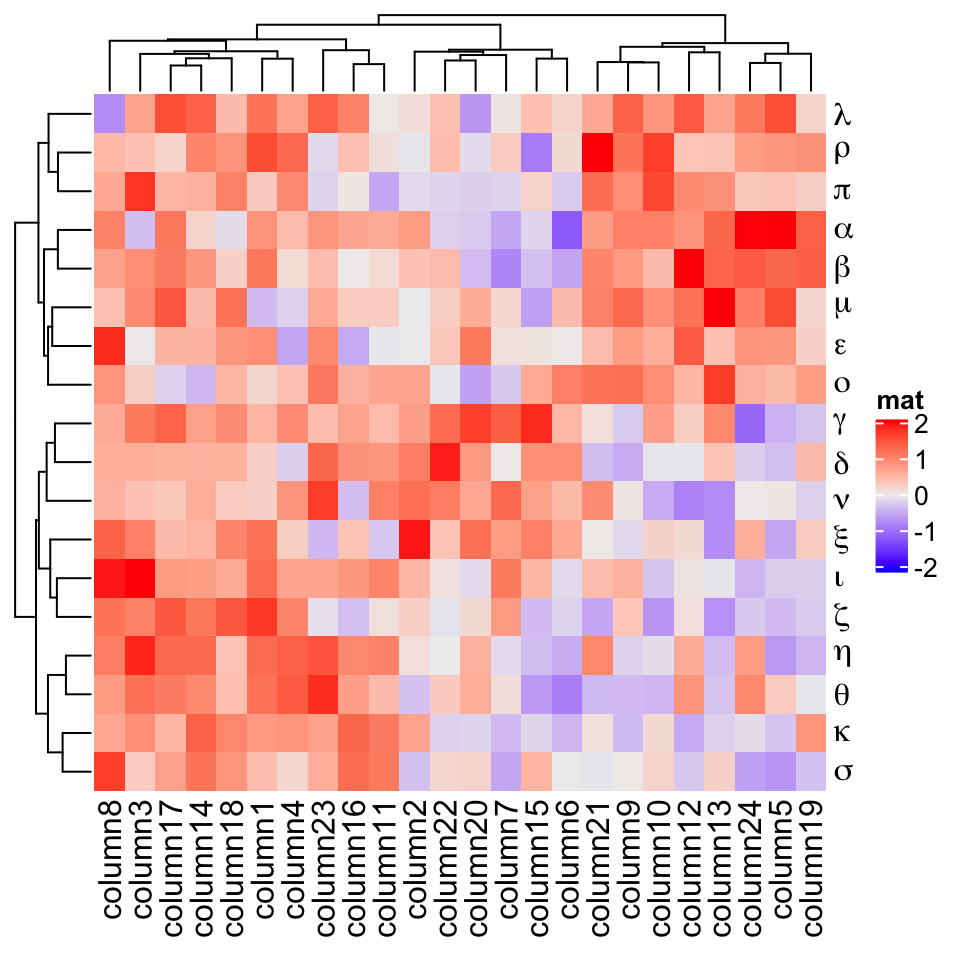
The third advantage is mathematical expression can be used as row names in the heatmap.
第三个优点是数学表达式可以用作热图中的行名。
Heatmap(mat, name = "mat", row_labels = expression(alpha, beta, gamma, delta, epsilon,zeta, eta, theta, iota, kappa, lambda, mu, nu, xi, omicron, pi, rho, sigma))
anno_text() (Section 3.14) can be used to add more customized labels for heatmap rows and columns.anno_text() (第 3.14 节)可用于为热图行和列添加更多自定义标签。
—— 本节完 ——

