图例
图例(legend)是图表的辅助元素,使用颜色、大小、形状区分不同的数据类型,用于图表中数据的筛选。G2 会根据设置图形属性映射以及数据的类型自动生成不同的图例。
shape, color, size 这三个图形属性如果判断接收的参数是数据源的字段时,会自动生成不同的图例;
shape 属性,会根据不同的 shape 类型生成图例;
color 属性, 会赋予不同的图例项不同的颜色来区分图形;
size 属性, 在图例上显示图形的大小。
通过 chart.legend([field, ]false) 可以关闭图例。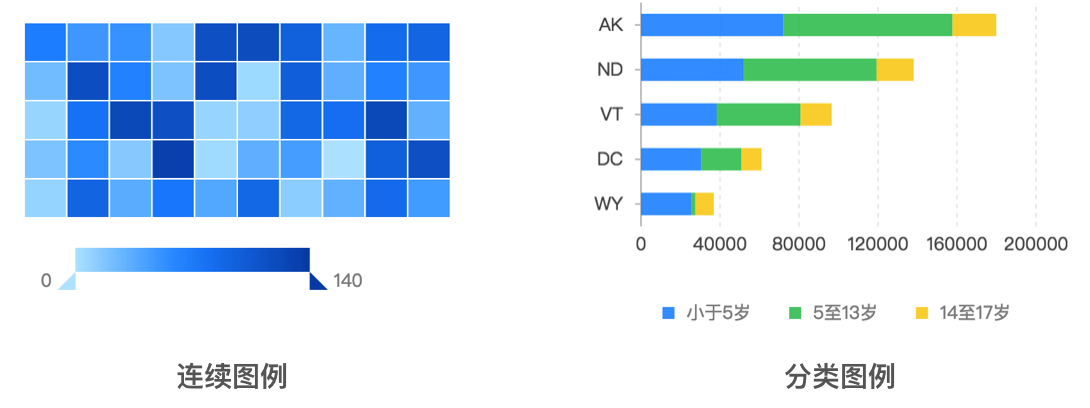
如何配置图例
调用 chart.legend() 进行图例的配置,使用方法如下所示:
chart.legend({position: 'bottom', // 设置图例的显示位置itemGap: 20 // 图例项之间的间距});chart.legend('cut', false); // 不显示 cut 字段对应的图例chart.legend('price', {title: null // 不展示图例 title});chart.legend(false); //所有的图例都不显示
图例整体样式设置
| 属性名 | 解释 | 默认值 |
|---|---|---|
| position | 图例的显示位置,支持12个定位位置,配置值 ‘left-top’,’left-center’,’left-bottom’,’right-top’,’right-top’,’right-bottom’,’top-left’,’top-center’,’top-bottom’,’bottom-left’,’bottom-center’,’bottom-right’。也可使用’left’(默认为left-bottom’),’right’(默认为’right-bottom’),’top’(默认为top-center’),’bottom’(默认为bottom-center’)定位。 | ‘bottom-center’ |
| title | 用于图例标题的显示样式配置,如果值为 null 则不展示。 | 左右两侧图例默认展示标题,上下图例默认不展示标题 |
| background | 用于图例背景色的配置 | 默认没有背景色 |
| offsetX | 整个图例的水平偏移距离 | — |
| offsetY | 整个图例的垂直偏移距离 | — |
| width | 图例的整体宽度(用于连续图例) | 20 |
| height | 图例的整体高度(用于连续图例) | 156 |
| autoWrap | 图例项过多时是否自动换行(用于分类图例) | true,自动换行 |
| marker | 配置图例 marker 的显示样式,支持指定 point 几何标记支持的所有 shape(除去 ‘rect’):’circle’, ‘square’, ‘bowtie’, ‘diamond’, ‘hexagon’, ‘triangle’, ‘triangle-down’, ‘hollowCircle’, ‘hollowSquare’, ‘hollowBowtie’, ‘hollowDiamond’, ‘hollowHexagon’, ‘hollowTriangle’, ‘hollowTriangle-down’, ‘cross’, ‘tick’, ‘plus’, ‘hyphen’, ‘line’ |
不同的几何标记不同的 marker |
| attachLast | 是否启用尾部跟随图例(适用于line、lineStack、area、areaStack图表类型) |
false |
| clickable | 图例项是否可以点击 | true |
| hoverable | 是否默认开启鼠标 hover 到图例项上的交互 | true |
| selectedMode | clickable 为 true 时生效,图例的选中模式,单选或者多选 | ‘multiple’ 默认多选 |
| onHover | 自定义图例项鼠标 hover 事件,hoverable 为 false 不生效 | — |
| onClick | 自定义图例项点击事件, clickable 为 false 不生效 | — |
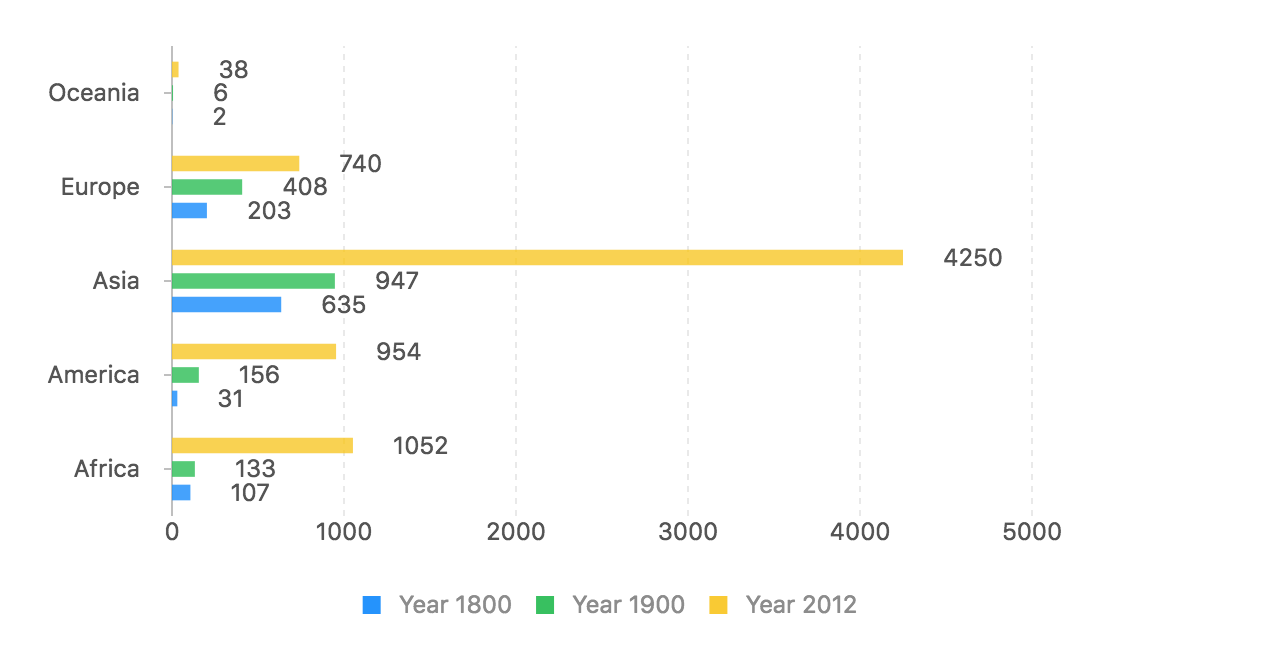
const data = [{ year: 'Year 1800', region: 'Africa', population: 107 },{ year: 'Year 1900', region: 'Africa', population: 133 },{ year: 'Year 2012', region: 'Africa', population: 1052 },{ year: 'Year 1800', region: 'America', population: 31 },{ year: 'Year 1900', region: 'America', population: 156 },{ year: 'Year 2012', region: 'America', population: 954 },{ year: 'Year 1800', region: 'Asia', population: 635 },{ year: 'Year 1900', region: 'Asia', population: 947 },{ year: 'Year 2012', region: 'Asia', population: 4250 },{ year: 'Year 1800', region: 'Europe', population: 203 },{ year: 'Year 1900', region: 'Europe', population: 408 },{ year: 'Year 2012', region: 'Europe', population: 740 },{ year: 'Year 1800', region: 'Oceania', population: 2 },{ year: 'Year 1900', region: 'Oceania', population: 6 },{ year: 'Year 2012', region: 'Oceania', population: 38 }];const chart = new G2.Chart({container: 'legendMarker',width: 600,height: 350,padding: [ 20, 90, 95, 80 ]});chart.source(data);chart.coord().transpose();chart.legend({title: null, // 不展示图例的标题marker: 'square' // 设置图例 marker 的显示样式});chart.intervalDodge().position('region*population').color('year').label('population');chart.render();
各个图例项样式设置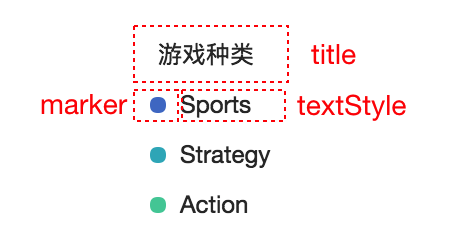
| 属性名 | 解释 | 默认值 |
|---|---|---|
| allowAllCanceled | (分类图例)是否保留一项不能取消勾选,默认为 false,即最后一项不能取消勾选 | false |
| unCheckColor | 未选中时marker的颜色 | ‘#bfbfbf’ |
| textStyle | 图例项文本的样式配置 | {fill: ‘#3c3c3c’} |
| itemWidth | 图例项的宽度,当图例有很多图例项,并且用户想要这些图例项在同一平面内垂直对齐,此时这个属性可帮用户实现此效果 | — |
| itemFormatter | 用于格式化图例每项的文本显示,是个回调函数 | — |
图例的选择模式设置
在 G2 中,图例分为两种:
分类图例;
连续图例。
对于分类图例的筛选,G2 提供了三种方式:
selectedMode: 'multiple'多选,默认配置;selectedMode: 'single'单选;clickable: false禁用筛选。
对于连续图例,声明 slidable: false 关闭筛选操作,默认开启筛选操作。
通过如下代码即可进行配置:
// 对分类图例进行配置chart.legend({selectedMode: 'single'});
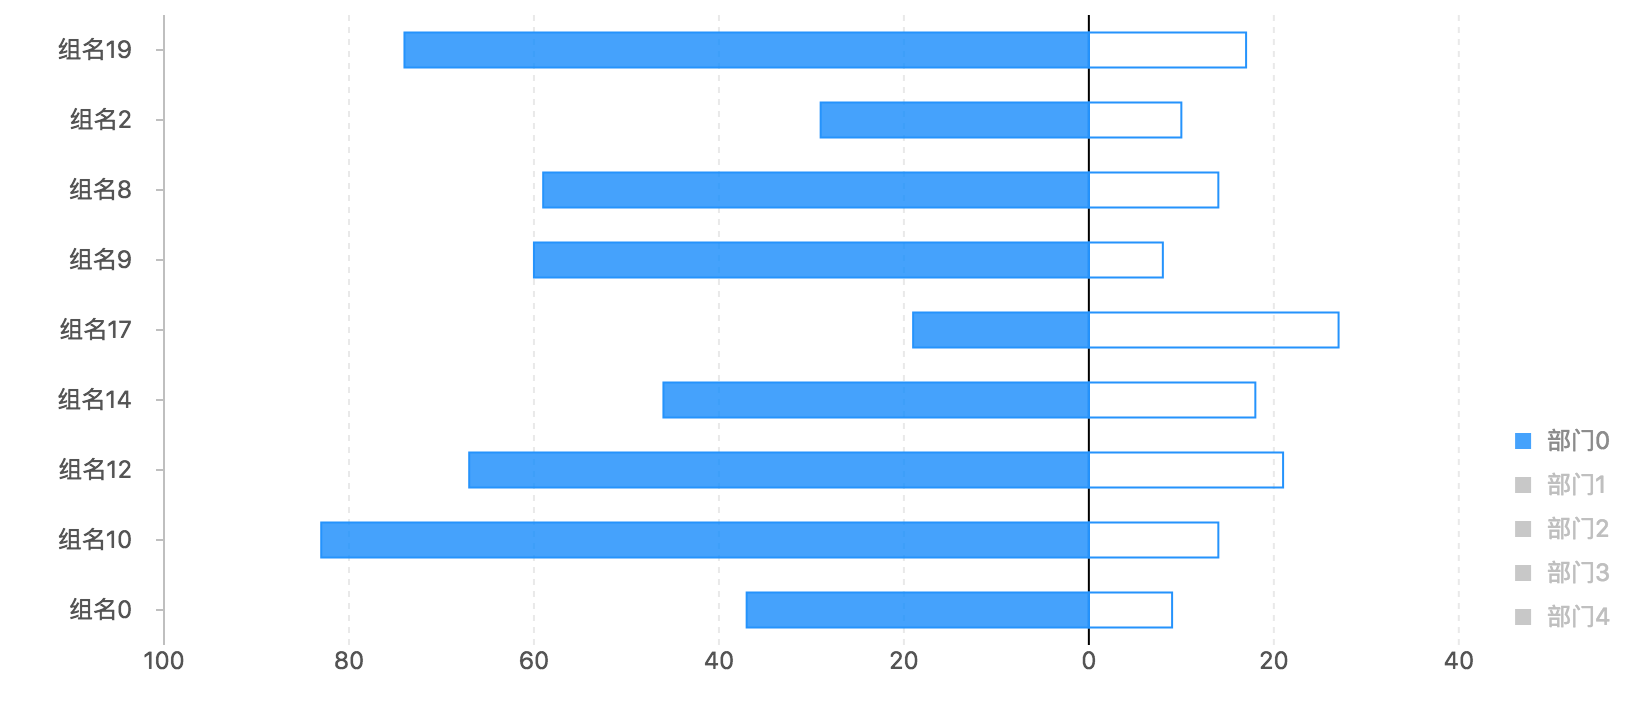
const data = [{ 部门: '部门0', 小组: '组名0', 完成人数: 37, 未完成人数: 9 },{ 部门: '部门0', 小组: '组名2', 完成人数: 29, 未完成人数: 10 },{ 部门: '部门0', 小组: '组名8', 完成人数: 59, 未完成人数: 14 },{ 部门: '部门0', 小组: '组名9', 完成人数: 60, 未完成人数: 8 },{ 部门: '部门0', 小组: '组名10', 完成人数: 83, 未完成人数: 14 },{ 部门: '部门0', 小组: '组名12', 完成人数: 67, 未完成人数: 21 },{ 部门: '部门0', 小组: '组名14', 完成人数: 46, 未完成人数: 18 },{ 部门: '部门0', 小组: '组名17', 完成人数: 19, 未完成人数: 27 },{ 部门: '部门0', 小组: '组名19', 完成人数: 74, 未完成人数: 17 },{ 部门: '部门1', 小组: '组名15', 完成人数: 34, 未完成人数: 19 },{ 部门: '部门1', 小组: '组名20', 完成人数: 71, 未完成人数: 25 },{ 部门: '部门1', 小组: '组名26', 完成人数: 28, 未完成人数: 23 },{ 部门: '部门1', 小组: '组名29', 完成人数: 90, 未完成人数: 24 },{ 部门: '部门2', 小组: '组名7', 完成人数: 50, 未完成人数: 5 },{ 部门: '部门2', 小组: '组名11', 完成人数: 86, 未完成人数: 26 },{ 部门: '部门2', 小组: '组名13', 完成人数: 63, 未完成人数: 16 },{ 部门: '部门2', 小组: '组名27', 完成人数: 76, 未完成人数: 2 },{ 部门: '部门2', 小组: '组名28', 完成人数: 13, 未完成人数: 28 },{ 部门: '部门3', 小组: '组名1', 完成人数: 33, 未完成人数: 16 },{ 部门: '部门3', 小组: '组名3', 完成人数: 14, 未完成人数: 1 },{ 部门: '部门3', 小组: '组名4', 完成人数: 43, 未完成人数: 25 },{ 部门: '部门3', 小组: '组名16', 完成人数: 45, 未完成人数: 13 },{ 部门: '部门3', 小组: '组名18', 完成人数: 50, 未完成人数: 21 },{ 部门: '部门3', 小组: '组名22', 完成人数: 43, 未完成人数: 7 },{ 部门: '部门3', 小组: '组名23', 完成人数: 38, 未完成人数: 6 },{ 部门: '部门3', 小组: '组名24', 完成人数: 33, 未完成人数: 24 },{ 部门: '部门3', 小组: '组名25', 完成人数: 13, 未完成人数: 27 },{ 部门: '部门4', 小组: '组名5', 完成人数: 98, 未完成人数: 4 },{ 部门: '部门4', 小组: '组名6', 完成人数: 88, 未完成人数: 12 },{ 部门: '部门4', 小组: '组名21', 完成人数: 52, 未完成人数: 9 }];const DataView = DataSet.DataView;const dv = new DataView();dv.source(data).transform({type: 'sort',callback: (obj1, obj2) => {return obj1['部门'] > obj2['部门'] ? 1 : -1;}}).transform({type: 'map',callback: obj => {obj['完成人数'] *= -1; // 将完成人数转换成负数return obj;}}).transform({type: 'fold',fields: ['完成人数', '未完成人数'],key: '完成状态',value: '人数'});const chart = new G2.Chart({container: 'c1',forceFit: true,height: 400,padding: [ 5, 100, 80 ]});chart.source(dv);chart.filter('部门', val => {return val === '部门0';});chart.coord().transpose();// 关键代码:设置对应图例的选择模式chart.legend('部门', {selectedMode: 'single',position: 'right-bottom',hoverable: false});chart.legend('完成状态', false);chart.axis('人数', {label: {formatter: value => {value = parseInt(value);return Math.abs(value); // 将负数格式化成正数}}});chart.interval().position('小组*人数').color('部门').shape('完成状态', [ 'rect', 'hollowRect' ]).style({lineWidth: 1});chart.render();
使用 html 渲染图例
G2 支持使用 html 渲染图例,方式非常简单,只要声明 useHtml: true 即可。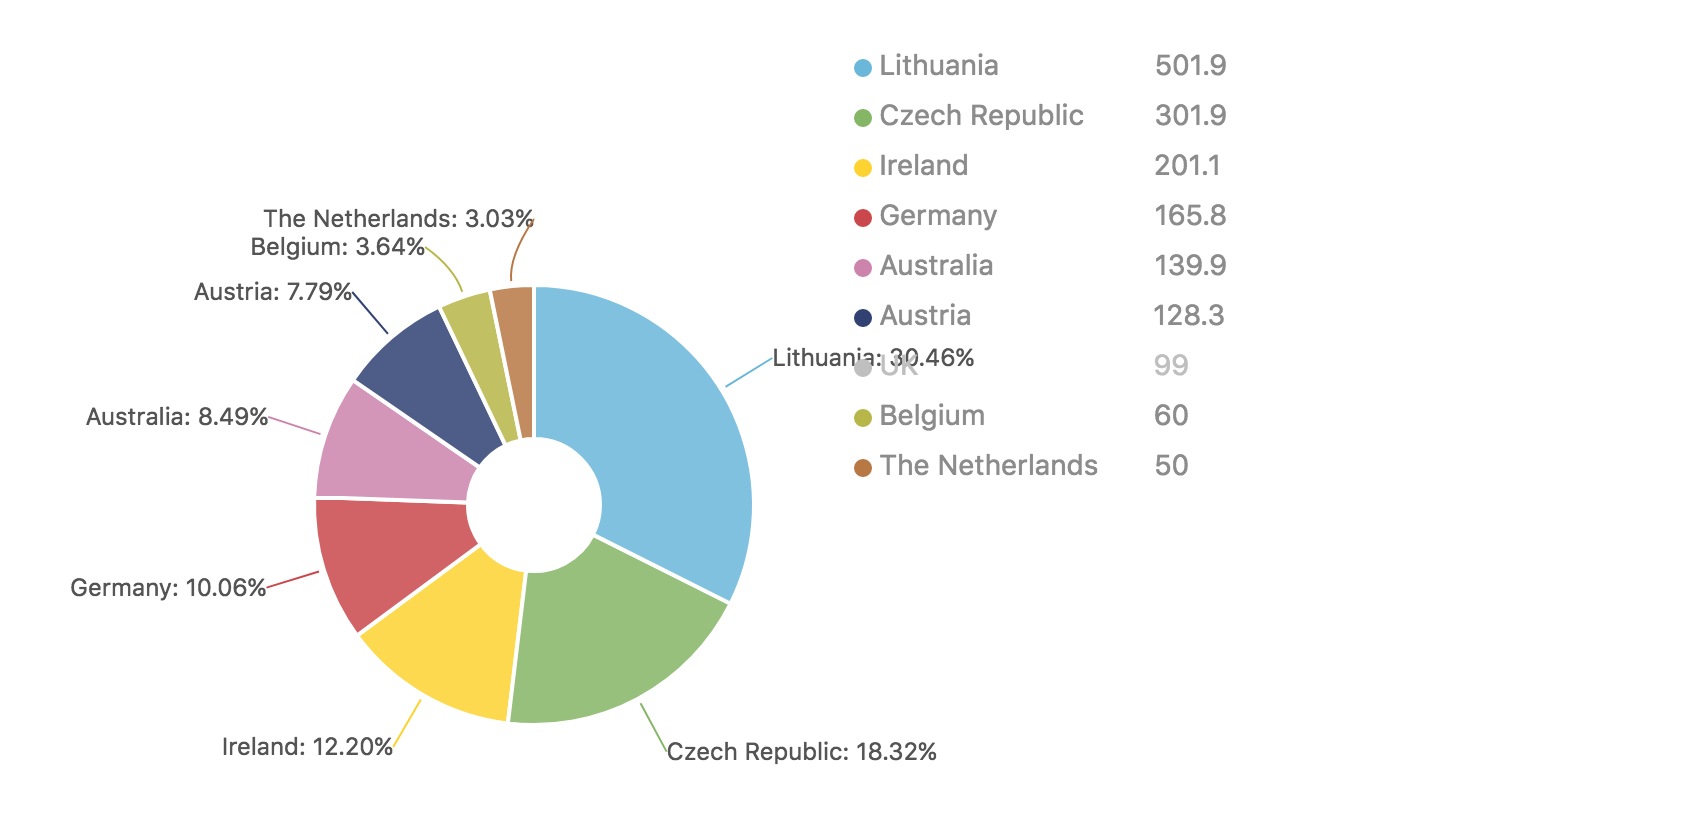
chart.legend({useHtml: true,containerTpl: {string}, // 可选,默认容器模板不满足要求时使用itemTpl: {string} | {function}, // 可选,用户设置的图例项 html 模板,默认提供的模板不满足要求时使用});
const data = [{ country: 'Lithuania', litres: 501.9 },{ country: 'Czech Republic', litres: 301.9 },{ country: 'Ireland', litres: 201.1 },{ country: 'Germany', litres: 165.8 },{ country: 'Australia', litres: 139.9 },{ country: 'Austria', litres: 128.3 },{ country: 'UK', litres: 99 },{ country: 'Belgium', litres: 60 },{ country: 'The Netherlands', litres: 50 }];const ds = new DataSet();const dv = ds.createView().source(data).transform({type: 'percent',field: 'litres',dimension: 'country',as: 'percent'});const chart = new G2.Chart({container: 'c2',width: 500,height: 500,padding: [ 20, 120, 20, 160 ]});chart.source(dv, {percent: {formatter: val => {val = (val * 100).toFixed(2) + '%';return val;}},nice: false});chart.coord('theta', {innerRadius: 0.3,radius: 1});chart.tooltip({showTitle: false, // 不展示标题itemTpl: '<li data-index={index}><span style="color:{color}">{name}:</span>{value}</li>'});chart.legend({useHtml: true,position: 'right',containerTpl: '<div class="g2-legend">' +'<table class="g2-legend-list" style="list-style-type:none;margin:0;padding:0;"></table>' +'</div>',itemTpl: (value, color, checked, index) => {const obj = dv.rows[index];checked = checked ? 'checked' : 'unChecked';return '<tr class="g2-legend-list-item item-' + index + ' ' + checked +'" data-value="' + value + '" data-color=' + color +' style="cursor: pointer;font-size: 14px;">' +'<td width=150 style="border: none;padding:0;"><i class="g2-legend-marker" style="width:10px;height:10px;display:inline-block;margin-right:10px;background-color:' + color + ';"></i>' +'<span class="g2-legend-text">' + value + '</span></td>' +'<td style="text-align: right;border: none;padding:0;">' + obj.litres + '</td>' +'</tr>';},offsetX: 15,'g2-legend': {marginLeft: '100px',marginTop: '-107px'},'g2-legend-list': {border: 'none'}});chart.filter('country', val => {return val !== 'UK';});chart.intervalStack().position('percent').color('country', [ '#67b7dc', '#84b761', '#fdd400', '#cc4748', '#cd82ad', '#2f4074', '#448e4d', '#b7b83f', '#b9783f' ]).label('percent', {formatter: (val, item) => {return item.point.country + ': ' + val;}}).style({lineWidth: 2,stroke: '#fff'});chart.render();
常见问题
- 1.隐藏图例
chart.legend(false); // 隐藏全部图例chart.legend('x', false); // 只隐藏 x 维度对应的图例
- 2.更改图例位置
chart.legend('x', {position: 'bottom'}); // 只更改 x 维度对应的图例的显示位置
- 3.图例显示位置不够
调整 padding 值(padding 的介绍详见创建图表之图表样式)。

若有收获,就点个赞吧
0 人点赞
