G2 默认内置的交互包括:
active 激活;
select 选中。
激活
开启以及关闭 shape 对于鼠标 hover 时的响应效果,G2 默认为各个 shape 内置了 active 效果。
geom.active(false); // 关闭默认响应geom.active(true); // 开启默认响应
选中
各个几何标记 geom 选中的模式包含如下三种:
不可选中;
单选;
多选;
选中是否可取消选中。
选中模式的设置方式如下:
geom.select(false); // 关闭geom.select(true); // 打开geom.select([true,] {mode: 'single' || 'multiple', // 选中模式,单选、多选style: {}, // 选中后 shape 的样式cancelable: true | false, // 选中之后是否允许取消选中,默认允许取消选中animate: true | false // 选中是否执行动画,默认执行动画});
默认情况下,G2 中只有饼图支持选中交互,其他 geom 的选中模式默认情况下都是关闭的。
下面通过一个实例来演示选中 select(enable, cfg) 方法的使用。
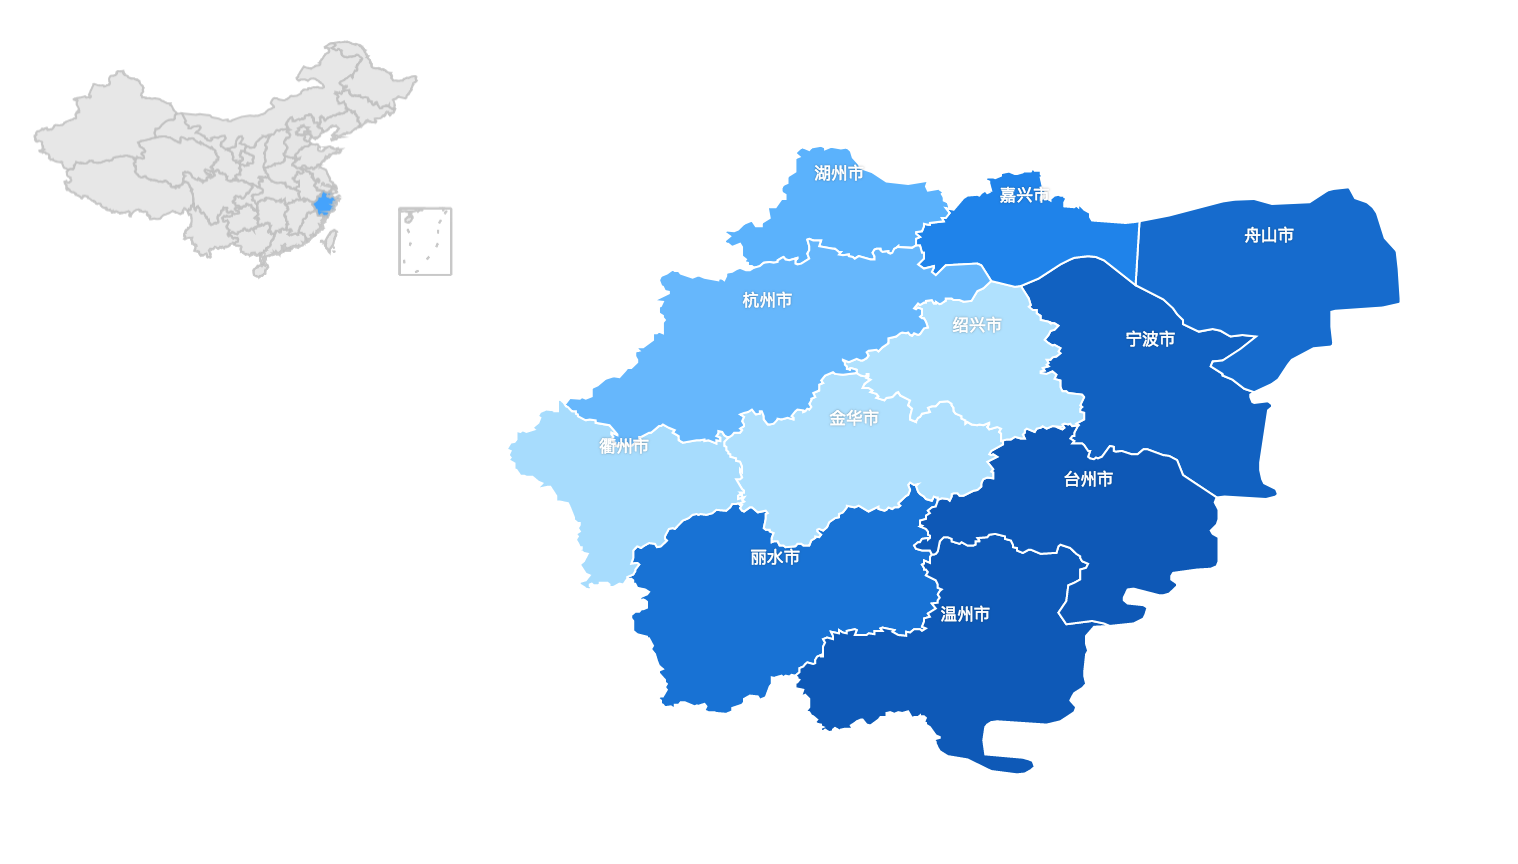
示例:地图省市下钻
本例中的地图 GeoJSON 数据请访问该地址获取:
<script src="https://a.alipayobjects.com/g/datavis/china-geojson/1.0.0/index.js"></script>
或者 github。
let provinceChart;function processData(mapData) {// 构造虚拟数据const userData = [];const features = mapData.features;for (let i = 0; i < features.length; i++) {const name = features[i].properties.name;userData.push({name: name,value: Math.round(Math.random() * 1000),});}const ds = new DataSet();const geoDataView = ds.createView().source(mapData, {type: 'GeoJSON',}); // geoJSON 经纬度数据// 用户数据const dvData = ds.createView().source(userData);dvData.transform({type: 'geo.region',field: 'name',geoDataView: geoDataView,as: ['longitude', 'latitude'],});return dvData;}function renderProvinceChart(name) {const provinceData = ChinaGeoJSON[name];provinceChart && provinceChart.destroy();provinceChart = null;if (!provinceData) {return;}const dv = processData(provinceData);// start: 计算地图的最佳宽高const longitudeRange = dv.range('longitude');const latitudeRange = dv.range('latitude');const ratio = (longitudeRange[1] - longitudeRange[0]) / (latitudeRange[1] - latitudeRange[0]);let width;let height;if (ratio > 1) {width = 450;height = width / ratio;} else {width = 350 * ratio;height = 350;}// end: 计算地图的最佳宽高provinceChart = new G2.Chart({container: 'province',width,height,padding: 0});provinceChart.source(dv);provinceChart.axis(false);provinceChart.tooltip({showTitle: false,});provinceChart.polygon().position('longitude*latitude').label('name', {textStyle: {fill: '#fff',fontSize: 10,shadowBlur: 2,shadowColor: 'rgba(0, 0, 0, .45)'},}).style({stroke: '#fff',lineWidth: 1,}).color('value', '#BAE7FF-#1890FF-#0050B3');provinceChart.render();}const mapData = ChinaGeoJSON['China'];const chinaDv = processData(mapData);const longitudeRange = chinaDv.range('longitude');const latitudeRange = chinaDv.range('latitude');const ratio = (longitudeRange[1] - longitudeRange[0]) / (latitudeRange[1] - latitudeRange[0]);const chart = new G2.Chart({container: 'china',width: 250,height: 250 / ratio,padding: 0,animate: false});chart.source(chinaDv);chart.tooltip({showTitle: false,});chart.axis(false);chart.polygon().position('longitude*latitude').tooltip('name').style({stroke: '#bfbfbf',lineWidth: 1,fill: '#e3e3e3',globalAlpha: 0.85,cursor: 'pointer', // 设置鼠标手势}).select({// 设置是否允许选中以及选中样式mode: 'single', // 多选还是单选style: {fill: '#1890ff', // 选中的样式},});chart.render();const shapes = chart.getAllGeoms()[0].getShapes();for (let i = 0, len = shapes.length; i < len; i++) {const shape = shapes[i];const origin = shape.get('origin')['_origin'];const name = origin.name;if (name === '浙江') {renderProvinceChart(name);chart.getAllGeoms()[0].setShapeSelected(shape);}}chart.on('plotclick', function(ev) {const shape = ev.shape;if (!shape || !shape.name) {return false;}if (shape.get('selected')) {const item = shape.get('origin');const data = item['_origin'];const name = data.name;renderProvinceChart(name);} else {provinceChart && provinceChart.clear();}});

