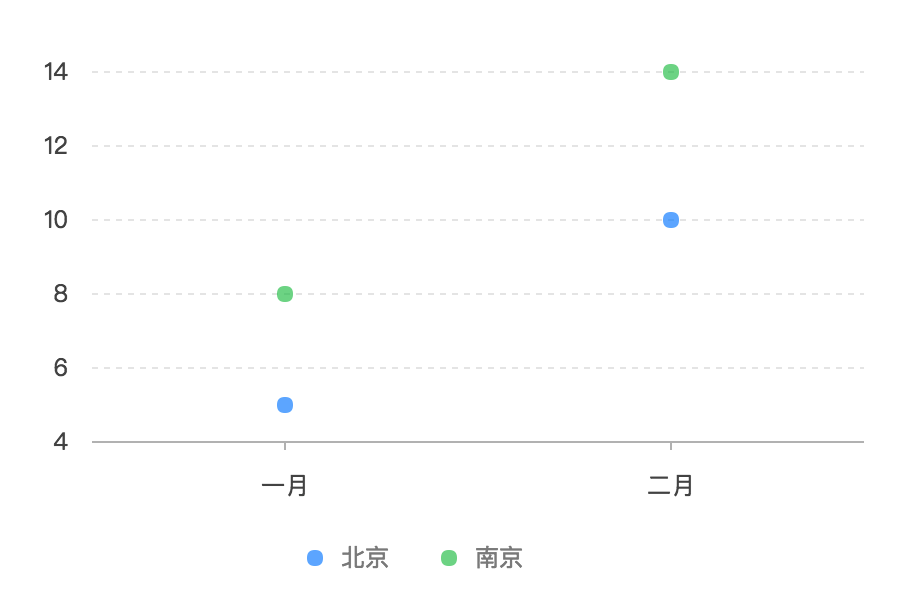
下面我们以最简单的月份、天气、城市的数据为例说明 G2 的数据处理流程,阐述数据是如何映射至图形空间。
我们需要在 400 px * 200 px 像素区域绘制如下点图(该图只是用于数据流说明,并不具有可视化意义):
原始数据如下:
const data = [{ month: '一月', temperature: 5, city: '北京' },{ month: '二月', temperature: 10, city: '北京' },{ month: '一月', temperature: 8, city: '南京' },{ month: '二月', temperature: 14, city: '南京' }];
绘图代码:
const chart = new G2.Chart({id: 'mountNode',width: 400,height: 200});chart.source(data);chart.point().position('month*temperature').color('city', [ '#1890FF', '#2FC25B' ]);chart.render();
chart.point().position('month*temperature').color('city', [ '#1890FF', '#2FC25B' ]); 含义如下:
将
month映射到position位置图形属性的 x 轴方向;将
temperature映射到position位置图形属性的 y 轴方向;将
city映射到color颜色图形属性。使用的颜色是 [‘#1890FF’, ‘#2FC25B’]
加载数据
加载数据后,对数据进行处理,处理后结构如表所示:
| month | temperature | city |
|---|---|---|
| 一月 | 5 | 北京 |
| 二月 | 10 | 北京 |
| 一月 | 8 | 南京 |
| 二月 | 14 | 南京 |
对数据进行分组
默认我们会根据映射至 size shape color 这三个图形属性的数据属性对数据进行分组。
这里我们根据 city 字段对数据进行分组,如下表所示:
| month | temperature | city |
|---|---|---|
| 一月 | 5 | 北京 |
| 二月 | 10 | 北京 |
| month | temperature | city |
|---|---|---|
| 一月 | 8 | 南京 |
| 二月 | 14 | 南京 |
保存原始数据
此时将原始数据保存下来,方便后期 tooltip 取对应的数据进行展示。
所有的原始数据存储于 _origin 属性中。
| month | temperature | city | _origin |
|---|---|---|---|
| 一月 | 5 | 北京 | {“month”:”一月”,”temperature”:5,”city”:”北京”} |
| 二月 | 10 | 北京 | {“month”:”二月”,”temperature”:10,”city”:”北京”} |
| month | temperature | city | _origin |
|---|---|---|---|
| 一月 | 8 | 南京 | {“month”:”一月”,”temperature”:8,”city”:”南京”} |
| 二月 | 14 | 南京 | {“month”:”二月”,”temperature”:14,”city”:”南京”} |
数据数值化
这里 month city 为分类的类型,我们将其转换为数值(索引值)。
| month | temperature | city | _origin |
|---|---|---|---|
| 0 | 5 | 0 | {month: ‘一月’,temperature: 5,city: ‘北京’} |
| 1 | 10 | 0 | {“month”:”二月”,”temperature”:10,”city”:”北京”} |
| month | temperature | city | _origin |
|---|---|---|---|
| 0 | 8 | 1 | {“month”:”一月”,”temperature”:8,”city”:”南京”} |
| 1 | 14 | 1 | {“month”:”二月”,”temperature”:14,”city”:”南京”} |
调整数据 adjust
此处无调整。
归一化操作
由于月份
month是分类类型,又决定 x 轴的位置,需要在坐标轴两端留下空白,所以需要将数据归一化的分布范围从 [0, 1] 调整至 [0.25, 0.75];city是分类类型,但是不参与位置运算,所以分布范围仍为 [0, 1];temperature是数字类型,原始数值范围为 [5, 14],但是为了让 y 坐标轴的刻度线均匀分布易于用户阅读理解,G2 会默认对数值进行优化,将数值范围调整为 [0, 20] 使得刻度线均匀分布(默认每条坐标轴绘制 5 个刻度线),即 [0, 5, 10, 15, 20],然后将原始数值归一化到 [0, 1];
归一化后的结果:
| month | temperature | city | _origin |
|---|---|---|---|
| 0.25 | 0.25 | 0 | {month: ‘一月’,temperature: 5,city: ‘北京’} |
| 0.75 | 0.5 | 0 | {“month”:”二月”,”temperature”:10,”city”:”北京”} |
| month | temperature | city | _origin |
|---|---|---|---|
| 0.25 | 0.4 | 1 | {“month”:”一月”,”temperature”:8,”city”:”南京”} |
| 0.75 | 0.7 | 1 | {“month”:”二月”,”temperature”:14,”city”:”南京”} |
计算绘制图形需要的点
对于点图,我们只需要获取 x 和 y 轴的坐标点即可。所以数据处理结果如下:
| month | temperature | city | _origin |
|---|---|---|---|
| [0.25] | [0.25] | 0 | {month: ‘一月’,temperature: 5,city: ‘北京’} |
| [0.75] | [0.5] | 0 | {“month”:”二月”,”temperature”:10,”city”:”北京”} |
| month | temperature | city | _origin |
|---|---|---|---|
| [0.25] | [0.4] | 1 | {“month”:”一月”,”temperature”:8,”city”:”南京”} |
| [0.75] | [0.7] | 1 | {“month”:”二月”,”temperature”:14,”city”:”南京”} |
映射至图形属性
由于画布坐标的起始点为左上角,所以y轴上的 0.1 转换成画布坐标的结果为 200 - 200 * 0.1
| x | y | color | _origin |
|---|---|---|---|
| [100] | [150] | ‘#1890FF’ | {month: ‘一月’,temperature: 5,city: ‘北京’} |
| [300] | [100] | ‘#1890FF’ | {“month”:”二月”,”temperature”:10,”city”:”北京”} |
| x | y | color | _origin |
|---|---|---|---|
| [100] | [120] | ‘#2FC25B’ | {“month”:”一月”,”temperature”:8,”city”:”南京”} |
| [300] | [60] | ‘#2FC25B’ | {“month”:”二月”,”temperature”:14,”city”:”南京”} |
渲染绘制
将最后处理的数据交由绘图库进行绘制渲染。

