Guide 作为 G2 图表的辅助元素,主要用于在图表上标识额外的标记注解。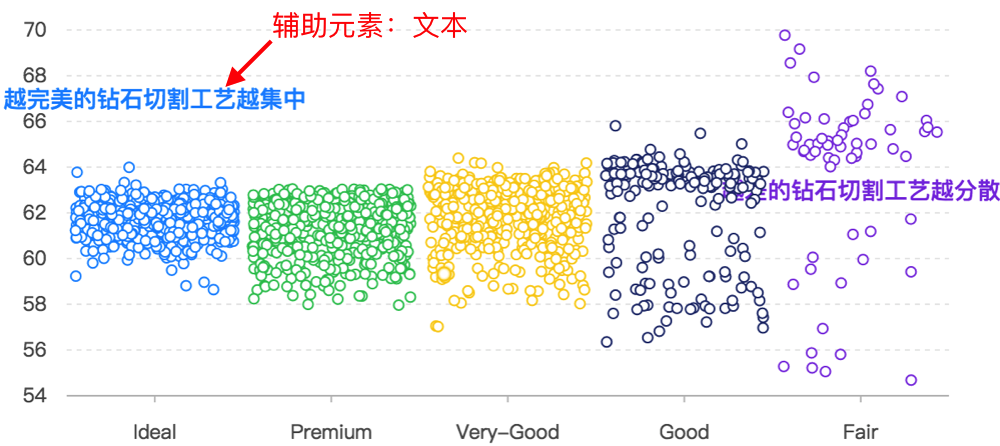
guide 类型
G2 目前支持 9 种辅助标记类型:
line:辅助线(可带文本),例如表示平均值或者预期分布的直线;
image:辅助图片,在图表上添加辅助图片;
text:辅助文本,指定位置添加文本说明;
region:辅助框,框选一段图区,设置背景、边框等;
regionFilter:区域着色,将图表中位于矩形选区中的图形元素提取出来,重新着色;
html:辅助 html,指定位置添加自定义 html,显示自定义信息;
arc:辅助弧线。
dataMarker:特殊数据点标注,多用于折线图和面积图
dataRegion:特殊数据区间标注,多用于折线图和面积图
如何使用
下面列出了各个 guide 辅助标记类型的使用,更详细的配置项参见 Guide API。
guide 辅助标记用于标示位置的方式主要有两种
原始数据的值 如: {time: ‘2010-01-01’, value: 100} 或者 [‘2010-01-01’, 100]
图表绘图区域的相对位置,从左上角计算 如:[‘50%’, ‘50%’]
注意:
原始数据和百分比的方式不能混用,不支持[‘2010-01-01’, ‘50%’]
不同 guide 中标示位置的参数不完全相同,主要是 start, end, position
line 辅助线
chart.guide().line({start: {object} | {function} | {array}, // 辅助线起始位置,值为原始数据值,支持 callbackend: {object} | {function}|| {array},// 辅助线结束位置,值为原始数据值,支持 callbacklineStyle: {stroke: '#999', // 线的颜色lineDash: [ 0, 2, 2 ], // 虚线的设置lineWidth: 3 // 线的宽度}, // 图形样式配置text: {position: 'start' | 'center' | 'end' | '39%' | 0.5, // 文本的显示位置autoRotate: {boolean}, // 是否沿线的角度排布,默认为 truestyle: {// 文本图形样式配置},content: {string}, // 文本的内容offsetX: {number}, // x 方向的偏移量offsetY: {number} // y 方向的偏移量} // 文本配置});
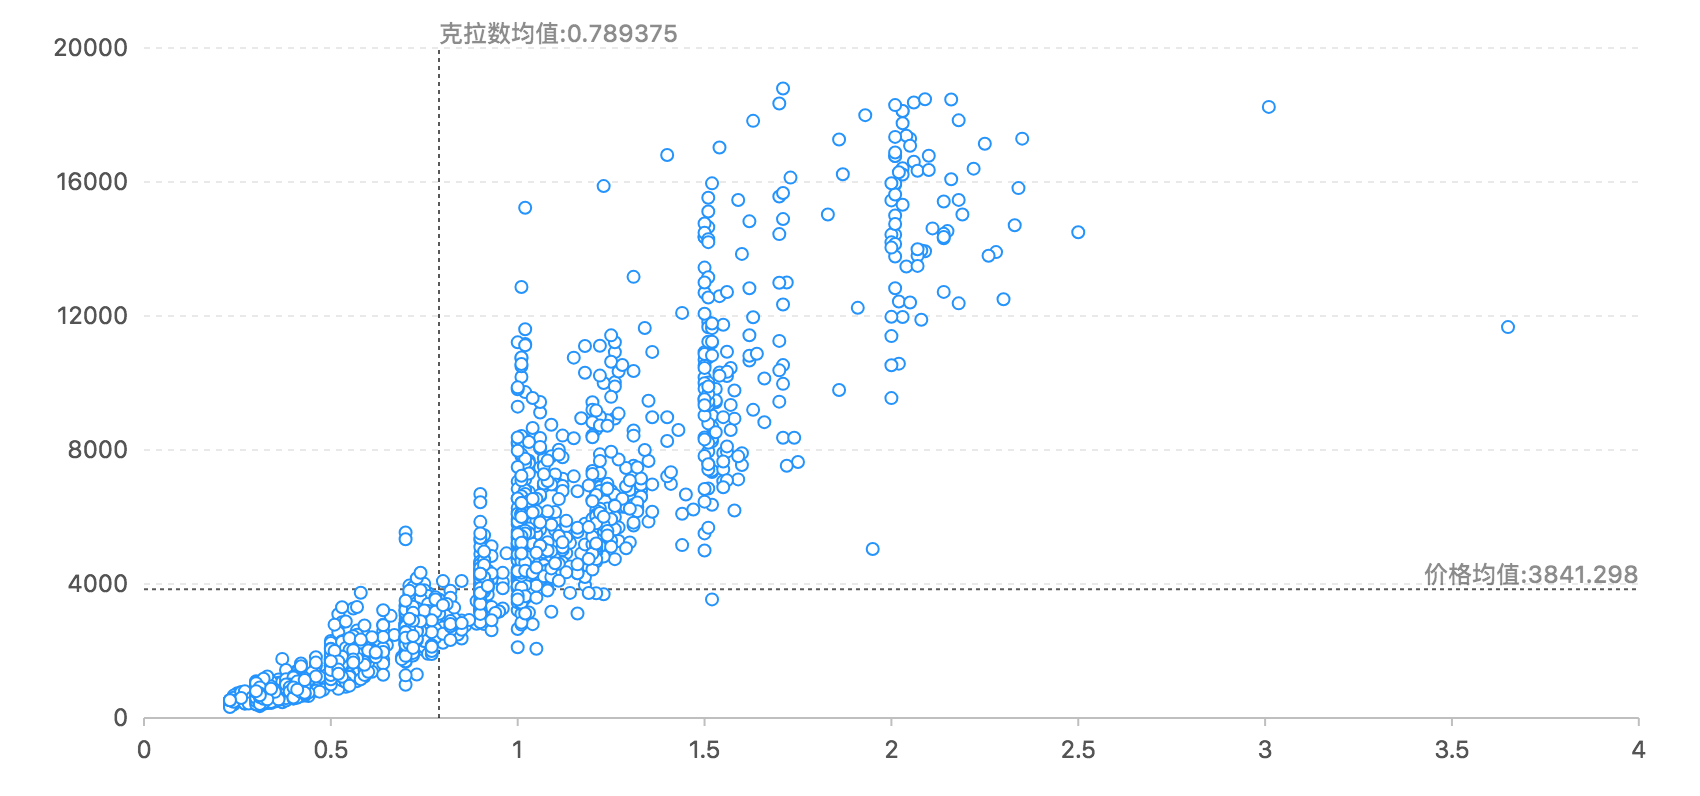
const DataView = DataSet.DataView;$.getJSON('/assets/data/diamond.json', function(data) {const dv = (new DataView()).source(data);const caratAvg = dv.mean('carat'); // 计算克拉数均值const priceAvg = dv.mean('price'); // 计算价格均值const chart = new G2.Chart({ // 创建图表container : 'c1',forceFit: true,height: 450});chart.source(data); // 设置数据源chart.point().position('carat*price');chart.guide().line({start: [ caratAvg, 0 ], // 使用数组格式end: [ caratAvg, 20000 ],text: {position: 'end',autoRotate: false,content: '克拉数均值:' + caratAvg}});chart.guide().line({start: {carat: 0,price: priceAvg}, // 使用对象格式end: {carat: 4,price: priceAvg},text: {position: 'end',autoRotate: false,content: '价格均值:' + priceAvg,style: {textAlign: 'end'}}});chart.render(); // 图表渲染});
image 辅助图片
// 辅助图片 image,只是指定了 start,则该点表示图片左上角坐标chart.guide().image({top: {boolean}, // 指定 giude 是否绘制在 canvas 最上层,默认为 false, 即绘制在最下层zIndex: {number},start: {object} | {function} | {array}, // 图片起始位置, 值为原始数据值,支持 callbacksrc: {string}, // 图片路径width: {number},height: {number},offsetX: {number}, // x 方向的偏移量offsetY: {number} // y 方向偏移量});// 辅助图片 image,通过指定 start 和 end 确定图片的位置和宽高chart.guide().image({top: {boolean}, // 指定 giude 是否绘制在 canvas 最上层,默认为 false, 即绘制在最下层start: {array} | {function} | {array}, // 图片起始位置, 值为原始数据值,支持 callbackend: {array} | {function} | {array}, // 图片结束位置, 值为原始数据值,支持 callbacksrc: {string}, // 图片路径offsetX: {number}, // x 方向的偏移量offsetY: {number} // y 方向偏移量});
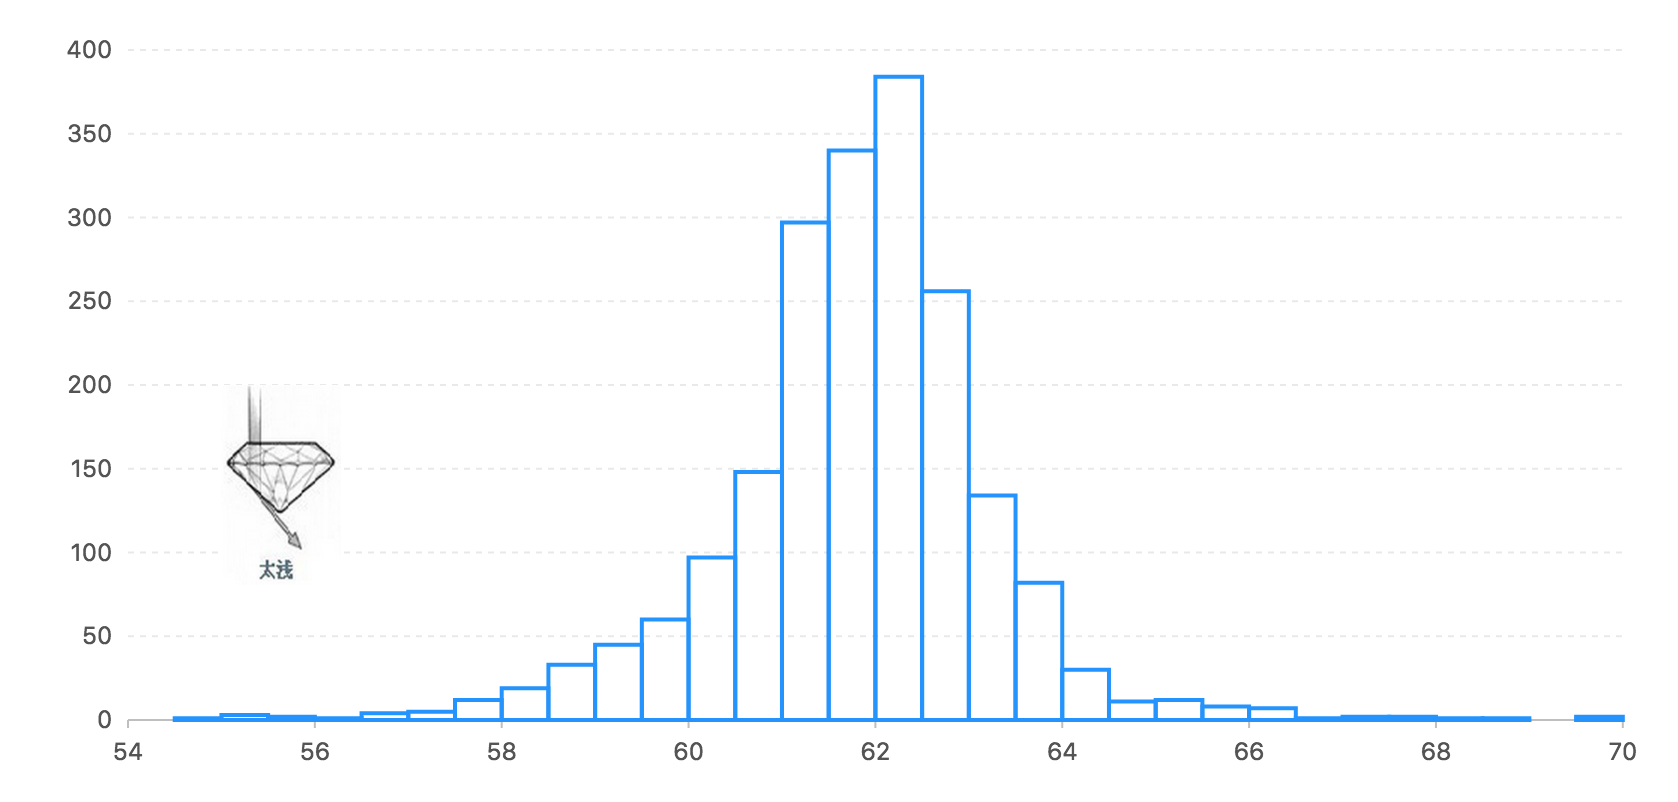
const DataView = DataSet.DataView;$.getJSON('/assets/data/diamond.json', function(data) {const dv = new DataView();dv.source(data).transform({type: 'bin.histogram',field: 'depth',binWidth: 0.5,as: [ 'depth', 'count' ],});const chart = new G2.Chart({container: 'c2',forceFit: true,height: 450});chart.source(dv);chart.tooltip({crosshairs: false});chart.interval().position('depth*count').shape('hollowRect');chart.guide().image({start: [ 55, 200 ],src: 'https://os.alipayobjects.com/rmsportal/IUYwZOlOpysCUsl.png',width: 60,height: 100});chart.render();});
text 辅助文本
chart.guide().text({top: {boolean}, // 指定 giude 是否绘制在 canvas 最上层,默认为 false, 即绘制在最下层zIndex: {number},position: {object} | {function} | {array}, // 文本的起始位置,值为原始数据值,支持 callbackcontent:style: {fill: '#666', // 文本颜色fontSize: '12', // 文本大小fontWeight: 'bold' // 文本粗细rotate: 30 // 旋转角度}, // 文本的图形样式属性offsetX: {number}, // x 方向的偏移量offsetY: {number} // y 方向偏移量});
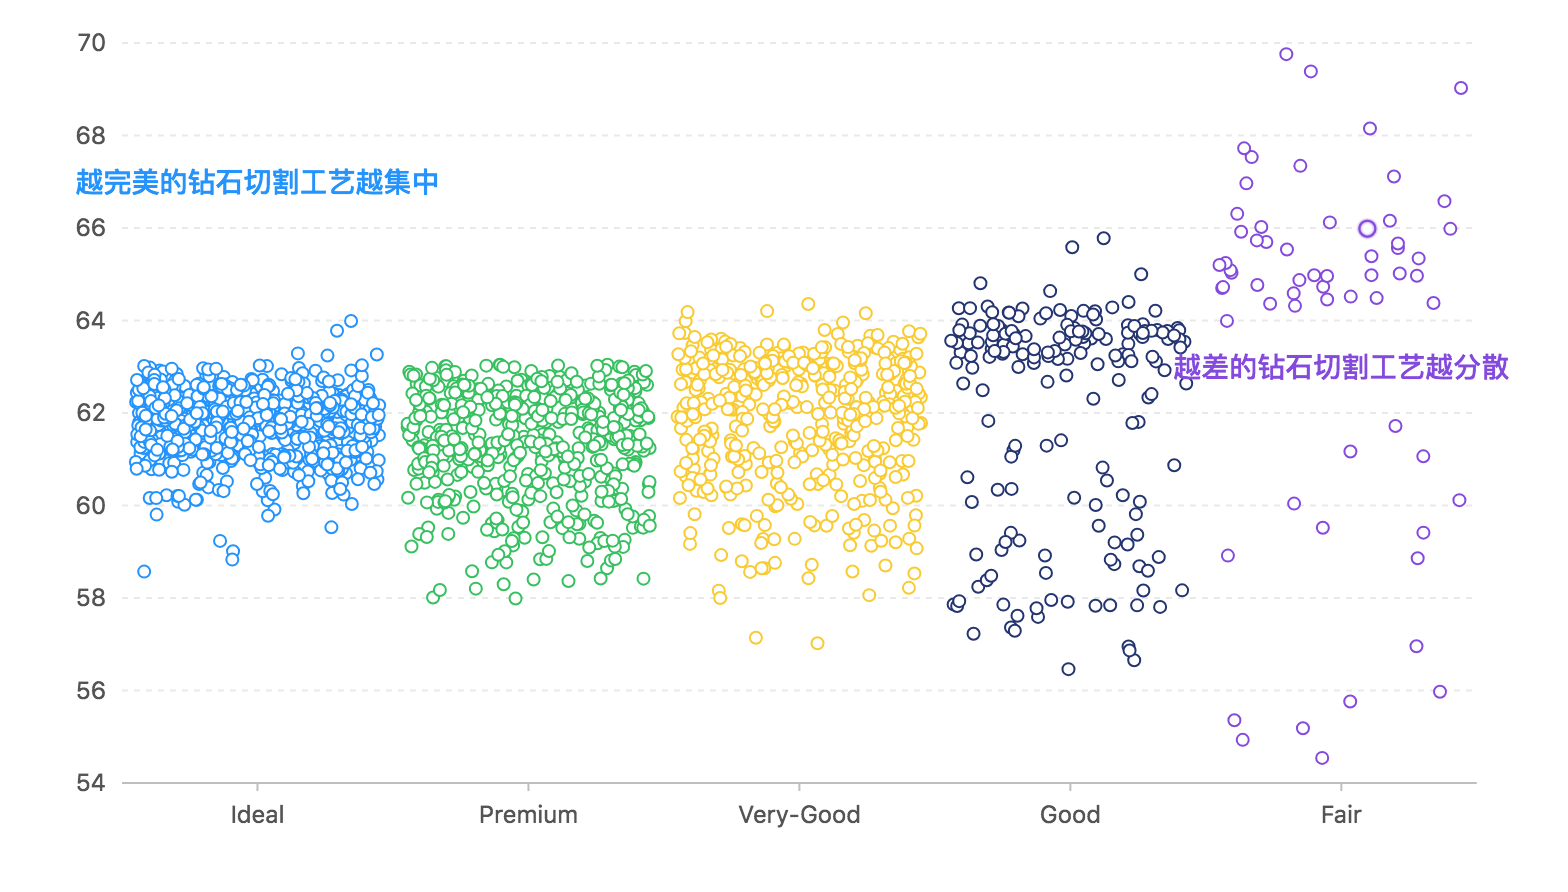
const colors = G2.Global.colors;$.getJSON('/assets/data/diamond.json', function(data) {const chart = new G2.Chart({ // 创建图表container : 'c3',forceFit: true,height: 450,padding: [ 20, 90, 60, 80 ]});const defs = {'cut': {type: 'cat',values:[ 'Ideal', 'Premium', 'Very-Good', 'Good', 'Fair' ]}};chart.source(data, defs); // 设置数据源chart.legend(false);chart.pointJitter().position('cut*depth').color('cut');chart.guide().text({position: [ 'Ideal', 67 ],content: '越完美的钻石切割工艺越集中',style: {fill: colors[0],textAlign: 'center',fontSize: 14}});chart.guide().text({position: [ 'Fair', 63 ],content: '越差的钻石切割工艺越分散',style: {fill: colors[4],textAlign: 'center',fontSize: 14}});chart.render(); // 图表渲染});
region 辅助框
chart.guide().region({top: {boolean}, // 指定 giude 是否绘制在 canvas 最上层,默认为 false, 即绘制在最下层start: {object} | {function} | {array}, // 辅助框起始位置,值为原始数据值,支持 callbackend: {object} | {function} | {array},// 辅助框结束位置,值为原始数据值,支持 callbackstyle: {lineWidth: 0, // 辅助框的边框宽度fill: '#f80', // 辅助框填充的颜色fillOpacity: 0.1, // 辅助框的背景透明度stroke: '#ccc' // 辅助框的边框颜色设置} // 辅助框的图形样式属性});
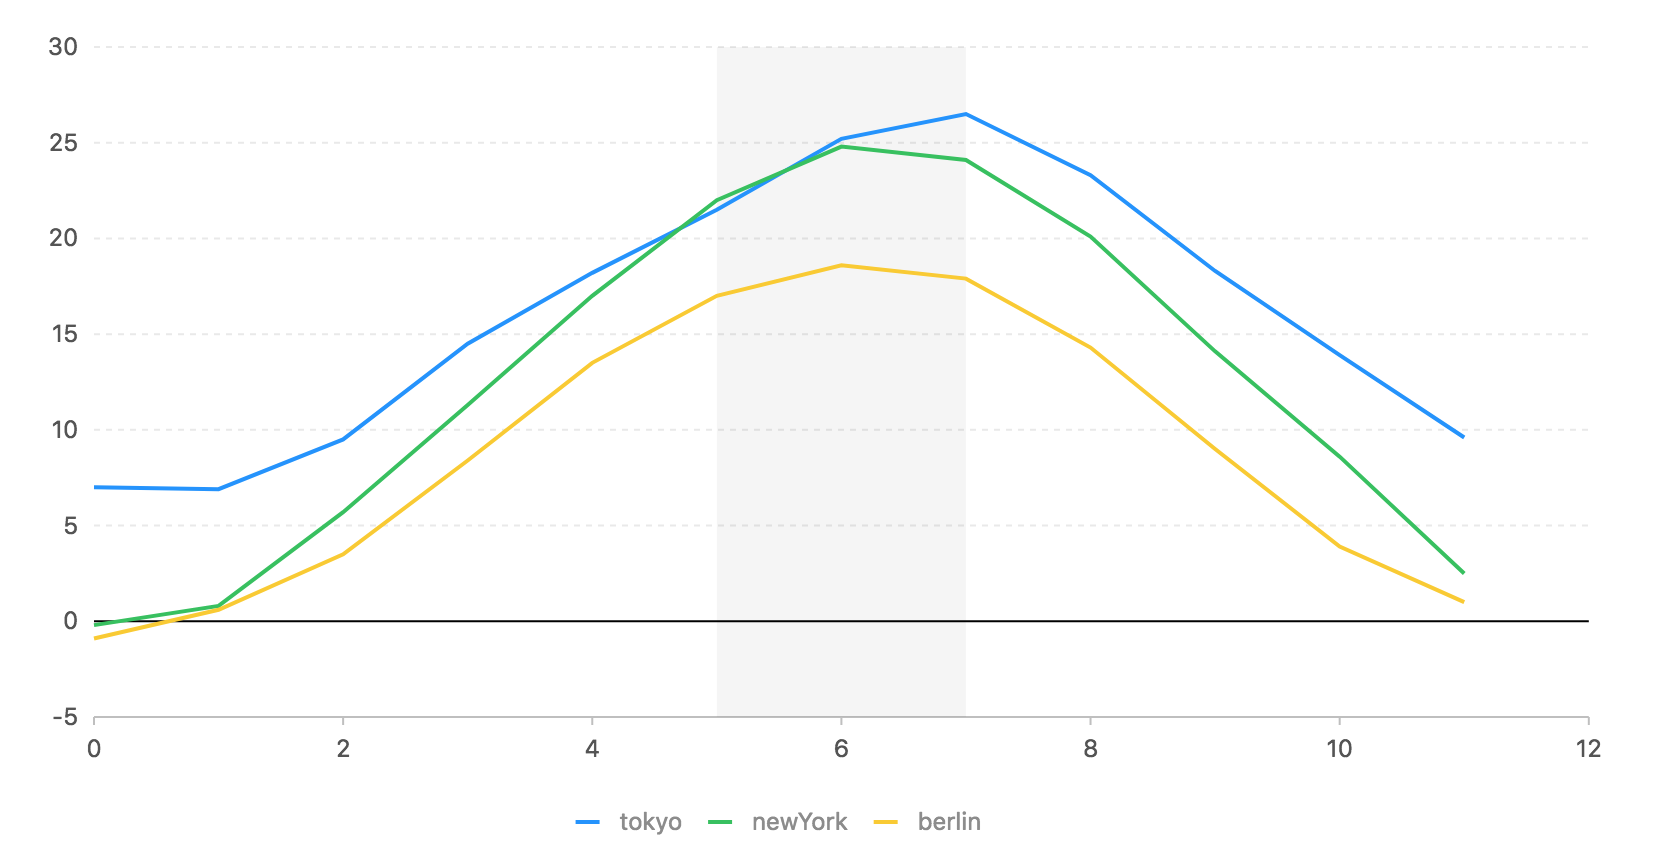
const data = [{ month: 0, tem: 7, city: 'tokyo' },{ month: 1, tem: 6.9, city: 'tokyo' },{ month: 2, tem: 9.5, city: 'tokyo' },{ month: 3, tem: 14.5, city: 'tokyo' },{ month: 4, tem: 18.2, city: 'tokyo' },{ month: 5, tem: 21.5, city: 'tokyo' },{ month: 6, tem: 25.2, city: 'tokyo' },{ month: 7, tem: 26.5, city: 'tokyo' },{ month: 8, tem: 23.3, city: 'tokyo' },{ month: 9, tem: 18.3, city: 'tokyo' },{ month: 10, tem: 13.9, city: 'tokyo' },{ month: 11, tem: 9.6, city: 'tokyo' },{ month: 0, tem: -0.2, city: 'newYork' },{ month: 1, tem: 0.8, city: 'newYork' },{ month: 2, tem: 5.7, city: 'newYork' },{ month: 3, tem: 11.3, city: 'newYork' },{ month: 4, tem: 17, city: 'newYork' },{ month: 5, tem: 22, city: 'newYork' },{ month: 6, tem: 24.8, city: 'newYork' },{ month: 7, tem: 24.1, city: 'newYork' },{ month: 8, tem: 20.1, city: 'newYork' },{ month: 9, tem: 14.1, city: 'newYork' },{ month: 10, tem: 8.6, city: 'newYork' },{ month: 11, tem: 2.5, city: 'newYork' },{ month: 0, tem: -0.9, city: 'berlin' },{ month: 1, tem: 0.6, city: 'berlin' },{ month: 2, tem: 3.5, city: 'berlin' },{ month: 3, tem: 8.4, city: 'berlin' },{ month: 4, tem: 13.5, city: 'berlin' },{ month: 5, tem: 17, city: 'berlin' },{ month: 6, tem: 18.6, city: 'berlin' },{ month: 7, tem: 17.9, city: 'berlin' },{ month: 8, tem: 14.3, city: 'berlin' },{ month: 9, tem: 9, city: 'berlin' },{ month: 10, tem: 3.9, city: 'berlin' },{ month: 11, tem: 1, city: 'berlin' }];const chart = new G2.Chart({container: 'c4',forceFit: true,height: 450});chart.source(data);chart.line().position('month*tem').color('city');chart.guide().region({start: [ 5, 'min' ],end: [ 7, 'max' ]}); // 6月 - 8月最低温度chart.render();
辅助 html
chart.guide().html({position: {object} | {function} | {array}, // html 的中心位置, 值为原始数据值,支持 callbackalignX: 'left' | 'middle' | 'right',alignY: 'top' | 'middle' | 'bottom',offsetX: {number},offsetY: {number},html: {string}, // html 代码,也支持callback,可能是最大值、最小值之类的判定zIndex: {number}});
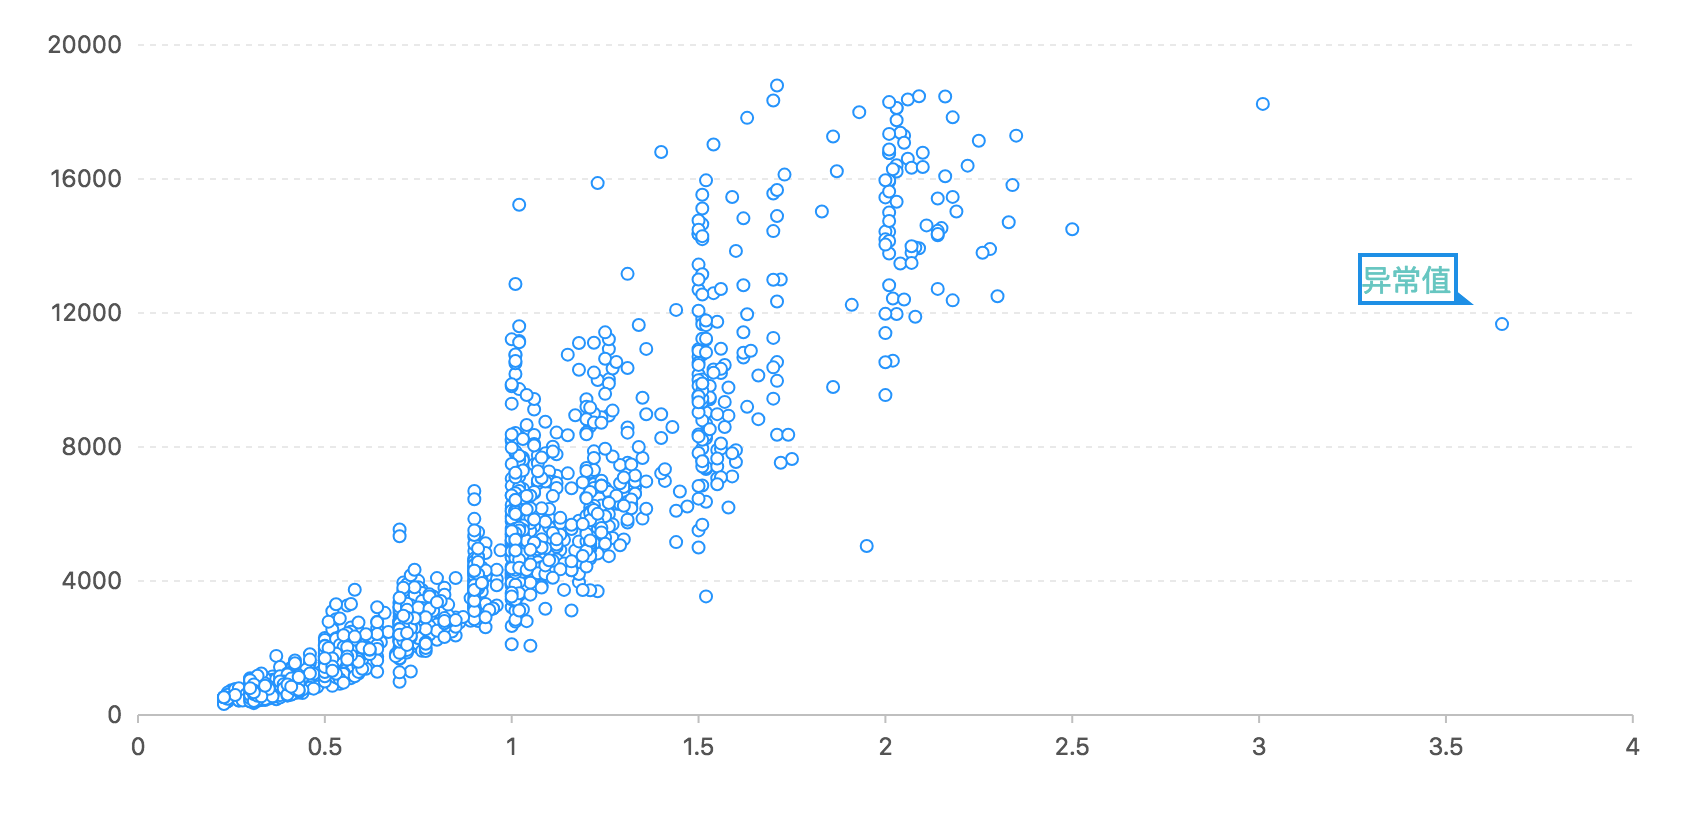
const DataView = DataSet.DataView;$.getJSON('/assets/data/diamond.json', function(data) {const dv = (new DataView()).source(data);const caratAvg = dv.mean('carat'); // 计算克拉数均值const priceAvg = dv.mean('price'); // 计算价格均值const chart = new G2.Chart({container: 'c5',forceFit: true,height: 450});chart.source(data);chart.point().position('carat*price');// 坐标点const point = [ 3.5, 12000 ];//html字符串const tooltipHtml = "<div style='border: 2px solid #0f8de8;width: 50px;height: 26px;color: #0f8de8;position: relative;'>" +"<span style='color:#63c6c2;font-size:15px'>异常值</span>" +"<div style='width: 0;height: 0;border-bottom: 8px solid #0f8de8;border-right:10px solid transparent;position: absolute;top: 16px;left: 46px;'></div>" +"</div>";chart.guide().html({position: point,html: tooltipHtml,alignX: 'right',alignY: 'bottom',offsetX: 10});chart.render(); // 图表渲染});
辅助 regionFilter
将图表中位于矩形选区中的图形元素提取出来,重新着色,可以用于区域筛选、图表分段着色。
chart.guide().regionFilter({top: {boolean}, // 指定 giude 是否绘制在 canvas 最上层,默认为 true, 即绘制在最上层start: {object} | {function} | {array}, // 辅助框起始位置,值为原始数据值,支持 callbackend: {object} | {function} | {array},// 辅助框结束位置,值为原始数据值,支持 callbackcolor:'#ccc' //染色色值apply:{array} //可选,设定regionFilter只对特定geom类型起作用,如apply:['area'],默认regionFilter的作用域为整个图表});
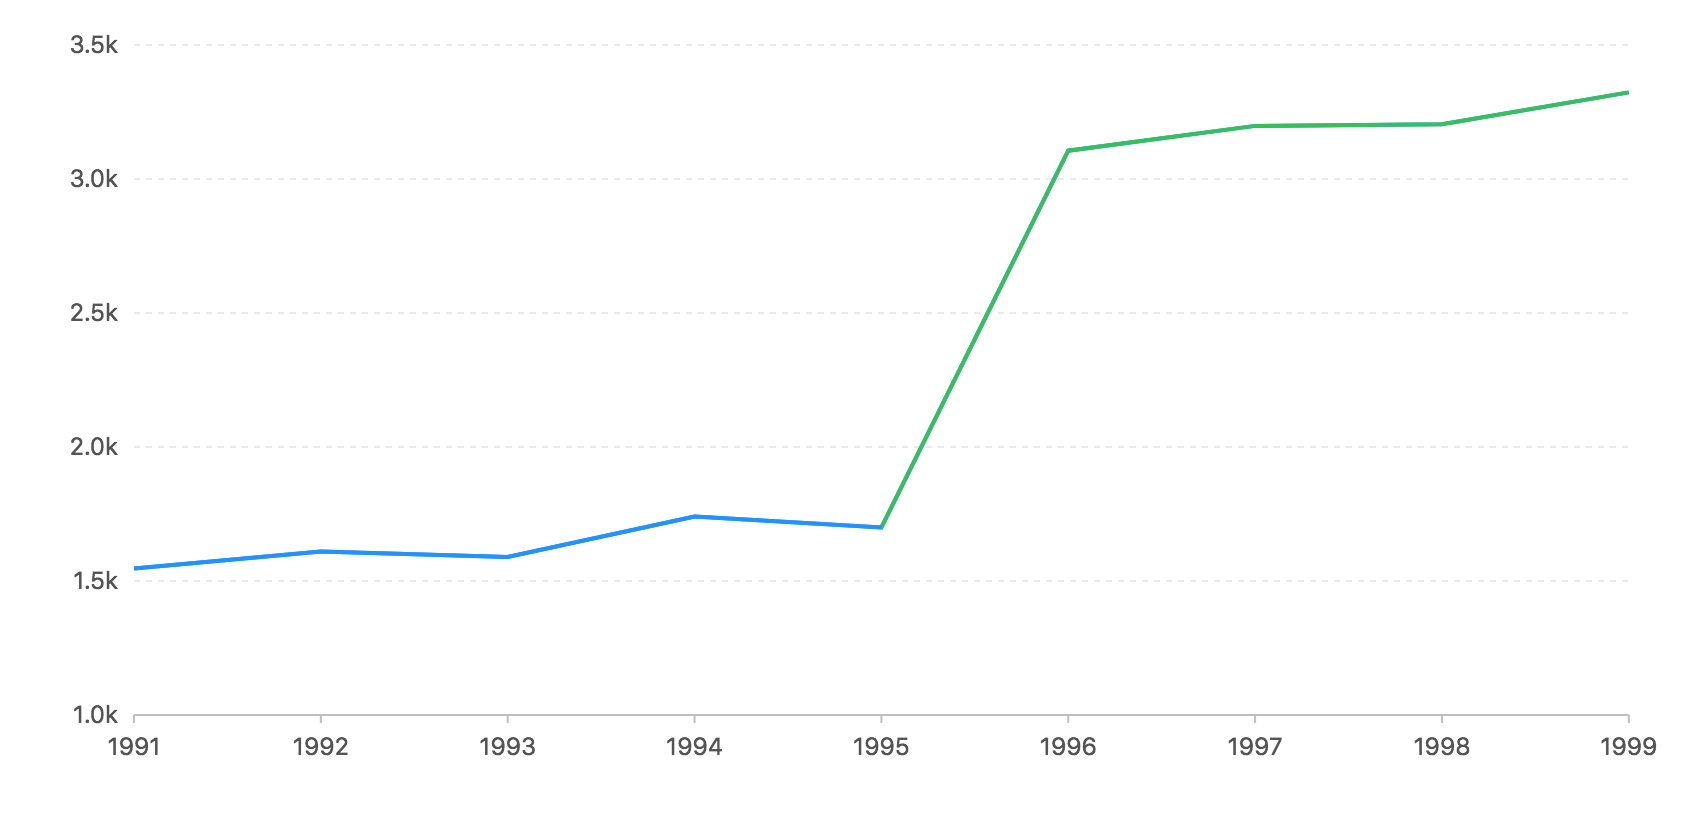
const data = [{ year: '1991', value: 15468 },{ year: '1992', value: 16100 },{ year: '1993', value: 15900 },{ year: '1994', value: 17409 },{ year: '1995', value: 17000 },{ year: '1996', value: 31056 },{ year: '1997', value: 31982 },{ year: '1998', value: 32040 },{ year: '1999', value: 33233 }];const chart = new G2.Chart({container: 'c6',forceFit: true,height: 450});chart.source(data);chart.scale({value: {min: 10000},year: {range: [ 0, 1 ]}});chart.axis('value', {label: {formatter: val => {return (val / 10000).toFixed(1) + 'k';}}});chart.tooltip({crosshairs: {type: 'line'}});chart.line().position('year*value').size(2);chart.guide().regionFilter({start: [ '1991', 'min' ],end: [ '1995', 'max' ],color: '#178fff'});chart.guide().regionFilter({start: [ '1995', 'min' ],end: [ '1999', 'max' ],color: '#2ec15a'});chart.render();
arc 辅助弧线
chart.guide().arc({top: true | false, // 指定 giude 是否绘制在 canvas 最上层,默认为 false, 即绘制在最下层start: {object} | {function} | {array}, // 辅助框起始位置,值为原始数据值,支持 callbackend: {object} | {function} | {array},// 辅助框结束位置,值为原始数据值,支持 callbackstyle: {} // 图形样式属性});
注意:
- arc 辅助弧线,仅在 polar 坐标系(Coord)下生效
dataMarker 特殊数据标注点
对图表中的某个特殊数据点进行标注。默认状态的特殊数据标注点由point、line、text三部分组成,同时开放接口对各部分是否显示及显示样式等进行设置。
chart.guide().dataMarker({top:true | false, // 指定 giude 是否绘制在 canvas 最上层,默认为true, 即绘制在最上层position: {object} | {function} | {array}, // 标注点起始位置,值为原始数据值,支持 callback ,content: {string}, // 显示的文本内容style: {text: {object},point:{object},line:{object}},//可选,文本/point/line样式display:{text:{boolean},point:{boolean},line:{boolean}},//可选,是否显示文本/point/line,默认为全部显示lineLength:{number},//可选,line长度,default为30direction:'upward' | 'downward' //可选,朝向,默认为upwaard});
注意:
- dataMarker 特殊数据标注点,适用于折线图和面积图
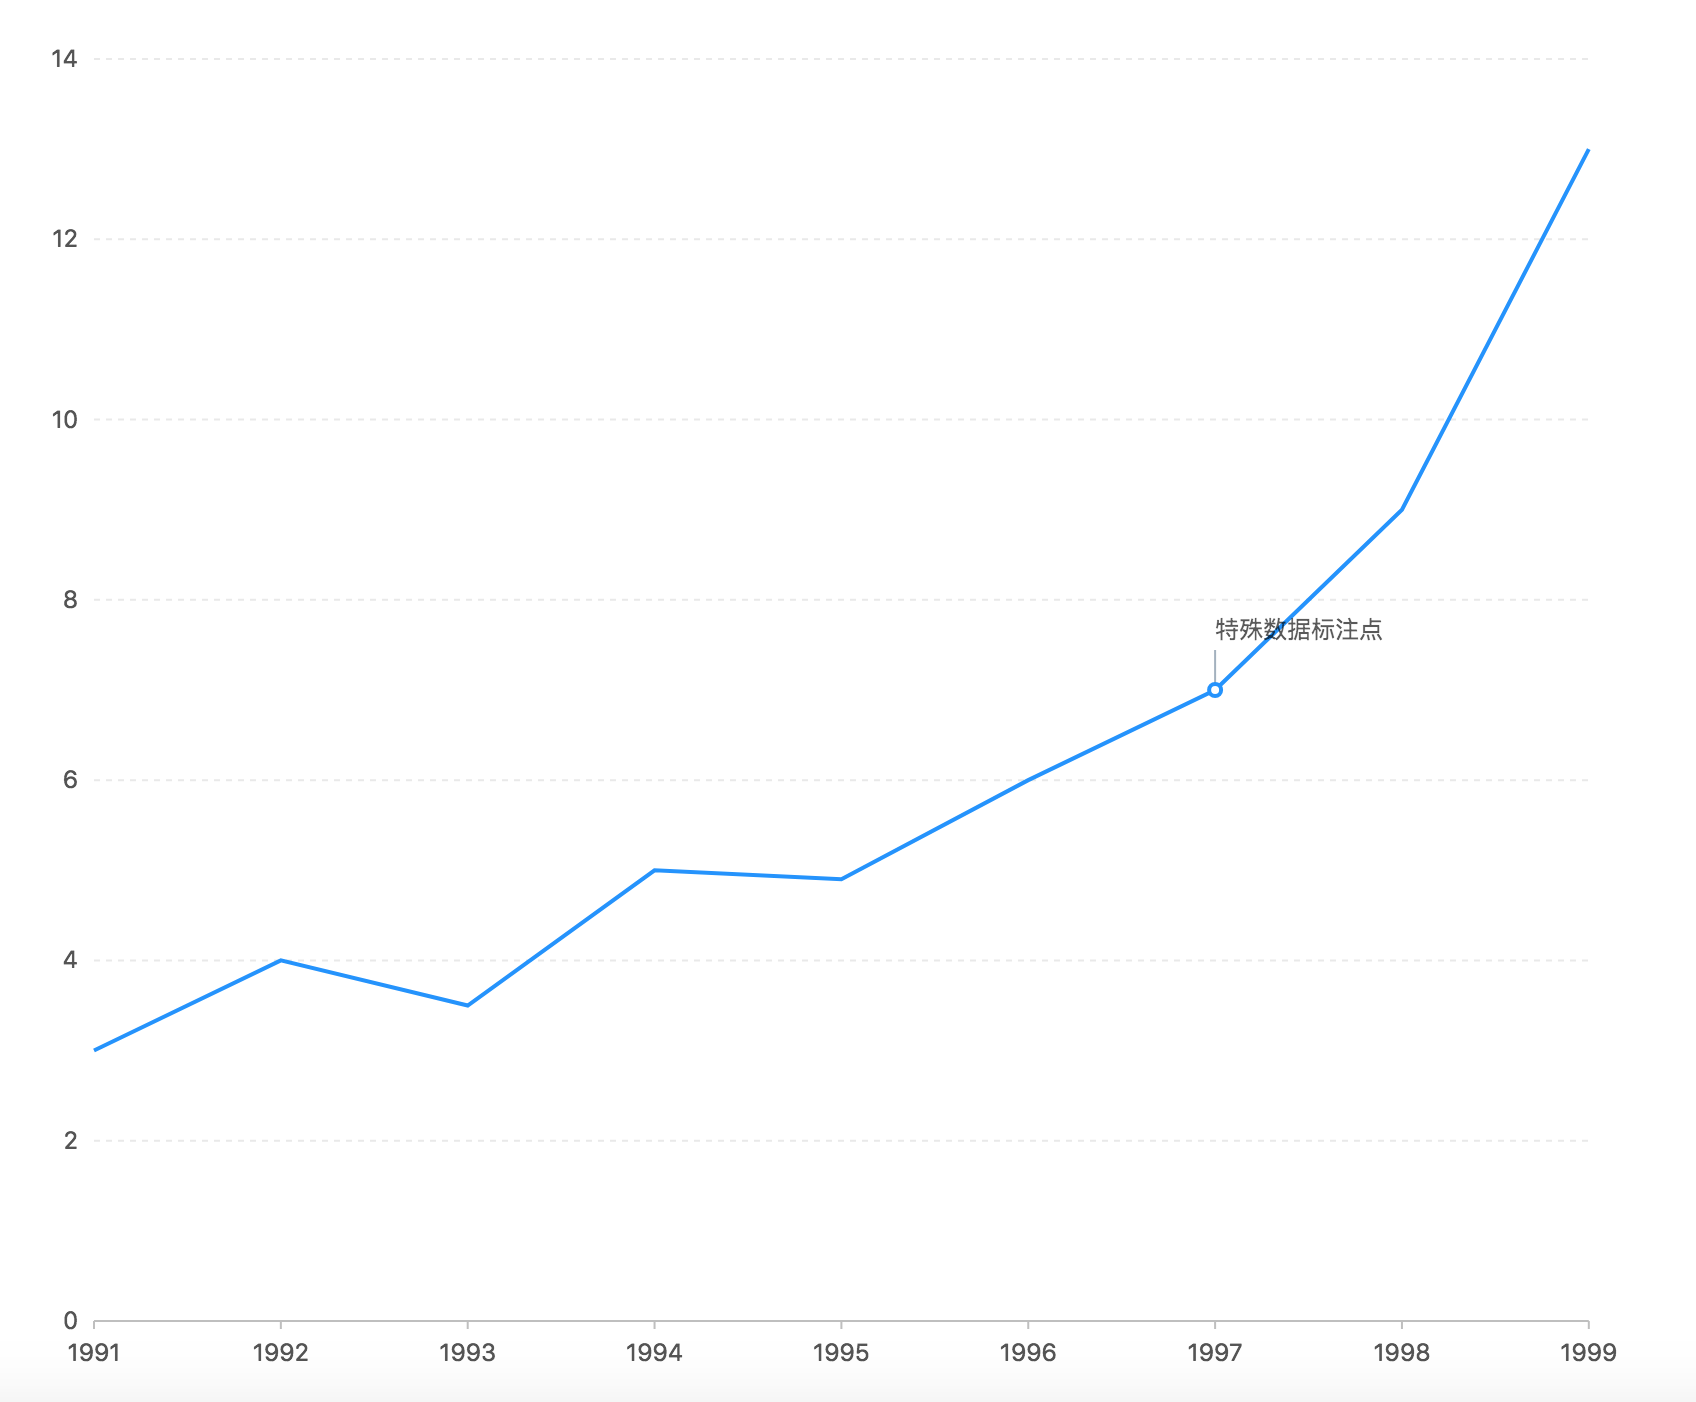
var data = [{ year: '1991',value: 3},{ year: '1992',value: 4},{ year: '1993',value: 3.5},{ year: '1994',value: 5},{ year: '1995',value: 4.9},{ year: '1996',value: 6},{ year: '1997',value: 7},{ year: '1998',value: 9},{ year: '1999',value: 13}];var chart = new G2.Chart({container: 'c7',forceFit: true,height: window.innerHeight});chart.source(data);chart.scale('value', {min: 0});chart.scale('year', {range: [0, 1]});chart.line().position('year*value');chart.guide().dataMarker({position: [ '1997', 7 ],content: '特殊数据标注点'});chart.render();
dataRegion 特殊数据区间标注
对图表中的某个特殊数据区间进行标注。
chart.guide().dataRegion({top:true | false, // 指定 giude 是否绘制在 canvas 最上层,默认为 true, 即绘制在最上层start: {object} | {function} | {array}, // 标注点起始位置,值为原始数据值,支持 callback ,end: {object} | {function} | {array}, // 标注点结束位置,值为原始数据值,支持 callback ,content: {string}, // 显示的文本内容style: {text: {object},point:{object},line:{object}},//可选,文本/point/line样式display:{text:{boolean},point:{boolean},line:{boolean}},//可选,是否显示文本/point/line,默认为全部显示lineLength:{number},//可选,line长度,default为30direction:'upward' | 'downward' //可选,朝向,默认为upwaard});
注意:
- dataRegion 特殊数据区间标注,适用于折线图和面积图
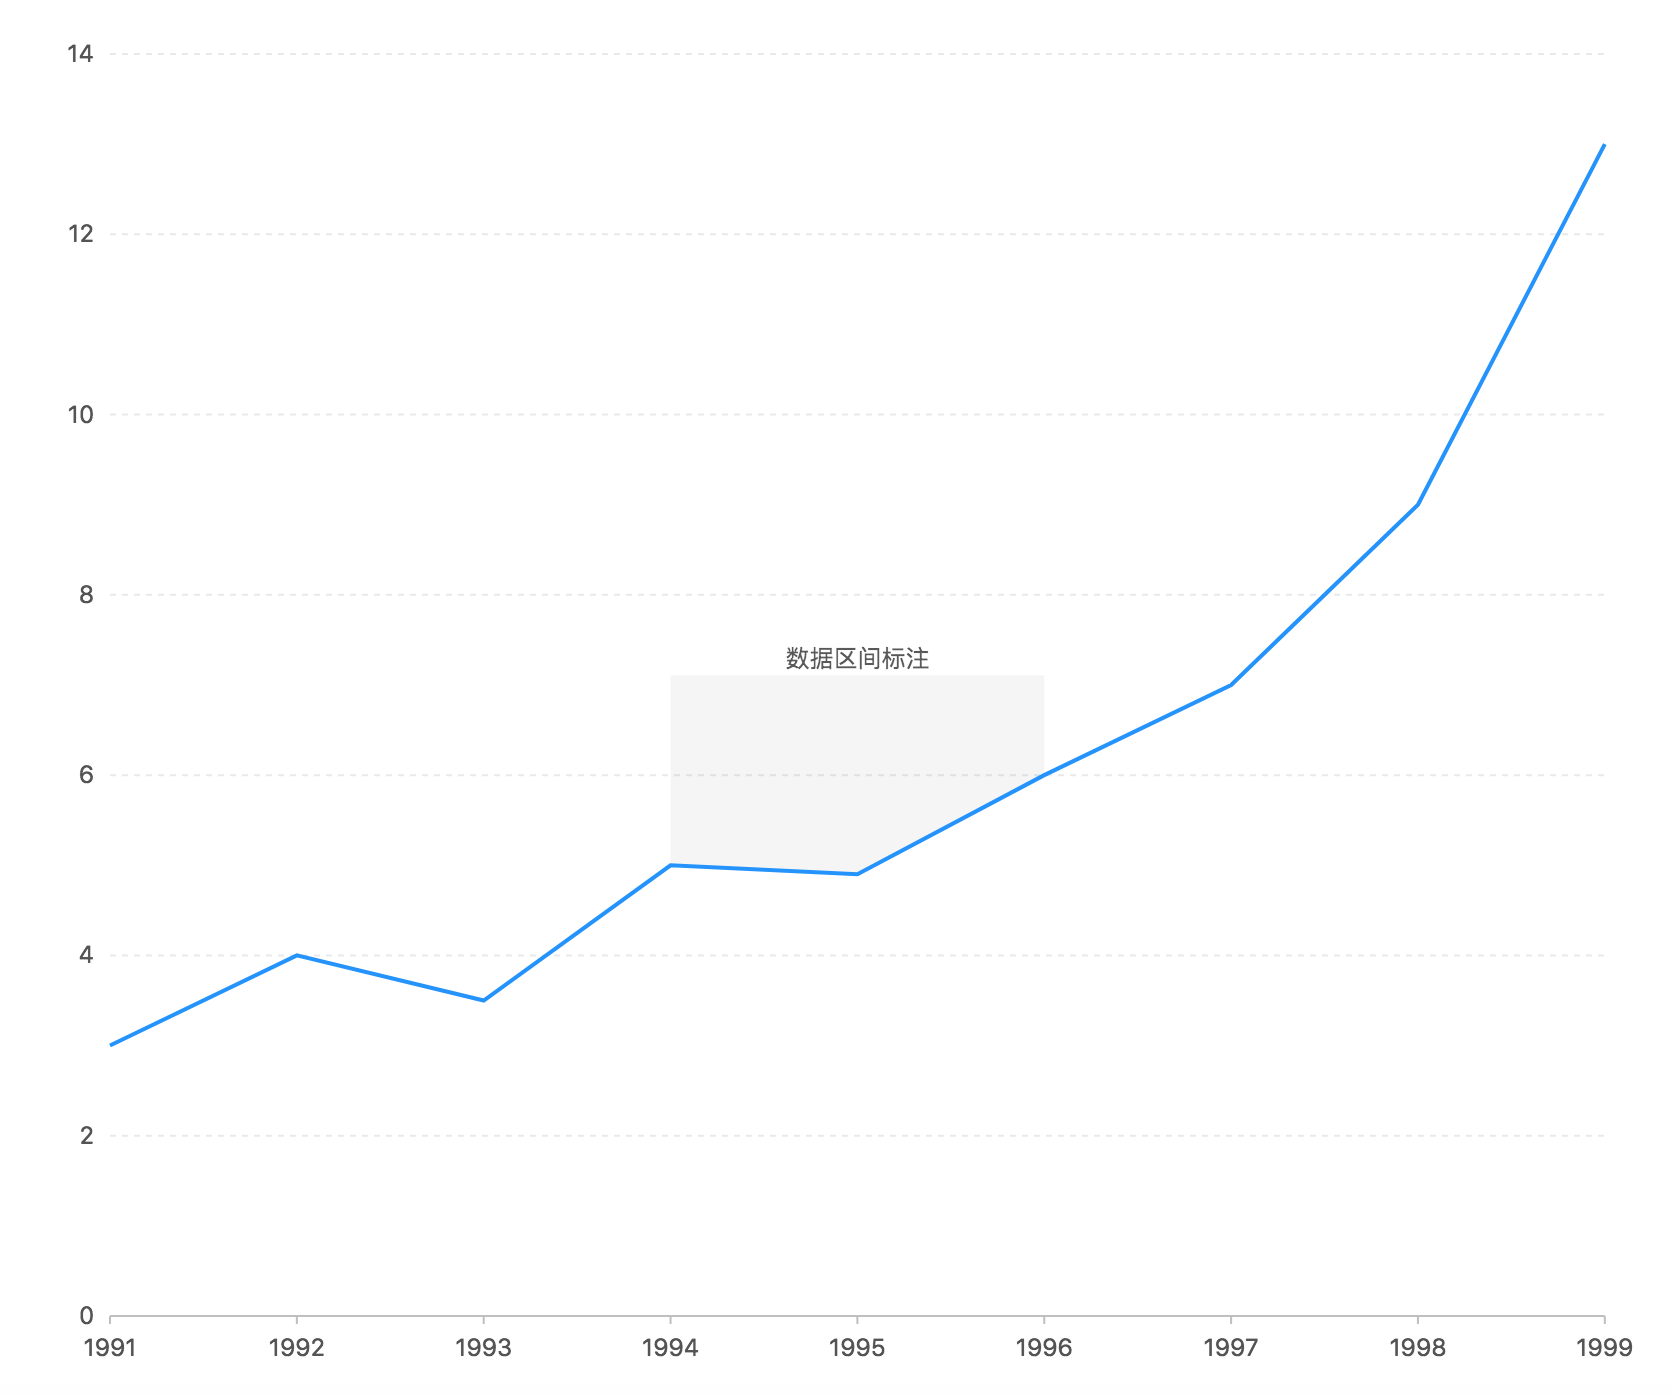
var data = [{ year: '1991',value: 3},{ year: '1992',value: 4},{ year: '1993',value: 3.5},{ year: '1994',value: 5},{ year: '1995',value: 4.9},{ year: '1996',value: 6},{ year: '1997',value: 7},{ year: '1998',value: 9},{ year: '1999',value: 13}];var chart = new G2.Chart({container: 'c8',forceFit: true,height: window.innerHeight});chart.source(data);chart.scale('value', {min: 0});chart.scale('year', {range: [0, 1]});chart.line().position('year*value');chart.guide().dataRegion({start: [ '1994', 5 ],end: [ '1996', 6 ],content: '数据区间标注',lineLength: 50});chart.render();
动态辅助标记
辅助标记接受的位置信息的参数都是原始数据值,辅助标记一旦生成后就是固定了位置,如果数据发生改变,辅助标记就需要删除掉重新创建
// 清除图表chart.clear();// 重新声明图形语法chart.point().position('carat*price');chart.guide().html([ newX, newY ], htmlstring);chart.render();
- newX,newY 是重新计算的位置
如果数据是动态更新的那么这个过程需要频繁进行,基于这种场景 guide 提供两种计算动态位置的:
可以使用’min’, ‘median’, ‘max’ 字符串代表原始值的最小值、平均值、最大值,例如: [0, ‘min’] 表示 x 轴上数值为 0,y 轴位置在数值的最小值上;
表示位置的数组可以换成回调函数,函数原型:
function(xScale, yScale) {return [];}
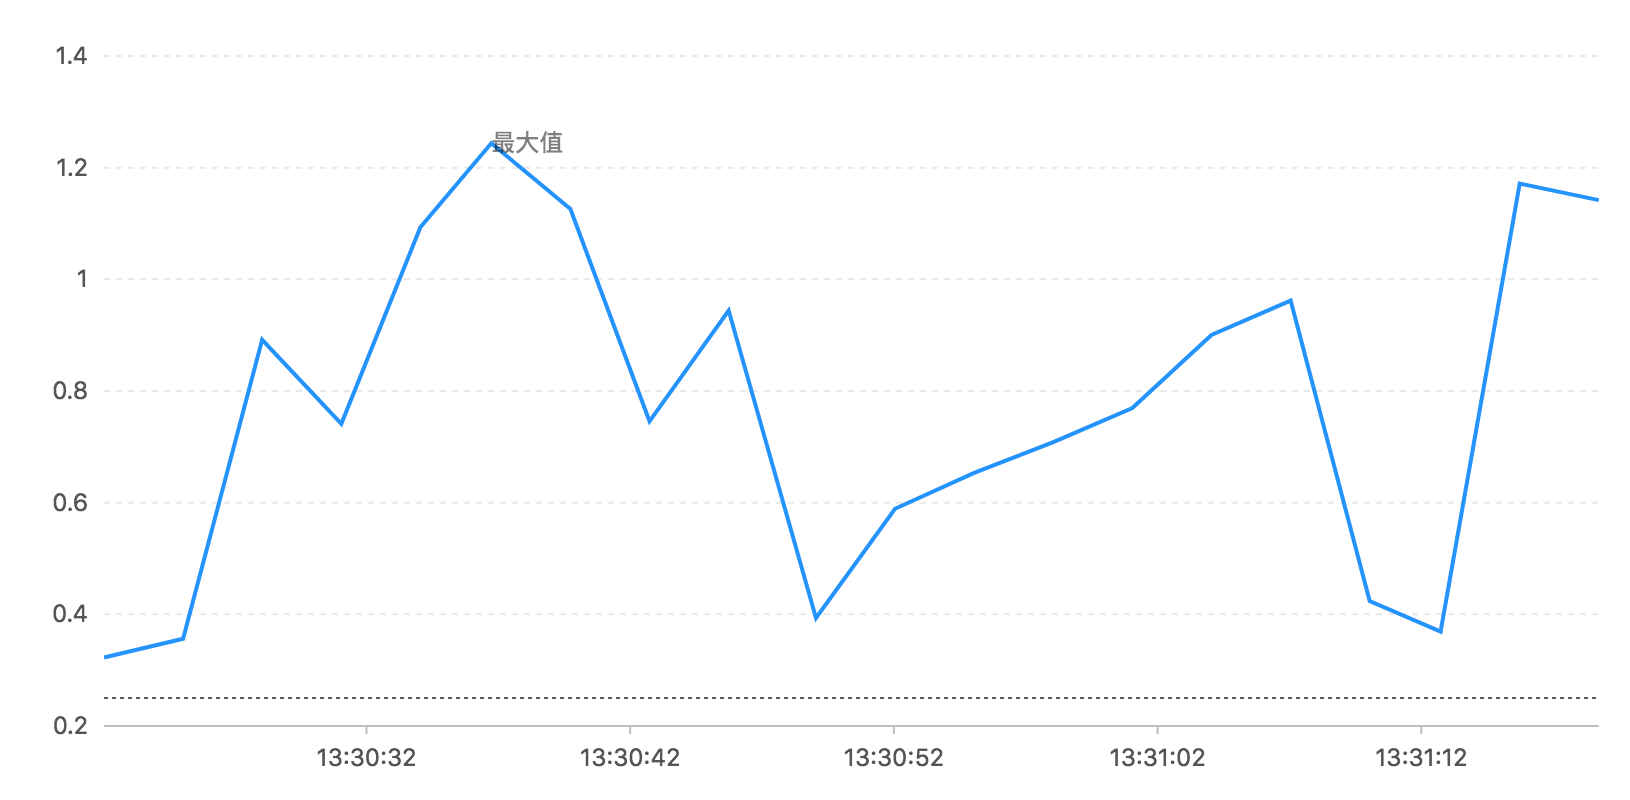
const data = [];const time = Math.floor((new Date()).getTime() / 1000) * 1000;for (let i = -19; i <= 0; i++) {data.push({time: time + i * 3 * 1000,value: Math.random() + .25});}// 查找最大值function findMax() {let maxValue = 0;let maxObj = null;data.forEach(obj => {if (obj.value > maxValue) {maxValue = obj.value;maxObj = obj;}});return maxObj;}const chart = new G2.Chart({ // 创建图表container: 'c9',forceFit: true,height: 450});chart.source(data, {time: {type: 'time',mask: 'HH:mm:ss'}});chart.line().position('time*value');// 添加一条虚线chart.guide().line({start: [ 'min', 0.25 ],end: [ 'max', 0.25]});chart.guide().text({position() {const obj = findMax();return [ obj.time, obj.value ];},content: '最大值'});chart.render();setInterval(function() {data.shift();data.push({time: new Date().getTime(),value: Math.random() + .25});chart.changeData(data);}, 3000);

若有收获,就点个赞吧
0 人点赞
