当创建一个数组之后,还可以给它增加一个维度,这在矩阵计算中经常会用到。
numpy.newaxis = NoneNone的别名,对索引数组很有用。
【例】很多工具包在进行计算时都会先判断输入数据的维度是否满足要求,如果输入数据达不到指定的维度时,可以使用newaxis参数来增加一个维度。
import numpy as npx = np.array([1, 2, 9, 4, 5, 6, 7, 8])print(x.shape) # (8,)print(x) # [1 2 9 4 5 6 7 8]y = x[np.newaxis, :]print(y.shape) # (1, 8)print(y) # [[1 2 9 4 5 6 7 8]]y = x[:, np.newaxis]print(y.shape) # (8, 1)print(y)# [[1]# [2]# [9]# [4]# [5]# [6]# [7]# [8]]
numpy.squeeze(a, axis=None)从数组的形状中删除单维度条目,即把shape中为1的维度去掉。a表示输入的数组;axis用于指定需要删除的维度,但是指定的维度必须为单维度,否则将会报错;
在机器学习和深度学习中,通常算法的结果是可以表示向量的数组(即包含两对或以上的方括号形式[[]]),如果直接利用这个数组进行画图可能显示界面为空(见后面的示例)。我们可以利用squeeze()函数将表示向量的数组转换为秩为1的数组,这样利用 matplotlib 库函数画图时,就可以正常的显示结果了。
【例】
import numpy as npx = np.arange(10)print(x.shape) # (10,)x = x[np.newaxis, :]print(x.shape) # (1, 10)y = np.squeeze(x)print(y.shape) # (10,)
【例】
import numpy as npx = np.array([[[0], [1], [2]]])print(x.shape) # (1, 3, 1)print(x)# [[[0]# [1]# [2]]]y = np.squeeze(x)print(y.shape) # (3,)print(y) # [0 1 2]y = np.squeeze(x, axis=0)print(y.shape) # (3, 1)print(y)# [[0]# [1]# [2]]y = np.squeeze(x, axis=2)print(y.shape) # (1, 3)print(y) # [[0 1 2]]y = np.squeeze(x, axis=1)# ValueError: cannot select an axis to squeeze out which has size not equal to one
【例】
import numpy as npimport matplotlib.pyplot as pltx = np.array([[1, 4, 9, 16, 25]])print(x.shape) # (1, 5)plt.plot(x)plt.show()
【例】
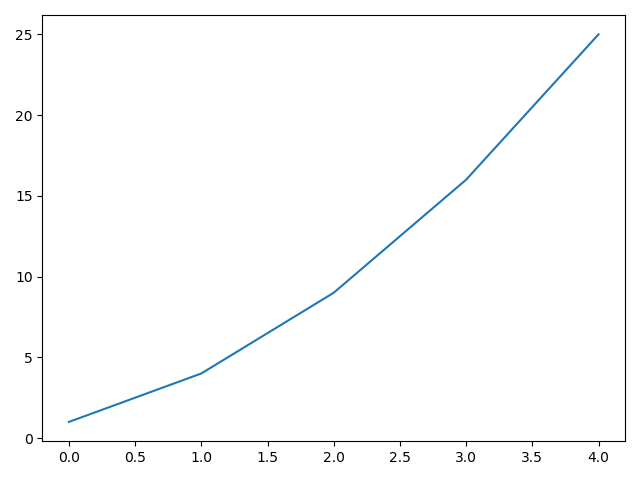
import numpy as npimport matplotlib.pyplot as pltx = np.array([[1, 4, 9, 16, 25]])x = np.squeeze(x)print(x.shape) # (5, )plt.plot(x)plt.show()

若有收获,就点个赞吧
0 人点赞
