将数据通过图形的方式呈现,也是经历过一段时间的发展的。除了该页中提到的2本书外,还有:
- The concepts of exploring a data set visually were pioneered by John Tukey in the 1960s and 1970s. Tukey consolidated his many ideas on data exploration into a book in the late 1970s, John Tukey, Exploratory Data Analysis, 1977, Addison-Westley.
- Bill Cleveland documented his seminal work in visualization of complex data sets in his book, William S. Cleveland, Visualizing Data, 1993, Hobart Press.
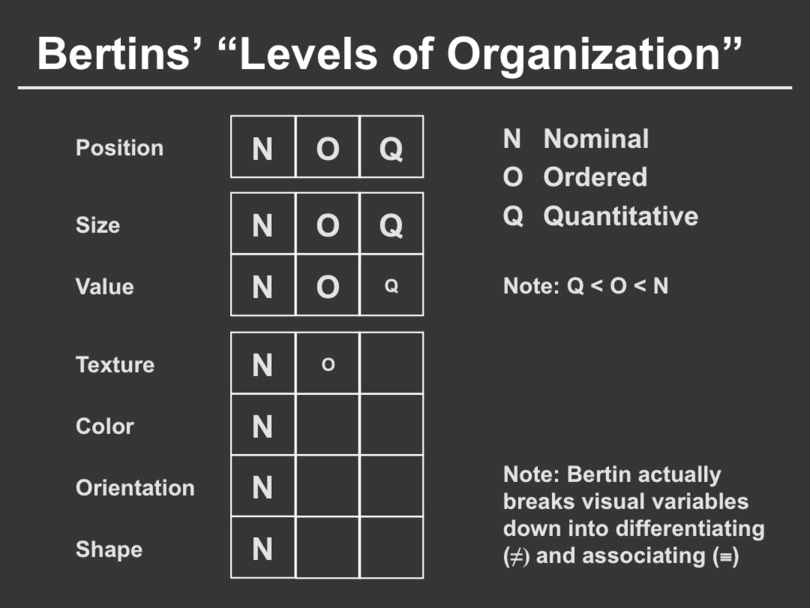
数据的类型
Nominal (labels)
- 如水果的名称
- 操作:等于、不等于
- Ordered
- 如肉制品等级
- 操作:等于、不等于、大于、小于、大于等于、小于等于
- Interval (Location of zero arbitrary) 零点不固定
- 如日期,地址编号。不能直接比较,只能比较差异。如8号不是4号的2倍,但以本月初为起点时,8号是8天,是4天的2倍。
- 操作:等于、不等于、大于、小于、大于等于、小于等于、减
- Ration (zero fixed) 零点固定
- 如物理测量值:长度、质量、温度。计数和计量等。
- 操作:等于、不等于、大于、小于、大于等于、小于等于、减、加


