案例
1. 项目背景
粗放式:商业模式打通
精细化:数据化运营
用户消费偏好
高贡献商品
产品bug
随着电商⾏业近⼏年的迅猛发展,电⼦商务从早些年的粗放式经营,逐步转化为精细化运营。随着平台数据量的不断积累,通过数据分析挖掘消费者的潜在需求,消费偏好成为平台运营过程中的重要环节。本项⽬基于某电商平台⽤户⾏为数据,在MySQL关系型数据库,探索⽤户⾏为规律,寻找⾼价值⽤户;分析商品特征,寻找⾼贡献商品;分析产品功能,优化产品路径。
1.1 分析流程
记录原始数据——>清洗数据——>指标体系
记录原始数据:用户行为产生的记录
清洗数据:空值,重复值,数据处理
指标体系:你要统计分析哪些指标?
指标体系构建和设计应该提前进行
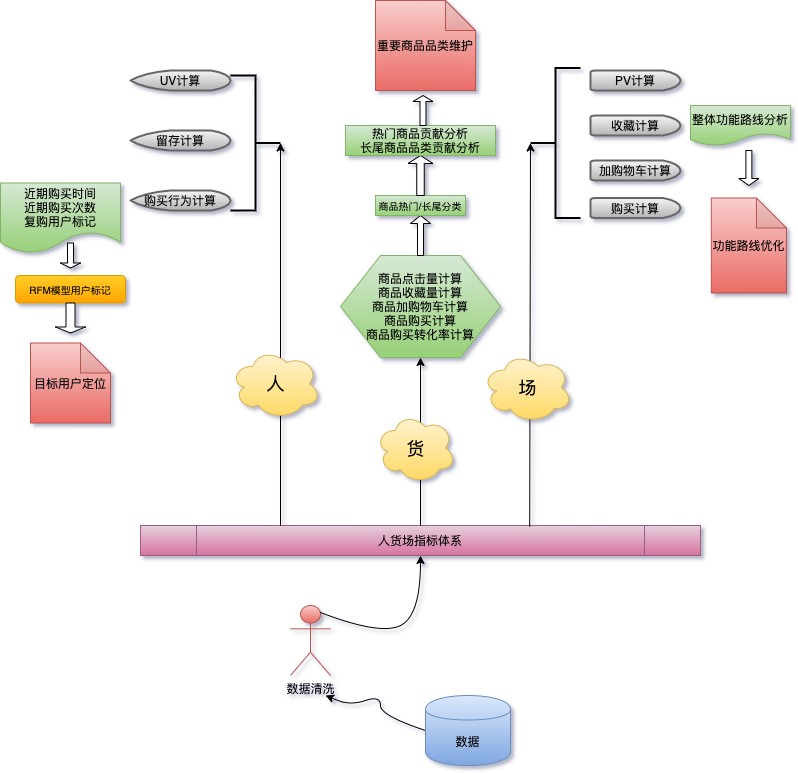
本例中指标体系构建基于人货场理论
—用户数据分析 PV,UV,留存,购买行为(购买什么,购买品类等),RFM模型
—商品数据分析 点击,收藏,加购,购买,购买转化,热门等
—平台本身数据分析 PV 收藏,加购,购买 可能出现平台页面做的不好**
 |
|---|
2. 使用“人货场”拆解方式建立指标体系
最终结果:评价“**⽤户,商品,平台”**三者质量
⼈货场
「⼈」(⽤户) 是整个运营的核⼼。所有举动都围绕着,如何让更多的⼈有购买⾏为,让他们买的更多,买的更贵。所以对⼈的洞察是⼀切⾏为的基础。⽬前平台上的主⼒消费⼈群有哪些特征,他们对货品有哪些需求,他们活跃在哪些场**,还有哪些有消费⼒的⼈⽬前不在平台上,对这些问题的回答指向了接下来的⾏动。
指标 |
细化指标 | 说明 |
|---|---|---|
| 浏览 | PV | (PageView)是⻚⾯浏览量 |
UV |
(Unique Visitor)是⼀定时间内访问⽹⻚的⼈数,正式名称独⽴访客数(⼀个⽹站或者⼀个⻚⾯) | |
| 流量质量 | PV/UV |
浏览深度 |
| 盈利能力 | ROI | 投资回报率(ROI)=年利润或年均利润/投资总额×100% |
| 成交⽤户 | 新客数 | (⼀般当天的算新⽤户,当⽇激活或者/新增)(首单) |
| ⽼客数 | ||
| 客单价 | 当⽇消费总价/顾客数(新+⽼)—-客单价应该是稳的,突然多/少,购买⼒特别强的,疫情影响客单价下降 | |
| DAU | ⽇活跃⽤户 | |
| MAU | ⽉活跃⽤户 | |
| … | … | … |
「货」就对应供给,涉及到了货品分层,哪些是红海(销量高,利润少,竞争多),哪些是蓝海(销量少,利润高,竞争少),如何进⾏动态调整,是要做⾃营还是平台,以满⾜消费者的需求。
「场」就是消费者在什么场景下,以什么样的⽅式接触到了这个商品。早期的导购做的⽐较简单,
⽬前的场就⽐较丰富,但也暴露了淘宝和京东在导购⽅⾯的⼀些问题。⽐如内容营销,⽬前最好的可能是微信的 KOL(意见领袖)⽣态和⼩红书,甚⾄微博,⽽不在电商⾃⼰的场。如何做⼀个全域的打通,和消费者进⾏多触点的接触,⽐如社交和电商联动,来完成销售转化,这就是腾讯和阿⾥⼀直都在讲的「全域营销」。
平台可以认为就是电商网站,但是现状有所延申往前引流,往后售后营销
3. 确认问题
本次分析的⽬的是想通过对⽤户⾏为数据进⾏分析,为以下问题提供解释和改进建议:
1) 基于漏⽃模型的⽤户购买流程各环节分析指标,确定各个环节的转换率,便于找到需要改进的环节;——》场
2) 商品分析:找出热销商品,研究热销商品特点;——》货
3) 基于RFM模型找出核⼼付费⽤户群,对这部分⽤户进⾏精准营销。——》人
4. 准备⼯作
4.1 数据读取(⽤户⾏为数据)
表结构
| 列名 | 说明 |
|---|---|
| user_id | ⽤户ID |
| item_id | 商品ID |
| behavior_type | ⽤户⾏为类型(1-曝光;2-购买;3-加⼊购物⻋;4-加⼊收藏夹。) |
| user_geohash | 地理位置 |
| item_category | 品类ID |
| time | ⽤户⾏为发⽣的时间 |
use lagou;create table o_retailers_trade_user(user_id int (9),item_id int (9),behavior_type int (1),user_geohash varchar (14),item_category int (5),time varchar (13));
注意:样例数据的时间格式如:2019-12-06 02 年-⽉-⽇ ⼩时(24进制)
4.2 数据预处理
增加新列date_time(datetime),dates(char,年⽉⽇),便于后续时间维度分析;
-- 增加新列date_time、datesalter table o_retailers_trade_user add column date_time datetime null;update o_retailers_trade_userset date_time =str_to_date(time,'%Y-%m-%d %H') ;-- %H可以表示0-23;⽽%h表示0-12alter table o_retailers_trade_user add column dates char(10) null;update o_retailers_trade_userset dates=date(date_time);desc o_retailers_trade_user;select * from o_retailers_trade_user limit 5;
重复值处理:创建新表a,并插⼊5W条⽆重复数据
-- 创建新表a,并插⼊5W条数据。create table temp_trade like o_retailers_trade_user;insert into temp_trade select distinct * from o_retailers_trade_user limit50000;
5. 指标体系建设
5.1 ⽤户指标体系
5.1.1 RFM模型分析
uv、pv、留存率(按⽇)统计
/*需求:uv、pv、浏览深度(按⽇)统计pv:统计behavior_type=1的记录数,需要按⽇统计(分组)uv: 统计distinct user_id 的数量,需要按⽇统计(分组)浏览深度:pv/uv*/-- pv 进⾏cout时候,如果behavior_type=1进⾏计算,如果不是,不进⾏计算selectdates,count( distinct user_id ) as 'uv',count( if(behavior_type=1,user_id,null)) as 'pv',count( if(behavior_type=1,user_id,null))/count( distinct user_id ) as'pv/uv'from temp_tradegroup bydates;
-- ⽤户留存with temp_table_trades as(select a.dates,count(distinct b.user_id) as device_v,count(distinct if(datediff(b.dates,a.dates)=0,b.user_id,null)) asdevice_v_remain0,count(distinct if(datediff(b.dates,a.dates)=1,b.user_id,null)) asdevice_v_remain1,count(distinct if(datediff(b.dates,a.dates)=2,b.user_id,null)) asdevice_v_remain2,count(distinct if(datediff(b.dates,a.dates)=3,b.user_id,null)) asdevice_v_remain3,count(distinct if(datediff(b.dates,a.dates)=4,b.user_id,null)) asdevice_v_remain4,count(distinct if(datediff(b.dates,a.dates)=5,b.user_id,null)) asdevice_v_remain5,count(distinct if(datediff(b.dates,a.dates)=6,b.user_id,null)) asdevice_v_remain6,count(distinct if(datediff(b.dates,a.dates)=7,b.user_id,null)) asdevice_v_remain7,count(distinct if(datediff(b.dates,a.dates)=15,b.user_id,null)) asdevice_v_remain15,count(distinct if(datediff(b.dates,a.dates)=30,b.user_id,null)) asdevice_v_remain30from(selectuser_id,datesfromtemp_tradegroup byuser_id,dates ) aleft join(selectdates,user_idfrom temp_tradeGROUP BY dates,user_id) b on a.user_id = b.user_idwhere b.dates >= a.datesgroup by a.dates)select dates, device_v_remain0,concat(cast((device_v_remain1/device_v_remain0)*100 as DECIMAL(18,2)),'%') as'day_1%',concat(cast((device_v_remain2/device_v_remain0)*100 as DECIMAL(18,2)),'%') as'day_2%',concat(cast((device_v_remain3/device_v_remain0)*100 as DECIMAL(18,2)),'%') as'day_3%',concat(cast((device_v_remain4/device_v_remain0)*100 as DECIMAL(18,2)),'%') as'day_4%',concat(cast((device_v_remain5/device_v_remain0)*100 as DECIMAL(18,2)),'%') as'day_5%',concat(cast((device_v_remain6/device_v_remain0)*100 as DECIMAL(18,2)),'%') as'day_6%',concat(cast((device_v_remain7/device_v_remain0)*100 as DECIMAL(18,2)),'%') as'day_7%',concat(cast((device_v_remain15/device_v_remain0)*100 as DECIMAL(18,2)),'%') as'day_15%',concat(cast((device_v_remain30/device_v_remain0)*100 as DECIMAL(18,2)),'%') as'day_30%'from temp_table_trades;
5.1.2 RFM模型分析
- RFM模型:R部分
-- RFM模型-- 1.建⽴r视图,将近期购买时间提取到R临时表中drop view if EXISTS user_recency;create view user_Recencyasselect user_id ,max(dates) as rec_buy_timefrom temp_tradewhere behavior_type='2'group by user_idorder by rec_buy_time desc;-- 2.建⽴R等级划分视图:将客户近期购买时间进⾏等级划分,越接近2019-12-18号R越⼤;drop view if exists r_clevel;create view r_clevelasselect user_id,rec_buy_time,datediff('2019-12-18',rec_buy_time)as recen_num,(casewhen datediff('2019-12-18',rec_buy_time)<=2 then 5when datediff('2019-12-18',rec_buy_time)<=4 then 4when datediff('2019-12-18',rec_buy_time)<=6 then 3when datediff('2019-12-18',rec_buy_time)<=8 then 2else 1 end) as r_valuefrom user_Recency;
- RFM模型:F部分(⼀定时间内的消费频率)
-- 1.建⽴F视图create view frenq_valueasselect user_id ,count(user_id) as buy_frenqfrom temp_tradewhere behavior_type='2'group by user_id;-- 2.建⽴F等级划分create view f_clevelasselect user_id,buy_frenq,(case when buy_frenq<=2 then 1when buy_frenq<=4 then 2when buy_frenq<=6 then 3when buy_frenq<=8 then 4else 5 end) as 'f_values'from frenq_value;select * from f_clevel;
- 整合结果
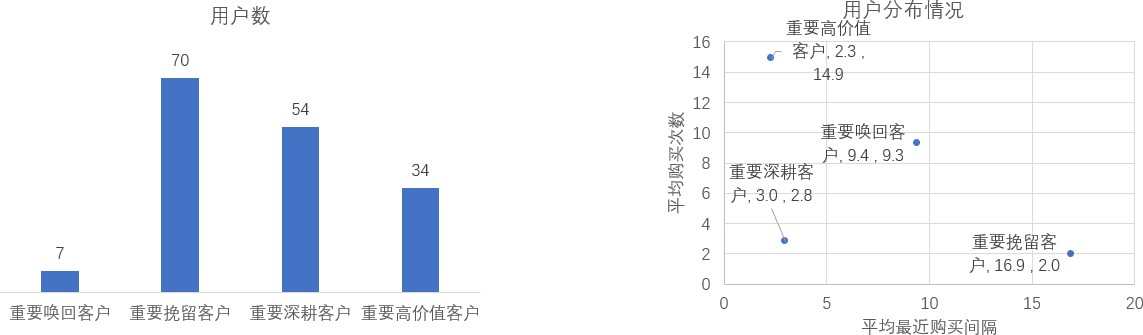
本次数据中通过最近消费(R)和消费频率(F)建⽴RFM模型
重要⾼价值客户:指最近⼀次消费较近⽽且消费频率较⾼的客户; 重要唤回客户:指最近⼀次消费较远且消费频率较⾼的客户;
重要深耕客户:指最近⼀次消费较近且消费频率较低的客户; 重要挽留客户:指最近⼀次消费较远且消费频率较低的客户;
我们按照最近⼀次消费的均值和消费频率的均值定⾼低界限。-- 将⽤户整合-- 1.R平均值SELECT avg(r_value) as 'r_avg' FROM r_clevel; -- 2.7939-- 2.F平均值select avg(f_values) as 'f_avg' from f_clevel; -- 2.2606-- 3.⽤户⼋⼤类等级划分,由于该数据没有M值,故只建⽴了4个分类drop view if exists RFM_inall;create view RFM_inallasselect a.*,b.f_values,(casewhen a.r_value>2.7939 and b.f_values>2.2606 then '重要⾼价值客户'when a.r_value<2.7939 and b.f_values>2.2606 then '重要唤回客户'when a.r_value>2.7939 and b.f_values<2.2606 then '重要深耕客户'when a.r_value<2.7939 and b.f_values<2.2606 then '重要挽留客户'END) as user_classfrom r_clevel a, f_clevel bwhere a.user_id=b.user_id;SELECT count(user_id) as user_v,user_class from RFM_inall GROUP BY user_class;
5.2 商品指标体系
商品的点击量 收藏量 加购量 购买次数 购买转化(该商品的所有⽤户中有购买转化的⽤户⽐;) 按照商品进⾏分组统计
-- 商品的点击量 收藏量 加购量 购买次数 购买转化select * from temp_trade;select item_id,sum(case when behavior_type=1 then 1 else 0 end) as'pv',sum(case when behavior_type=4 then 1 else 0 end) as'fav',sum(case when behavior_type=3 then 1 else 0 end) as'cart',sum(case when behavior_type=2 then 1 else 0 end) as'buy',count(distinct case when behavior_type=2 then user_id else nullend)/count(distinct user_id) as buy_ratefrom temp_tradegroup by item_idorder by buy desc;
对应品类的点击量 收藏量 加购量 购买次数 购买转化(该商品品类的所有⽤户中有购买转化的⽤户
⽐;)
select item_category,sum(case when behavior_type=1 then 1 else 0 end) as'pv',sum(case when behavior_type=4 then 1 else 0 end) as'fav',sum(case when behavior_type=3 then 1 else 0 end) as'cart',sum(case when behavior_type=2 then 1 else 0 end) as'buy',count(distinct case when behavior_type=2 then user_id else nullend)/count(distinct user_id) as buy_ratefrom temp_tradegroup by item_categoryorder by buy desc;
5.3 平台指标体系
1.⾏为指标:
点击次数 收藏次数 加购物⻋次数 购买次数 购买转化(该平台当⽇的所有⽤户中有购买转化的⽤户⽐)
-- 每⽇的分析(1-4,分别表示点击pv、购买buy、加购物⻋cart、喜欢fav)select dates,count(1) as '每⽇的总数',sum(case when behavior_type=1 then 1 else 0 end) as'pv',sum(case when behavior_type=2 then 1 else 0 end) as'buy',sum(case when behavior_type=3 then 1 else 0 end) as'cart',sum(case when behavior_type=4 then 1 else 0 end) as'fav',count(distinct case when behavior_type=2 then user_id else nullend)/count(distinct user_id) as buy_ratefrom temp_tradegroup by dates;
⾏为路径分析
**
-- ⾏为路径分析-- ⾏为路径组建基础视图drop view product_user_way;create view product_user_way as selecta.*from(selectuser_id,item_id,lag ( behavior_type, 4 ) over ( partition by user_id, item_id order bydate_time ) lag_4,lag ( behavior_type, 3 ) over ( partition by user_id, item_id order bydate_time ) lag_3,lag ( behavior_type, 2 ) over ( partition by user_id, item_id order bydate_time ) lag_2,lag ( behavior_type ) over ( partition by user_id, item_id order bydate_time ) lag_1,behavior_type,rank ( ) over ( partition by user_id, item_id order by date_time desc ) asrank_dn # 倒数第⼏个⾏为fromtemp_trade) awherea.rank_dn = 1and behavior_type = 2-- 查询该路径下有多少购买⽤户数selectconcat(ifnull( lag_4, '空' ),"-",ifnull( lag_3, '空' ),"-",ifnull( lag_2, '空' ),"-",ifnull( lag_1, '空' ),"-",behavior_type) as user_way,count( distinct user_id ) as user_count -- 该路径下购买⽤户数fromproduct_user_waygroup byconcat(ifnull( lag_4, '空' ),"-",ifnull( lag_3, '空' ),"-",ifnull( lag_2, '空' ),"-",ifnull( lag_1, '空' ),"-",behavior_type);
6. 结论
6.1 ⽤户分析
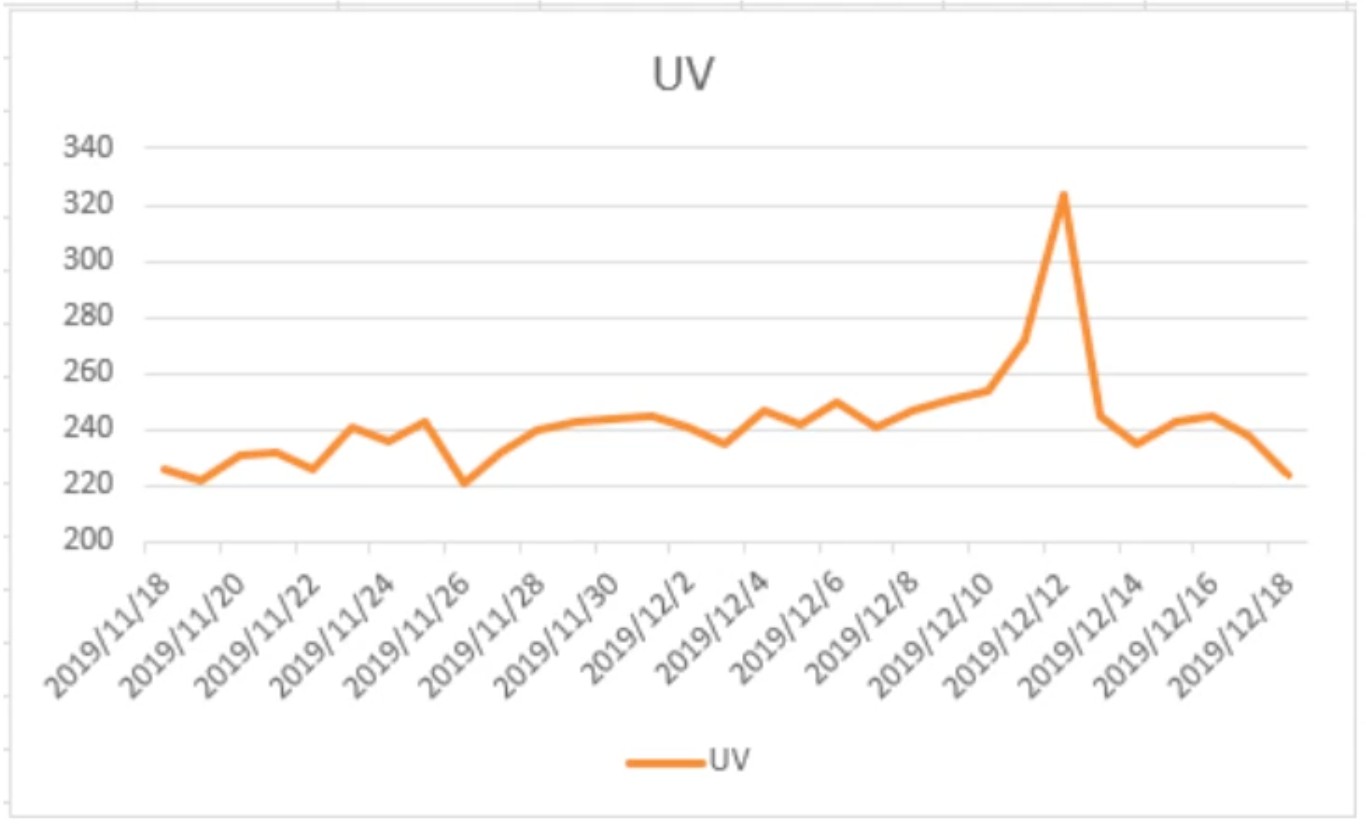
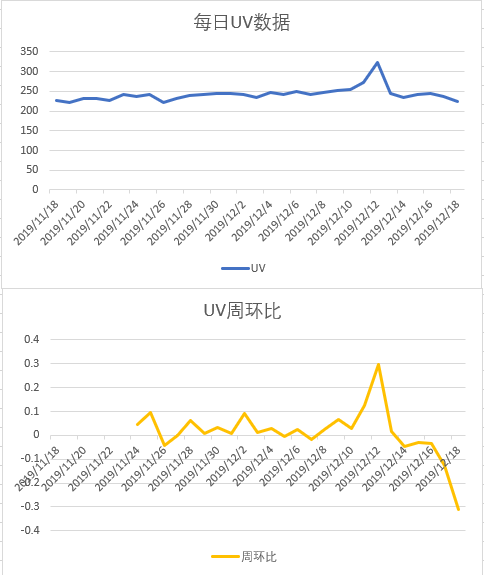
UV异常分析:每⽇UV数据中,明显异常点为双⼗⼆活动造成,该影响为已知影响。
对于UV周环⽐的分析:⽇常周环⽐数据⼤多⼤于0,说明⽤户程⼀定上升趋势,其中如11⽉26⽇、12⽉ 2⽇、12⽉7⽇等的数据为下降数据,需要结合其他数据做进⼀步的下降原因分析。双⼗⼆活动后⽤户周 环⽐会相应下降,为正常原因。
猜测可能的问题有:
内部问题:产品BUG(⽹站bug)、策略问题(周年庆活动结束了)、营销问题(代⾔⼈换了)等;
外部问题:竞品活动问题(其他平台⼤酬宾),政治环境问题(进⼝商品限制),舆情⼝碑问题(平台 商品爆出质量问题)等;
 |
|---|
6.2 ⽤户精细化运营X
通过RFM模型中的⽤户最近⼀次购买时间、⽤户消费频次分析,分拆得到以下重要⽤户。
可以在后续精细化运营场景中直接使⽤细分⽤户,做差异化运营:
对⾼价值客户做VIP服务设计,增加⽤户粘性同时通过设计优惠券提升客户消费; 对深耕客户做⼴告、推送刺激,提升消费频次;
对挽留客户做优惠券、签到送礼策略,增加挽留⽤户粘性; 对唤回客户做定向⼴告、短信召回策略,尝试召回⽤户。
 |
|---|
6.3 商品分析
热销商品品类如下所示。
其中’5027‘、’5399‘品类购买转化率较其余商品品类偏低,需要结合更多数据做进⼀步解读。(可能的原 因:
品类⾃有特性导致⽤户购买较低,⽐如⾮必需品、奢侈品等等。)
| item_category | pv | fav | cart | buy | buy_rate |
|---|---|---|---|---|---|
| 13230 | 1481 | 2 | 35 | 43 | 12.5% |
| 5894 | 1336 | 2 | 20 | 36 | 12.4% |
| 1863 | 1461 | 11 | 41 | 34 | 11.4% |
| 6513 | 1030 | 7 | 29 | 31 | 13.4% |
| 11279 | 767 | 4 | 22 | 25 | 12.6% |
| 10894 | 491 | 2 | 15 | 20 | 12.6% |
| 5027 | 1498 | 2 | 27 | 19 | 7.3% |
| 2825 | 608 | 0 | 11 | 15 | 9.3% |
| 5399 | 1131 | 4 | 18 | 15 | 4.9% |
| 3628 | 316 | 6 | 6 | 13 | 8.0% |
6.4 产品功能路径分析
以下为主要购买路径。可以发现⽤户多以直接购买为主;添加购物⻋的购买在主要购买路径中数量较 少。后续的产品加购功能和产品收藏功能还需要结合更多数据做改进⽅案。
| user_way | uv |
|---|---|
| 空-空-空-空-2 | 146 |
| 空-空-空-1-2 | 64 |
| 空-空-1-1-2 | 10 |
| 空-空-2-1-2 | 2 |
| 空-空-空-3-2 | 2 |
| 空-1-1-1-2 | 1 |
| 空-空-1-3-2 | 1 |

若有收获,就点个赞吧
0 人点赞
