树是图中一种特殊的数据结构。其特殊的性质、优美的结构,使得树形图在我们日常中广泛使用。比如,世界杯淘汰赛的晋级图,就是一个典型的树形数据可视化的案例。

下面我们将与大家探讨,如何使用 G6 快速实现这幅图。
场景准备
数据准备
{"roots": [{"teamA": "法国","flagA": "https://gw.alipayobjects.com/zos/rmsportal/yHYaCVIPRwEmmjbNqJjW.jpg","teamB": "克罗地亚","flagB": "https://gw.alipayobjects.com/zos/rmsportal/LJoAlBjTxagRLoNgSVmU.jpg","scoreA": 4,"scoreB": 2,"children": [{"teamA": "法国","flagA": "https://gw.alipayobjects.com/zos/rmsportal/yHYaCVIPRwEmmjbNqJjW.jpg","teamB": "比利时","flagB": "https://gw.alipayobjects.com/zos/rmsportal/tUwmQwmljZAvTXtljXcV.jpg","scoreA": 1,"scoreB": 0,"children": [……
在开始绘制树形图之前,我们先设置好一个 dom,并配上底图:
<style>#mountNode {width: 760px;height: 744px;background: url(https://gw.alipayobjects.com/zos/rmsportal/OSujrQtOvnOJVzRLmfIP.png);}</style><div id='mountNode'></div>

自定义节点-竞赛卡片
我们先来注册一个 node ,给它取个名字,就叫”card”(卡片)好了。
G6.registerNode('card', {});
draw 是自定义图项的最小接口,我们需要通过操作绘图引擎 G 来生成竞赛卡片。

draw(item) {const group = item.getGraphicGroup();const model = item.getModel();const scoreTextStyle = {textAlign: 'center',fontWeight: 900,fontSize: 14,fill: '#000'};const teamNameTextStyle = {textAlign: 'center',fontSize: 12,fill: 'rgba(0, 0, 0, 0.45)'};const width = 134;const height = 60;const keyShape = group.addShape('rect', {attrs: {x: 0,y: 0,width,height,fill: '#fff',radius: 4,}});group.addShape('image', {attrs: {x: 8,y: 8,width: 40,height: 24,img: model.flagA}});group.addShape('image', {attrs: {x: 86,y: 8,width: 40,height: 24,img: model.flagB}});group.addShape('text', {attrs: {...teamNameTextStyle,x: 28,y: 52,text: model.teamA,}});group.addShape('text', {attrs: {...teamNameTextStyle,x: 106,y: 52,text: model.teamB,}});group.addShape('text', {attrs: {...scoreTextStyle,x: 67,y: 52,text: model.scoreA + ' : '+ model.scoreB,}});return keyShape;}
注意 :在自定义图形时,设置坐标时,我们只需要考虑自身坐标系,而不需要考虑世界坐标系。
根据 G6 对锚点的定义,设置锚点
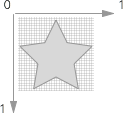

anchor: [[0, 0.5], // 左中[1, 0.5], // 右中[0.5, 0], // 上中[0.5, 1] // 下中]
选择布局
G6 中内置了若干种树图布局,不难看出这是,一种竖直方向紧凑树的布局。
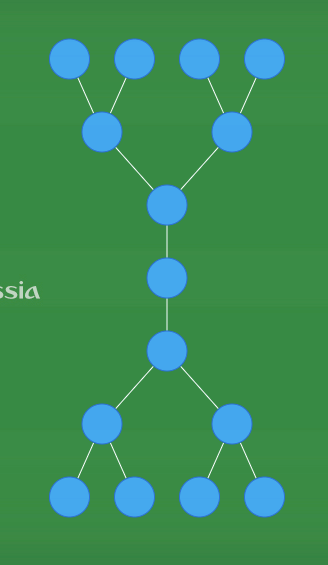
const layout = new G6.Layouts.CompactBoxTree({direction: 'V',});
选择合适的边
边路由是图可视化领域中的一个难点,为了屏蔽这部分的复杂度,我们沉淀一些常见的边路由图形,供大家使用。
require('@antv/g6/build/plugin.edge.polyline');
引入该插件,会在 G6 中注册 polyline (直角) , polyline-round (圆角折线)两种边路由:
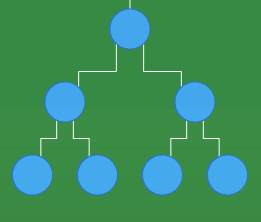
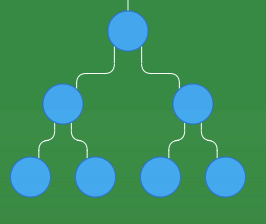
绘制图
有了上面储备的原料,我们已经基本上能画出这幅对阵图了。

const tree = new G6.Tree({container: 'mountNode',width: 760,height: 744,fitView: 'cc',layout,});tree.node({shape: 'card'});tree.edge({shape: 'polyline-round',style: {stroke: 'white',lineWidth: 1,strokeOpacity: 1}});tree.read(data);

