背景
大多数图数据在可视化时被展示成点-线图(Node-link Diagram)的形式。点-线图特别适用于如交通网络图一类的关系数据的展示,这种数据的节点通常带有地理位置信息,例如迁徙图、移民图、航线图等。

(左)图 1. 法国航线图。(右)图 2. 美国航线图。


(左)图 3. 世界网络 IXP 对等图。(右)图 4. 美国移民图。
问题
虽然点-线图提供了直观的可视化,但是当数据存在大量节点和边时,视觉混乱(Visual Clutter)很快成为严重的问题。点-线图中的视觉混乱通常是边缘拥塞的直接结果,而在如交通网络一类数据中,节点位置通常具有明确定义的含义,并不总是可以修改节点位置以减少视觉混乱,如图 1~4 四个例子。因此,学术界诸多研究者设计了各种通过优化边的方式减轻上述视觉混乱,其中边绑定(Edge Bundling)方法被广泛研究和应用。各种边绑定的方法总结在【链接】。
例如下面这一个复杂的美国航线数据集,节点代表美国城市,带有坐标和经纬度信息;一条边代表一条航线:
{"nodes": [{"x": -922.24444,"y": 347.29444,"id": "0","lon": -92.224444,"lat": 34.729444}, {"x": -922.24444,"y": 347.29444,"id": "1","lon": -92.224444,"lat": 34.729444},...],"edges": [{"source": "0","target": "21","id": "e0"}, {"source": "2","target": "13","id": "e1"},...]}
如果使用 G6 简单地将节点和边渲染出来,将会得到如下结果:
图 5. G6 渲染原始数据结果
我们发现简单地将该数据渲染后的结果航线纵横交错,穿梭在密集的城市当中,视觉上十分混乱,即难以看清细节,也不能发现航线的总体趋势。
期待效果
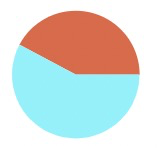
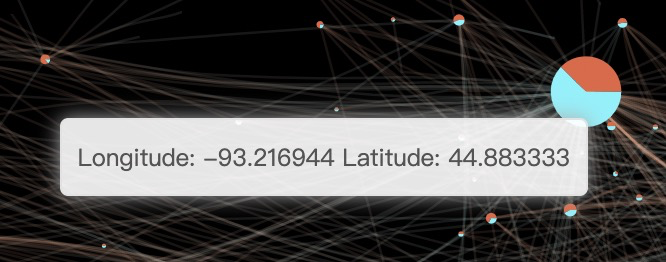
我们希望可以通过边绑定的方法降低图 5 的视觉混乱,从而清晰图的整体走势、结构,突出航线频繁的城市,它们可能是重要的交通枢纽,并展示更多的统计信息,以便观察者进行分析。借助 G6,我们可以实现如下效果。通过边绑定,边的交错混乱情况被降低,颜色映射航班的飞行方向(出发(橙红色)与降落(青色))。节点大小表示到达与离开该城市的航班总数量,每个节点使用了饼图展示达到(橙红色)和离开(青色)航班的比例。并增加 hover 的交互,使用 tooltip 展示每个城市的经纬度。
期待效果图及 tooltip 效果。
实现步骤
统计必要信息
首先,我们使用简单的 JS 根据数据统计每个节点的总度数(degree,即出入该城市的航线总数)、出度(outDegree,即飞出该城市的航线数)、入度(inDegree,即飞入该城市成航线数),为后续映射到节点上做好准备。
const nodes = data.nodes;const edges = data.edges;nodes.forEach(n => {n.y = -n.y;n.degree = 0;n.inDegree = 0;n.outDegree = 0;});// compute the degree of each nodeconst nodeIdMap = new Map();nodes.forEach(node => {nodeIdMap.set(node.id, node);});edges.forEach(e => {const source = nodeIdMap.get(e.source);const target = nodeIdMap.get(e.target);source.outDegree++;target.inDegree++;source.degree++;target.degree++;});let maxDegree = -9999, minDegree = 9999;nodes.forEach(n => {if (maxDegree < n.degree) maxDegree = n.degree;if (minDegree > n.degree) minDegree = n.degree;});const sizeRange = [1, 20];const degreeDataRange = [minDegree, maxDegree];// 将范围是 degreeDataRange 的 degree 属性映射到范围 sizeRange 上后,// 写入到 nodes 中元素的‘size’属性中scaleNodeProp(nodes, 'size', 'degree', degreeDataRange, sizeRange);
scaleNodeProp() 方法将指定的节点属性 refPropName 根据给定数值范围 outRange 归一化,映射到另一个属性 propName 上:
/*** 映射属性* @param {array} nodes 对象数组* @param {string} propName 写入的属性名称* @param {string} refPropName 被归一化的属性名称* @param {array} dataRange 被归一化的属性的值范围 [min, max]* @param {array} outRange 写入的属性的值范围 [min, max]*/function scaleNodeProp(nodes, propName, refPropName, dataRange, outRange) {const outLength = outRange[1] - outRange[0];const dataLength = dataRange[1] - dataRange[0];nodes.forEach(n => {n[propName] = (n[refPropName] - dataRange[0]) * outLength / dataLength + outRange[0];});}
通过上面两段代码,我们已经将归一化的度数映射到节点大小 size 上。
实例化边绑定插件
G6 中提供的边绑定插件是基于 FEDB(Force-Directed Edge Bundling for Graph Visualization)一文的实现。可以通过调节参数调整边绑定的效果。
const edgeBundling = new Bundling({bundleThreshold: 0.6, // 绑定的容忍度。数值越低,被绑定在一起的边相似度越高,即被绑在一起的边更少。K: 100 // 绑定的强度});
自定义饼图节点
在第一步中,我们已经为节点大小 size 映射了每个节点的总度数。为了更详细展示每个城市飞出和飞入航班的比例,我们希望在每个节点上显示一个类似于饼图的效果。例如 ,桔红色扇形代表飞入该城市的航班比例,青色代表飞出该城市的航班比例。G6 原生的 circle 、rect 等节点形状不能满足这一需求,但 G6 提供了节点的扩展机制,通过下面的代码片段,可以在 G6 中注册一个自定义的节点:
const lightBlue = 'rgb(119, 243, 252)';const lightOrange = 'rgb(230, 100, 64)';// 注册自定义名为 pie-node 的节点类型G6.registerNode('pie-node', {drawShape: (cfg, group) => {const radius = cfg.size / 2; // 节点半径const inPercentage = cfg.inDegree / cfg.degree; // 入度占总度数的比例const inAngle = inPercentage * Math.PI * 2; // 入度在饼图中的夹角大小const outAngle = Math.PI * 2 - inAngle; // 出度在饼图中的夹角大小const inArcEnd = [radius * Math.cos(inAngle), radius * Math.sin(inAngle)]; //入度饼图弧结束位置let isInBigArc = 1, isOutBigArc = 0;if (inAngle > Math.PI) {isInBigArc = 0;isOutBigArc = 1;}// 定义代表入度的扇形形状const fanIn = group.addShape('path', {attrs: {path: [[ 'M', radius, 0 ],[ 'A', radius, radius, 0, isInBigArc, 0, inArcEnd[0], inArcEnd[1] ],[ 'L', 0, 0 ],[ 'B' ]],lineWidth: 0,fill: lightOrange}});// 定义代表出度的扇形形状const fanOut = group.addShape('path', {attrs: {path: [[ 'M', inArcEnd[0], inArcEnd[1] ],[ 'A', radius, radius, 0, isOutBigArc, 0, radius, 0 ],[ 'L', 0, 0 ],[ 'B' ]],lineWidth: 0,fill: lightBlue}});// 返回 keyshapereturn fanIn;}},"single-shape");
这样,我们就在 G6 中注册了一个名为 pie-node 的节点类型。
实例化图
在这一步中,我们在实例化图时,并为之指定边绑定插件、节点类型(刚才自定义的 pie-node)、节点样式、边样式(渐变色)。
const edgeBundling = new Bundling({bundleThreshold: 0.6, // 绑定的容忍度。数值越低,被绑定在一起的边相似度越高,即被绑在一起的边更少。K: 100 // 绑定的强度});const graph = new G6.Graph({container: 'mountNode',width: 1000,height: 800,plugins: [ edgeBundling ], // 加入插件fitView: true,defaultNode: {size: 3,color: 'steelblue',fill: 'steelblue'},nodeStyle: {default: {lineWidth: 0,fill: 'steelblue'}},edgeStyle: {default: {lineWidth: 0.7,strokeOpacity: 0.1, // 设置边透明度,在边聚集的部分透明度将会叠加,从而具备突出高密度区域的效果stroke: 'l(0) 0:' + llightBlue16 + ' 1:' + llightOrange16}}});
这里出发端的颜色为 llightBlue16,结束端的颜色为 llightOrange16:
const llightBlue16 = '#C8FDFC';const llightOrange16 = '#FFAA86';
为了配合节点和边的颜色,这里将页面的 body 的颜色设置为黑色:
<style>body{background: rgb(0, 0, 0);}</style>
执行绑定和渲染
有了 graph 实例和 edgeBundling 实例后,我们执行下面代码进行绑定操作和图的数据读入及渲染:
edgeBundling.bundling(data); // 执行插件的绑定操作graph.data(data);graph.render();
设置 tooltip 与交互操作
使用 tooltip,可以在鼠标 hover 到节点上时展示该节点的其他属性值。首先在 html 中设定 tooltip 的样式:
<style>.g6-tooltip {border: 1px solid #e2e2e2;border-radius: 4px;font-size: 12px;color: #545454;background-color: rgba(255, 255, 255, 0.9);padding: 10px 8px;box-shadow: rgb(174, 174, 174) 0px 0px 10px;}</style>
然后,在上一步实例化 graph 时,增加一个名为 modes 的配置项到参数中,如下写法启动了 drag-canvas 画图拖动操作、zoom-canvas 画布放缩操作,以及 tooltip,在 formatText 函数中指定了 tooltip 显示的文本内容:
modes: {default: [ 'drag-canvas', 'zoom-canvas', {type: 'tooltip',formatText(model) {const text = 'Longitude: ' + model.lon + '\n Latitude: ' + model.lat;return text;},shouldUpdate: e => {return true;}}]}
这样,当鼠标移动到节点上时,带有经纬度信息的 tooltip 将会出现:
tooltip
同时,可以拖拽和放缩画布:
缩放和拖动画布。
分析

最终效果图。节点大小代表飞入及飞出该城市航线总数。节点饼图展示飞出与飞入航线比例统计信息(橙红色为飞入,青色为飞出)。边的渐变色代表航班的飞行方向。起始端:青色;结束端:橙红色。
最后,让我们一起分析如下的最终结果图给我们带来的信息:
- 大节点主要集中在中偏东部,根据其经纬度,可以推测这些城市有:亚特兰大、纽约、芝加哥、休斯顿、堪萨斯等,这些城市都是美国重要的交通枢纽;
- 美国东部的线桔红色居多,说明东部城市的飞入航班较多;
- 相反,西部城市的飞出航班较多;
- 整体飞行方向从东至西;
- 东部的航线也较之于西部更加密集、频繁;
- 西海岸由西雅图和波特兰飞往洛杉矶的航班较多。
上述发现很容易被解释:美国东部是美国的经济、政治集中区域。
完整代码
自此,该案例完成。下面为该案例的完整代码:
<!DOCTYPE html></script><html lang="en"><head><meta charset="UTF-8"><title>Title</title></head><style>body{background: rgb(0, 0, 0);}.g6-tooltip {border: 1px solid #e2e2e2;border-radius: 4px;font-size: 12px;color: #545454;background-color: rgba(255, 255, 255, 0.9);padding: 10px 8px;box-shadow: rgb(174, 174, 174) 0px 0px 10px;}</style><body><div id="mountNode"></div><script src="../build/g6.js"></script><script src="./assets/d3-4.13.0.min.js"></script><script src="../build/bundling.js"></script><script>const lightBlue = 'rgb(119, 243, 252)';const llightBlue16 = '#C8FDFC';const lightOrange = 'rgb(230, 100, 64)';const llightOrange16 = '#FFAA86';d3.json("./assets/data/american-migration.json", function(data) {const nodes = data.nodes;const edges = data.edges;nodes.forEach(n => {n.y = -n.y;n.degree = 0;n.inDegree = 0;n.outDegree = 0;});// compute the degree of each nodeconst nodeIdMap = new Map();nodes.forEach(node => {nodeIdMap.set(node.id, node);});edges.forEach(e => {const source = nodeIdMap.get(e.source);const target = nodeIdMap.get(e.target);source.outDegree++;target.inDegree++;source.degree++;target.degree++;});let maxDegree = -9999, minDegree = 9999;nodes.forEach(n => {if (maxDegree < n.degree) maxDegree = n.degree;if (minDegree > n.degree) minDegree = n.degree;});const sizeRange = [1, 20];const sizeDataRange = [minDegree, maxDegree];scaleNodeProp(nodes, 'size', 'degree', sizeDataRange, sizeRange);// customize the nodeG6.registerNode('pie-node', {drawShape: (cfg, group) => {const radius = cfg.size / 2;const inPercentage = cfg.inDegree / cfg.degree;const inAngle = inPercentage * Math.PI * 2;const outAngle = Math.PI * 2 - inAngle;const inArcEnd = [radius * Math.cos(inAngle), radius * Math.sin(inAngle)];let isInBigArc = 1, isOutBigArc = 0;if (inAngle > Math.PI) {isInBigArc = 0;isOutBigArc = 1;}const fanIn = group.addShape('path', {attrs: {path: [[ 'M', radius, 0 ],[ 'A', radius, radius, 0, isInBigArc, 0, inArcEnd[0], inArcEnd[1] ],[ 'L', 0, 0 ],[ 'B' ]],stroke: lightOrange,lineWidth: 0,fill: lightOrange}});const fanOut = group.addShape('path', {attrs: {path: [[ 'M', inArcEnd[0], inArcEnd[1] ],[ 'A', radius, radius, 0, isOutBigArc, 0, radius, 0 ],[ 'L', 0, 0 ],[ 'B' ]],stroke: lightBlue,lineWidth: 0,fill: lightBlue}});return fanIn;}},"single-shape");const edgeBundling = new Bundling({bundleThreshold: 0.6,K: 100});const graph = new G6.Graph({container: 'mountNode',width: 1000,height: 800,plugins: [ edgeBundling ],fitView: true,defaultNode: {shape: 'pie-node',size: 3,color: 'steelblue',fill: 'steelblue'},nodeStyle: {default: {lineWidth: 0,fill: 'steelblue'}},edgeStyle: {default: {lineWidth: 0.7,strokeOpacity: 0.1,stroke: 'l(0) 0:' + llightOrange16 + ' 1:' + llightBlue16}},modes: {default: [ 'drag-canvas', 'zoom-canvas', {type: 'tooltip',formatText(model) {const text = 'Longitude: ' + model.lon + '\n Latitude: ' + model.lat;return text;},shouldUpdate: e => {return true;}}]},});edgeBundling.bundling(data);graph.data(data);graph.render();});function scaleNodeProp(nodes, propName, refPropName, dataRange, outRange) {const outLength = outRange[1] - outRange[0];const dataLength = dataRange[1] - dataRange[0];nodes.forEach(n => {n[propName] = (n[refPropName] - dataRange[0]) * outLength / dataLength + outRange[0];});}</script></body></html>

