G6
G6 是关系数据可视化引擎,开发者可以基于 G6 拓展出属于自己的图分析应用或者图编辑器应用。
特性
简单、易用、完备的图可视化引擎。
丰富、优雅、易于复用的解决方案
高可订制,满足你无限的创意
安装
HTML 引入
既可以通过将脚本下载到本地也可以直接引入在线资源;
<!-- 引入在线资源 --><script src="https://unpkg.com/@antv/g6/build/g6.js"></script>
<!-- 引入本地脚本 --><script src="./g6.js"></script>
通过 npm 安装
我们提供了 G6 npm 包,通过下面的命令即可完成安装
npm install @antv/g6 --save
成功安装完成之后,即可使用 import 或 require 进行引用。
import G6 from '@antv/g6';const graph = new G6.Graph({container: 'mountNode',width: 600,height: 300});
开始使用
在 G6 引入页面后,我们就已经做好了创建第一个图的准备了。
下面,以一个简单关系图为例,开始我们的第一个图创建。
浏览器引入方式
1.创建 div 图表容器
在页面的 body 部分创建一个 div,并制定必须的属性 id:
<div id="mountNode"></div>
2.编写图绘制代码
以下代码放置在 HTML 文档的 <script></script> 标签当中,可以放在页面代码的任意位置(最好放在 </body> 之前)。
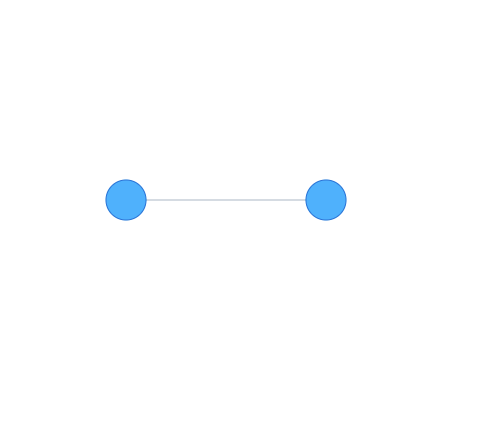
const data = {nodes: [{id: 'node1',x: 100,y: 200},{id: 'node2',x: 300,y: 200}],edges: [{id: 'edge1',target: 'node2',source: 'node1'}]};const graph = new G6.Graph({container: 'mountNode',width: 500,height: 500});graph.read(data);
完成上述两步之后,保存文件并用浏览器打开,一张简单关系图就绘制成功了:

完整的代码如下:
<!DOCTYPE html><html><head><meta charset="utf-8"><title>一个简单的关系图</title><!-- 引入 G6 文件 --><script src="https://gw.alipayobjects.com/os/antv/pkg/_antv.g6-2.0.5/build/g6.js"></script></head><body><!-- 创建图容器 --><div id="mountNode"></div><script>const data = {nodes: [{id: 'node1',x: 100,y: 200},{id: 'node2',x: 300,y: 200}],edges: [{id: 'edge1',target: 'node2',source: 'node1'}]};const graph = new G6.Graph({container: 'mountNode',width: 500,height: 500});graph.read(data);</script></body></html>

