表示圆圈中的数据的图表,每个切片表示百分比。
import javafx.application.Application;import javafx.collections.FXCollections;import javafx.collections.ObservableList;import javafx.scene.Scene;import javafx.scene.chart.PieChart;import javafx.scene.chart.PieChart.Data;import javafx.scene.layout.StackPane;import javafx.stage.Stage;public class Main extends Application {public static void main(String[] args) {launch(args);}@Overridepublic void start(Stage primaryStage) {PieChart pieChart = new PieChart();pieChart.setData(getChartData());primaryStage.setTitle("PieChart");StackPane root = new StackPane();root.getChildren().add(pieChart);primaryStage.setScene(new Scene(root, 400, 250));primaryStage.show();}private ObservableList<Data> getChartData() {ObservableList<Data> answer = FXCollections.observableArrayList();answer.addAll(new PieChart.Data("java", 17.56),new PieChart.Data("JavaFx", 31.37));return answer;}}
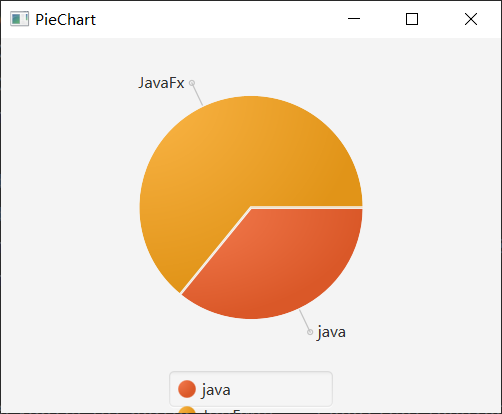
创建饼图
要创建饼图,我们需要PieChart类。
饼图数据包裹在PieChart.Data对象中。
每个PieChart.Data对象有两个字段:饼图扇区的名称及其对应的值。
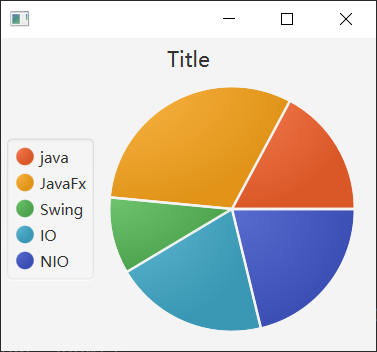
import javafx.application.Application;import javafx.collections.FXCollections;import javafx.collections.ObservableList;import javafx.geometry.Side;import javafx.scene.Scene;import javafx.scene.chart.PieChart;import javafx.scene.chart.PieChart.Data;import javafx.scene.layout.StackPane;import javafx.stage.Stage;public class Main extends Application {public static void main(String[] args) {launch(args);}@Overridepublic void start(Stage primaryStage) {PieChart pieChart = new PieChart();pieChart.setData(getChartData());pieChart.setTitle("Title");pieChart.setLegendSide(Side.LEFT);pieChart.setClockwise(false);pieChart.setLabelsVisible(false);StackPane root = new StackPane();root.getChildren().add(pieChart);primaryStage.setScene(new Scene(root, 300, 250));primaryStage.show();}private ObservableList<Data> getChartData() {ObservableList<Data> answer = FXCollections.observableArrayList();answer.addAll(new PieChart.Data("java", 17),new PieChart.Data("JavaFx",31),new PieChart.Data("Swing",10),new PieChart.Data("IO",20),new PieChart.Data("NIO",21));return answer;}}
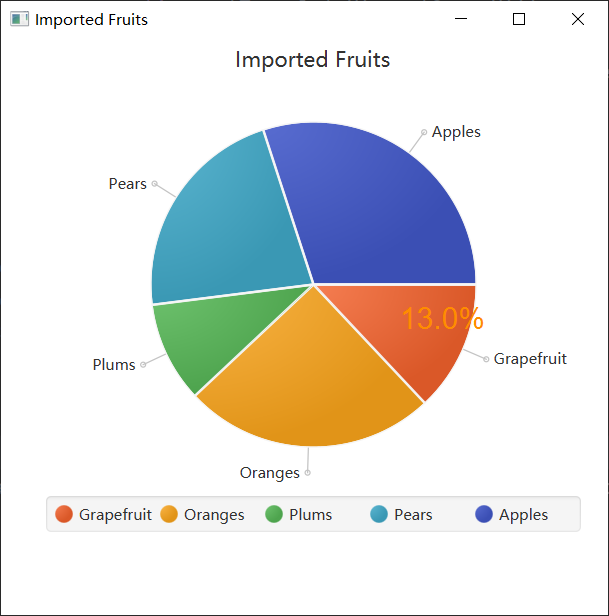
处理饼图的事件
以下代码创建一个EventHandler对象来处理落入特定图表切片的MOUSE_PRESSED事件。
import javafx.application.Application;import javafx.collections.FXCollections;import javafx.collections.ObservableList;import javafx.event.EventHandler;import javafx.scene.Scene;import javafx.scene.paint.Color;import javafx.stage.Stage;import javafx.scene.chart.*;import javafx.scene.Group;import javafx.scene.control.Label;import javafx.scene.input.MouseEvent;public class Main extends Application {@Overridepublic void start(Stage stage) {Scene scene = new Scene(new Group());stage.setTitle("Imported Fruits");stage.setWidth(500);stage.setHeight(500);ObservableList<PieChart.Data> pieChartData =FXCollections.observableArrayList(new PieChart.Data("Grapefruit", 13),new PieChart.Data("Oranges", 25),new PieChart.Data("Plums", 10),new PieChart.Data("Pears", 22),new PieChart.Data("Apples", 30));final PieChart chart = new PieChart(pieChartData);chart.setTitle("Imported Fruits");final Label caption = new Label("");caption.setTextFill(Color.DARKORANGE);caption.setStyle("-fx-font: 24 arial;");for (final PieChart.Data data : chart.getData()) {data.getNode().addEventHandler(MouseEvent.MOUSE_PRESSED,new EventHandler<MouseEvent>() {@Override public void handle(MouseEvent e) {caption.setTranslateX(e.getSceneX());caption.setTranslateY(e.getSceneY());caption.setText(String.valueOf(data.getPieValue())+ "%");}});}((Group) scene.getRoot()).getChildren().addAll(chart, caption);stage.setScene(scene);//scene.getStylesheets().add("piechartsample/Chart.css");stage.show();}public static void main(String[] args) {launch(args);}}

若有收获,就点个赞吧
0 人点赞
