
- mean 代表平均值,se 代表标准差,worst 代表最大值(3 个最大值的平均值)
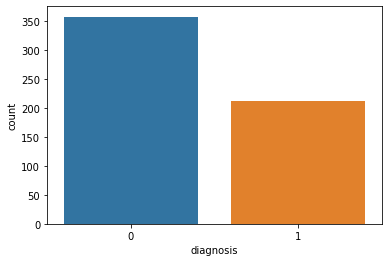
- 实际上是 10 个特征值(radius、texture、perimeter、area、smoothness、compactness、concavity、concave points、symmetry 和 fractal_dimension_mean)的 3 个维度,平均、标准差和最大值。这些特征值都保留了 4 位数字。字段中没有缺失的值。在 569 个患者中,一共有 357 个是良性,212 个是恶性。
import pandas as pdimport matplotlib.pyplot as plt# 画图import seaborn as snsfrom sklearn.model_selection import train_test_split#训练集与测试集from sklearn import svmfrom sklearn import metrics #?from sklearn.preprocessing import StandardScaler#标准分
data=pd.read_csv('data.csv')data.info()
<class 'pandas.core.frame.DataFrame'>RangeIndex: 569 entries, 0 to 568Data columns (total 32 columns):id 569 non-null int64diagnosis 569 non-null objectradius_mean 569 non-null float64texture_mean 569 non-null float64perimeter_mean 569 non-null float64area_mean 569 non-null float64smoothness_mean 569 non-null float64compactness_mean 569 non-null float64concavity_mean 569 non-null float64concave points_mean 569 non-null float64symmetry_mean 569 non-null float64fractal_dimension_mean 569 non-null float64radius_se 569 non-null float64texture_se 569 non-null float64perimeter_se 569 non-null float64area_se 569 non-null float64smoothness_se 569 non-null float64compactness_se 569 non-null float64concavity_se 569 non-null float64concave points_se 569 non-null float64symmetry_se 569 non-null float64fractal_dimension_se 569 non-null float64radius_worst 569 non-null float64texture_worst 569 non-null float64perimeter_worst 569 non-null float64area_worst 569 non-null float64smoothness_worst 569 non-null float64compactness_worst 569 non-null float64concavity_worst 569 non-null float64concave points_worst 569 non-null float64symmetry_worst 569 non-null float64fractal_dimension_worst 569 non-null float64dtypes: float64(30), int64(1), object(1)memory usage: 142.3+ KB
pd.set_option('display.max_columns',None)# 显示完整列
data.describe()
| id | radius_mean | texture_mean | perimeter_mean | area_mean | smoothness_mean | compactness_mean | concavity_mean | concave points_mean | symmetry_mean | fractal_dimension_mean | radius_se | texture_se | perimeter_se | area_se | smoothness_se | compactness_se | concavity_se | concave points_se | symmetry_se | fractal_dimension_se | radius_worst | texture_worst | perimeter_worst | area_worst | smoothness_worst | compactness_worst | concavity_worst | concave points_worst | symmetry_worst | fractal_dimension_worst | |
|---|---|---|---|---|---|---|---|---|---|---|---|---|---|---|---|---|---|---|---|---|---|---|---|---|---|---|---|---|---|---|---|
| count | 5.690000e+02 | 569.000000 | 569.000000 | 569.000000 | 569.000000 | 569.000000 | 569.000000 | 569.000000 | 569.000000 | 569.000000 | 569.000000 | 569.000000 | 569.000000 | 569.000000 | 569.000000 | 569.000000 | 569.000000 | 569.000000 | 569.000000 | 569.000000 | 569.000000 | 569.000000 | 569.000000 | 569.000000 | 569.000000 | 569.000000 | 569.000000 | 569.000000 | 569.000000 | 569.000000 | 569.000000 |
| mean | 3.037183e+07 | 14.127292 | 19.289649 | 91.969033 | 654.889104 | 0.096360 | 0.104341 | 0.088799 | 0.048919 | 0.181162 | 0.062798 | 0.405172 | 1.216853 | 2.866059 | 40.337079 | 0.007041 | 0.025478 | 0.031894 | 0.011796 | 0.020542 | 0.003795 | 16.269190 | 25.677223 | 107.261213 | 880.583128 | 0.132369 | 0.254265 | 0.272188 | 0.114606 | 0.290076 | 0.083946 |
| std | 1.250206e+08 | 3.524049 | 4.301036 | 24.298981 | 351.914129 | 0.014064 | 0.052813 | 0.079720 | 0.038803 | 0.027414 | 0.007060 | 0.277313 | 0.551648 | 2.021855 | 45.491006 | 0.003003 | 0.017908 | 0.030186 | 0.006170 | 0.008266 | 0.002646 | 4.833242 | 6.146258 | 33.602542 | 569.356993 | 0.022832 | 0.157336 | 0.208624 | 0.065732 | 0.061867 | 0.018061 |
| min | 8.670000e+03 | 6.981000 | 9.710000 | 43.790000 | 143.500000 | 0.052630 | 0.019380 | 0.000000 | 0.000000 | 0.106000 | 0.049960 | 0.111500 | 0.360200 | 0.757000 | 6.802000 | 0.001713 | 0.002252 | 0.000000 | 0.000000 | 0.007882 | 0.000895 | 7.930000 | 12.020000 | 50.410000 | 185.200000 | 0.071170 | 0.027290 | 0.000000 | 0.000000 | 0.156500 | 0.055040 |
| 25% | 8.692180e+05 | 11.700000 | 16.170000 | 75.170000 | 420.300000 | 0.086370 | 0.064920 | 0.029560 | 0.020310 | 0.161900 | 0.057700 | 0.232400 | 0.833900 | 1.606000 | 17.850000 | 0.005169 | 0.013080 | 0.015090 | 0.007638 | 0.015160 | 0.002248 | 13.010000 | 21.080000 | 84.110000 | 515.300000 | 0.116600 | 0.147200 | 0.114500 | 0.064930 | 0.250400 | 0.071460 |
| 50% | 9.060240e+05 | 13.370000 | 18.840000 | 86.240000 | 551.100000 | 0.095870 | 0.092630 | 0.061540 | 0.033500 | 0.179200 | 0.061540 | 0.324200 | 1.108000 | 2.287000 | 24.530000 | 0.006380 | 0.020450 | 0.025890 | 0.010930 | 0.018730 | 0.003187 | 14.970000 | 25.410000 | 97.660000 | 686.500000 | 0.131300 | 0.211900 | 0.226700 | 0.099930 | 0.282200 | 0.080040 |
| 75% | 8.813129e+06 | 15.780000 | 21.800000 | 104.100000 | 782.700000 | 0.105300 | 0.130400 | 0.130700 | 0.074000 | 0.195700 | 0.066120 | 0.478900 | 1.474000 | 3.357000 | 45.190000 | 0.008146 | 0.032450 | 0.042050 | 0.014710 | 0.023480 | 0.004558 | 18.790000 | 29.720000 | 125.400000 | 1084.000000 | 0.146000 | 0.339100 | 0.382900 | 0.161400 | 0.317900 | 0.092080 |
| max | 9.113205e+08 | 28.110000 | 39.280000 | 188.500000 | 2501.000000 | 0.163400 | 0.345400 | 0.426800 | 0.201200 | 0.304000 | 0.097440 | 2.873000 | 4.885000 | 21.980000 | 542.200000 | 0.031130 | 0.135400 | 0.396000 | 0.052790 | 0.078950 | 0.029840 | 36.040000 | 49.540000 | 251.200000 | 4254.000000 | 0.222600 | 1.058000 | 1.252000 | 0.291000 | 0.663800 | 0.207500 |
# 字段分成3组
features_mean=list(data.columns[2:12])
features_se=list(data.columns[12:22])
features_worst=list(data.columns[22:32])
data.drop('id',axis=1,inplace=True)
data['diagnosis']=data['diagnosis'].map({'M':1,'B':0})
# 可视化
sns.countplot(data['diagnosis'],label="Count")
plt.show()
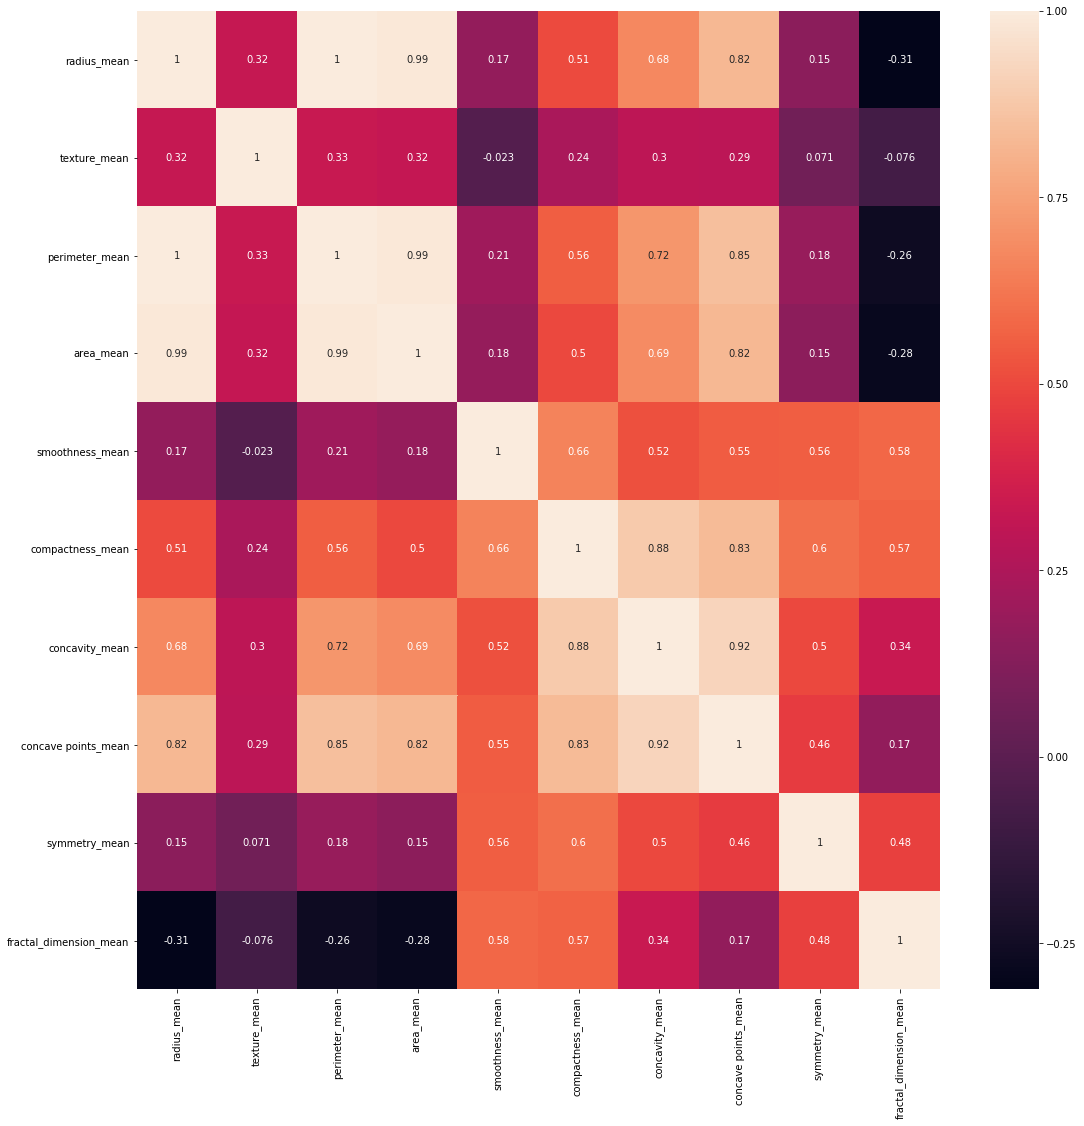
#利用热力图呈现与均值的关系
corr=data[features_mean].corr()#字段间的相关性(计算pearson相关系数)
plt.figure(figsize=(18,18))
sns.heatmap(corr,annot=True)
<matplotlib.axes._subplots.AxesSubplot at 0x1a31c99828>
features_remain = ['radius_mean','texture_mean', 'smoothness_mean','compactness_mean','symmetry_mean', 'fractal_dimension_mean']
train,test=train_test_split(data,test_size=0.3)
train_x=train[features_remain]
train_y=train['diagnosis']
test_x=train[features_remain]
test_y=train['diagnosis']
ss=StandardScaler()
train_x=ss.fit_transform(train_x)
test_x=ss.fit_transform(test_x)
model1=svm.SVC()
model1.fit(train_x,train_y)
SVC(C=1.0, cache_size=200, class_weight=None, coef0=0.0,
    decision_function_shape='ovr', degree=3, gamma='auto_deprecated',
    kernel='rbf', max_iter=-1, probability=False, random_state=None,
    shrinking=True, tol=0.001, verbose=False)
prediction=model1.predict(test_x)
score=metrics.accuracy_score(prediction,test_y)
print(score)
0.9472361809045227
model2=svm.LinearSVC()
model2.fit(train_x,train_y)
prediction=model2.predict(test_x)
score=metrics.accuracy_score(prediction,test_y)
print(score)
0.9346733668341709
数据集

若有收获,就点个赞吧
0 人点赞
