书籍 《python高性能编程》
https://zhuanlan.zhihu.com/p/121003986
mine
install psutil,memory_profiler
[root@head ~]# pip3 install psutilWARNING: Running pip install with root privileges is generally not a good idea. Try `pip3 install --user` instead.Requirement already satisfied: psutil in /usr/lib64/python3.6/site-packages[root@head ~]# pip3 install memory_profilerWARNING: Running pip install with root privileges is generally not a good idea. Try `pip3 install --user` instead.Requirement already satisfied: memory_profiler in /usr/local/lib/python3.6/site-packagesRequirement already satisfied: psutil in /usr/lib64/python3.6/site-packages (from memory_profiler)
import time
import attr
# from memory_porfiler import profiler

@attr.s
class _node(object):
    _next = attr.ib(default=None)
    _pre = attr.ib(default=None)
    _value = attr.ib(default=0)

    def get_son(self,_val=[]):
        _son = self._next
        self._son = _val
        while _son:
            self._son.append(_son._value)
            _son = _son._next
        return self._son


def sum_son(_num, _batch):
    head = _node()
    _pre = head
    for batch in range(_batch):
        for  i in range(_num):
            _new = _node(None,_pre,i)
            _pre._next=_new
            _pre = _pre._next
    print('len: ',len(head.get_son()))
    print('sum: ',sum(head.get_son()))
    time.sleep(60)
    return head


@profile
def calculate_mem():
    head = sum_son(1000,500)
    print(len(head._son))
    print(sum(head._son))
    time.sleep(60)

if __name__ == '__main__':
    calculate_mem()
pid 来计算
[root@head daiyi]# pid=`ps -ef | grep calculate_mem.py|grep -v color |awk '{print $2}'`;echo $((`cat /proc/$pid/statm|awk '{print $2}'`*4096/1024/1024))
108
[root@head daiyi]# pid=`ps -ef | grep calculate_mem.py|grep -v color |awk '{print $2}'`;echo $((`cat /proc/$pid/statm|awk '{print $2}'`*4096/1024/1024))
147
[root@head daiyi]# pid=`ps -ef | grep calculate_mem.py|grep -v color |awk '{print $2}'`;echo $((`cat /proc/$pid/statm|awk '{print $2}'`*4096/1024/1024))
165
[root@head daiyi]# pid=`ps -ef | grep calculate_mem.py|grep -v color |awk '{print $2}'`;echo $((`cat /proc/$pid/statm|awk '{print $2}'`*4096/1024/1024))
169
[root@head daiyi]# pid=`ps -ef | grep calculate_mem.py|grep -v color |awk '{print $2}'`;echo $((`cat /proc/$pid/statm|awk '{print $2}'`*4096/1024/1024))
169
[root@head daiyi]#
memory_profile 运行
[root@head daiyi]# python3 -m memory_profiler calculate_mem.py
sum:  249750000
len:  500000
500000
249750000
Filename: calculate_mem.py

Line #    Mem usage    Increment  Occurences   Line Contents
============================================================
    38   41.562 MiB   41.562 MiB           1   @profile
    39                                         def calculate_mem():
    40  169.145 MiB  127.582 MiB           1       head = sum_son(1000,500)
    41  169.145 MiB    0.000 MiB           1       print(len(head._son))
    42  169.152 MiB    0.008 MiB           1       print(sum(head._son))


[root@head daiyi]#
reference
memory_profiler 是什么
首先我们简单介绍下 memory_profiler 是什么。这部分主要来自 memory_profiler 的 PyPI 介绍。
This is a python module for monitoring memory consumption of a process as well as line-by-line analysis of memory consumption for python programs. It is a pure python module which depends on the psutil module.
memory_profiler 是一个监控进程内存消耗的模块,也可以逐行分析 Python 程序的内存消耗。它是一个依赖 psutil 模块的纯 Python 模块。
memory_profiler 有两种应用场景,三种使用方式。
两种应用场景分别是:逐行的内存使用分析,时间维度的内存使用分析。后面再详细说。
三种使用方式中,前两种是针对逐行的内存使用分析,另外一种针对时间维度的内存使用分析。
只使用装饰器,不 import memory_profiler。给目标函数加上 @profile 装饰器,执行代码时,给 Python 解释器传递参数 -m memory_profiler ,来加载 memory_profiler 模块。
@profile
def my_func():
a = [1] (10 ** 6)
b = [2] (2 10 * 7)
del b
return a
if name == ‘main‘:
my_func()
python -m memory_profiler example.py
使用装饰器,import memory_profiler。给目标函数加上 @profile 装饰器,import memory_profiler,执行时不需要传递参数。
from memory_profiler import profile
@profile
def my_func():
a = [1] (10 ** 6)
b = [2] (2 10 * 7)
del b
return a
python example.py
时间维度的内存使用分析。使用 mprof 执行程序在时间维度分析进程的内存使用情况。下面介绍了一共有四种情况,分别是:单进程,多进程,记录子进程内存占用,多进程并记录子进程内存占用。
mprof run
mprof run —multiprocess
mprof run —include-children
mprof run —include-children —multiprocess
执行完成后,会生成一个 .dat 文件,类似:
mprofile_20200329173152.dat
要绘制内存在时间维度的使用情况,需要安装 matplotlib,然后执行 mprof plot (直接执行会读取最新的 .dat 文件):
pip install matplotlib
mprof plot
mprof plot mprofile_20200329173152.dat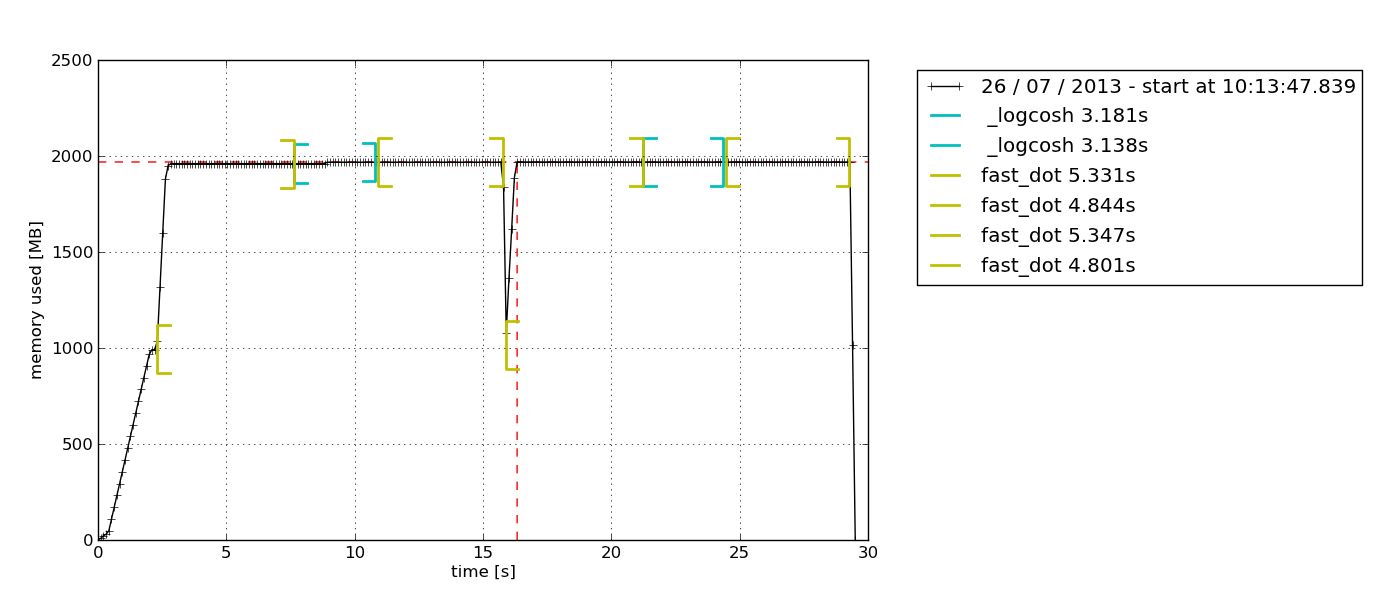
也可以查看火焰图:
mprof plot —flame mprofile_20200329173152.dat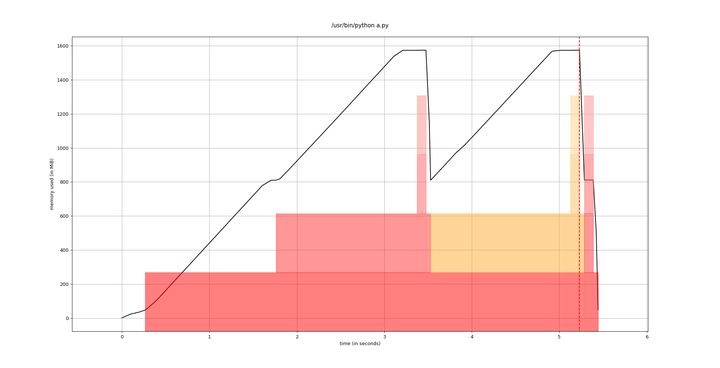
实践经验
memory_profiler 只介绍了脚本程序的实践,曾让我以为他只能用在普通程序上。而实际上,他可以在任何场景下使用,包括服务,这里为了丰富示例,我使用服务来进行相关实践。
我们使用 mprof 启动一个服务后,服务进程会持续运行,在这期间,我们可以通过测试工具,模拟出服务在生产环境的运行情况,来分析服务的内存使用状况。下面列出了三种会遇到的使用场景,每种场景的表现都是不一样的。单进程服务我们使用了 Flask 和 Gevent,多进程服务我们使用了 Flask + Gunicorn 的 gevent worker。
单进程无装饰器
因为收集每一行代码的内存使用情况是不现实的,所以,单进程不使用装饰器时,只能收集到整个进程的内存使用情况。这种场景是无侵入的,一般对应了我们自测的初始阶段,我们想对服务或者脚本内存的使用情况有一个初步的了解:是否会有内存泄漏,是否会占用过大的内存等等问题。
服务代码:
from gevent import monkey
from gevent.pywsgi import WSGIServer
monkey.patchall()
from flask import Flask, render_template
# from memoryprofiler import profile
from gevent import time
app = Flask(name)
@app.route(‘/test’)
def hello():
list1 = test1()
list2 = test2()
return “hello, world”
def test1():
new_list = [None]*4096000
new_list = [0]*4096000
big_list = []
big_list.extend(new_list)
delay(0.3)
return big_list
def test2():
new_list = [None]*4096000
new_list = [0]*4096000
big_list = []
big_list.extend(new_list)
delay(0.5)
return big_list
def delay(delay_time):
time.sleep(delay_time)
print(app.url_map)
if name == “main“:
http_server = WSGIServer((‘’, 5000), app)
http_server.serve_forever()
执行 mprof run:
mprof run server.py
使用 curl 请求多次后,执行mporf plot:
mprof plot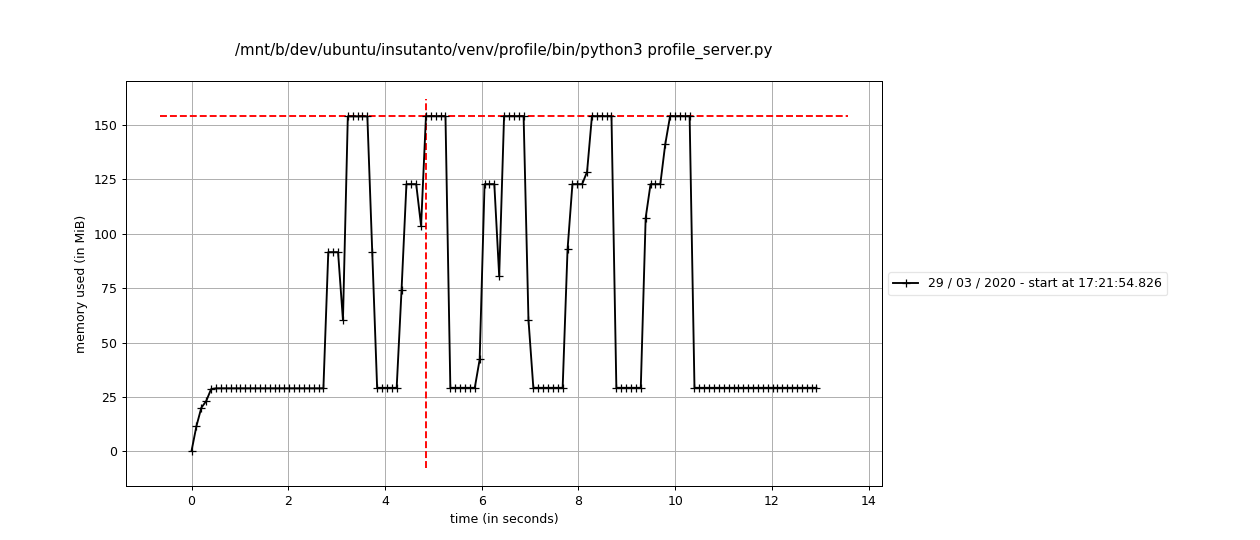
在时间维度上的单进程内存使用情况,可以很清晰的体现出来。这时,如果我们发现了过大的内存消耗,长时间没有释放的大内存,可能就需要对单进程添加装饰器来进一步分析了。
单进程加装饰器
我们使用 mprof 直接 runserver.py,发现了比较大的内存消耗,或者长时间没有释放的大内存,又或者在一轮请求中遇到耗时绝对值过大等性能问题,就需要考虑给服务相关的代码加上装饰器来定位了。
加装饰器时,要注意一点。不要加入下面的代码:
from memory_profiler import profile
下面是服务代码,也就是在我们主要的函数上增加 profile 装饰器:
from gevent import monkey
from gevent.pywsgi import WSGIServer
monkey.patch_all()
from flask import Flask, render_template
# from memory_profiler import profile
from gevent import time
app = Flask(name)
@app.route(‘/test’)
def hello():
list1 = test1()
list2 = test2()
return “hello, world”
@profile
def test1():
new_list = [None]4096000
new_list = [0]4096000
big_list = []
big_list.extend(new_list)
delay(0.3)
return big_list
@profile
def test2():
new_list = [None]4096000
new_list = [0]4096000
big_list = []
big_list.extend(new_list)
delay(0.5)
return big_list
@profile
def delay(delay_time):
time.sleep(delay_time)
print(app.url_map)
if name == “main“:
http_server = WSGIServer((‘’, 5000), app)
http_server.serve_forever()
执行 mprof run:
mprof run server.py
使用 curl 请求多次后,执行mporf plot:
mprof plot
如果在服务代码中,你添加了 profile 装饰器的 import :
from memory_profiler import profile
你会得到下面这样的图: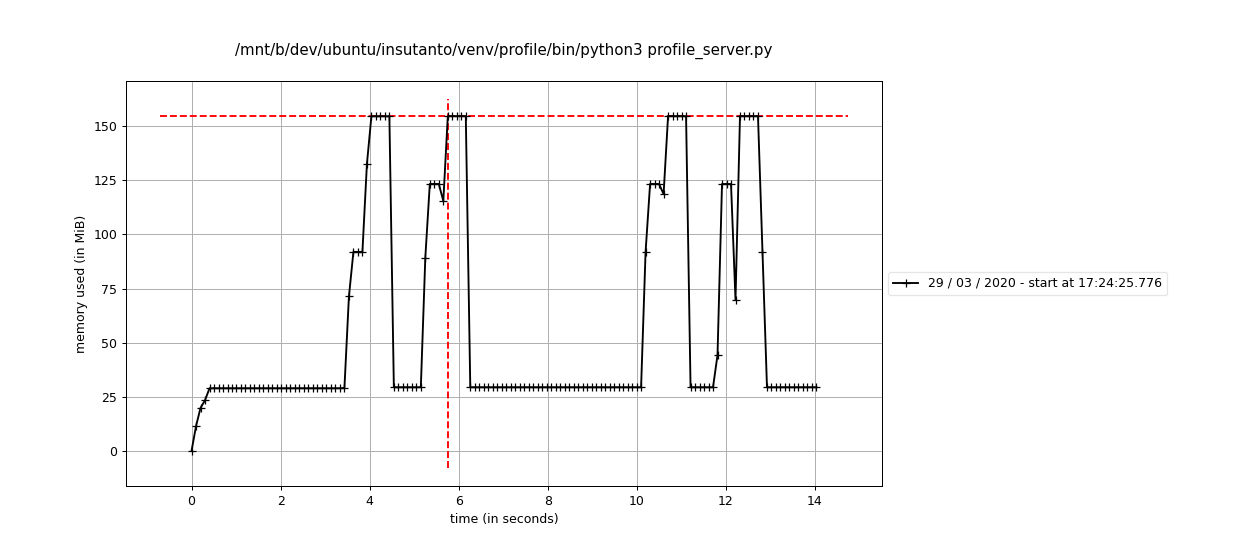
和官方示例的图似乎不太一样?我们期待的函数执行时间和函数执行前后内存消耗的标记没有了?在我实践之后发现,这是一个坑,加入 import 的代码,只会对代码进行逐行的内存消耗分析,而不能得到内容丰富的图例。
我们去掉 profile 装饰器的 import 代码,再回到这里来看看,会得到类似下面这张图。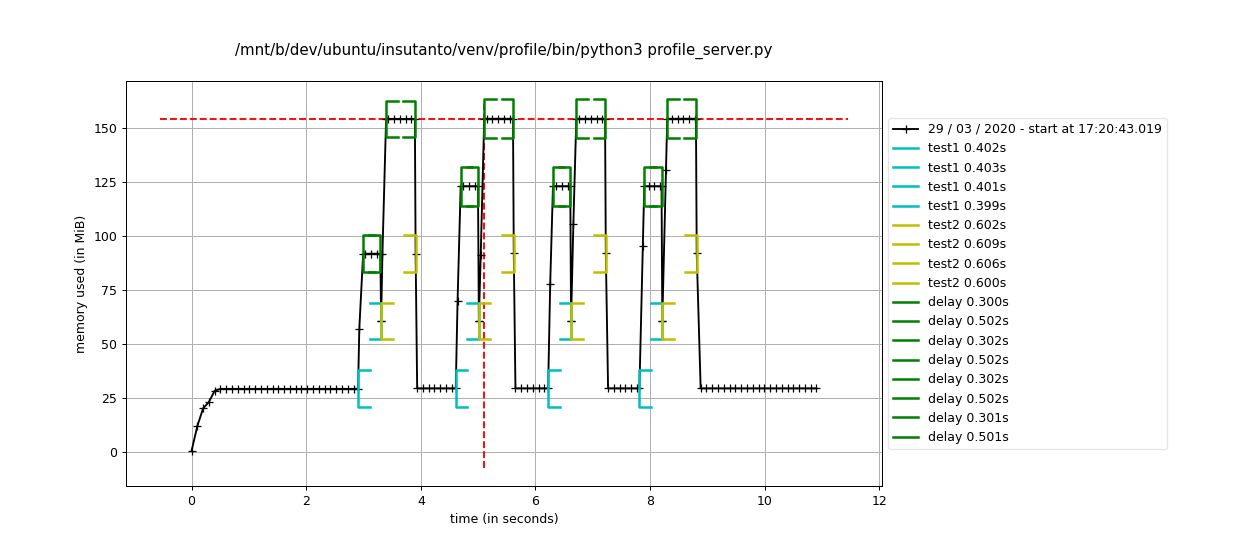
这下是不是就清晰多了?我们能够看到在函数test1执行的期间,函数delay占用了大部分的时间,函数test1执行之后,内存回收了一部分,然后接着执行函数test2。哪些代码消耗内存多,哪些代码执行时间长,是不是就一目了然了?
然后我们还可以执行:
mprof plot —flame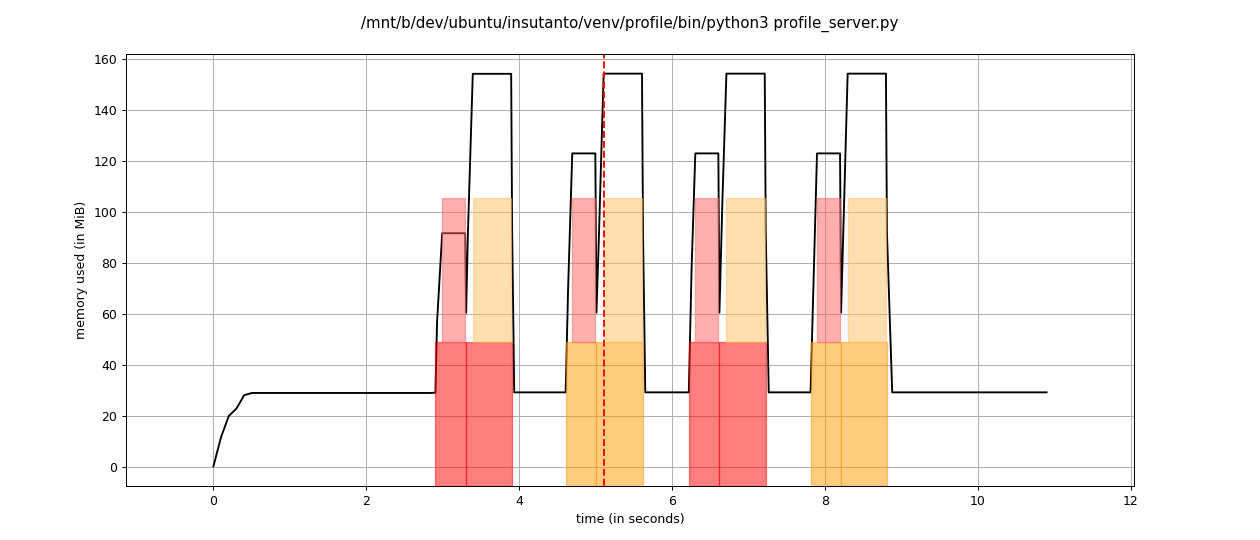
能够清晰的看到火焰图的深度只有两层,看火焰图的平顶,函数test2 中的函数 delay 执行时间更长,“性能更差“,内存占用在函数 test2 执行的过程中达到了峰值。
多进程
我在实践的过程中发现,多进程无法在不 import memory_profiler 的情况下使用装饰器。所以多进程的场景,只能统计每个进程的内存使用情况。不会有函数执行时间,也不会有函数执行前后内存变化的标记,更不会有火焰图。看了官方的示例,也没有发现这些功能在多进程有得到支持的相关证据。索性我们就先不管这些高级的特性,毕竟能够支持多进程和子进程的内存监控,至少能让我们了解多进程程序运行的内存消耗了。
因为直接使用 gunicorn 作为 WSGI Server,服务代码和“单进程无装饰器”一样,就不做赘述了。
下面是gunicorn的配置文件内容:
# gunicorn_config.py
import os
import gevent.monkey
gevent.monkey.patch_all()
import multiprocessing
loglevel = ‘debug’
bind = “127.0.0.1:5000”
pidfile = “logs/gunicorn.pid”
accesslog = “logs/access.log”
errorlog = “logs/debug.log”
daemon = False
workers = 2
worker_class = ‘gevent’
x_forwarded_for_header = ‘X-FORWARDED-FOR’
执行 mprof run 命令,这里需要添加相关的参数,不同的参数,结果图示也会相应有所不同:
mprof run gunicorn -c gunicorn_config.py profile_server:app
mprof run —multiprocess gunicorn -c gunicorn_config.py profile_server:app
mprof run —include-children gunicorn -c gunicorn_config.py profile_server:app
mprof run —include-children —multiprocess gunicorn -c gunicorn_config.py profile_server:app
执行几次 curl 请求之后,执行 mprof plot:
mprof plot
按照步骤2的不同命令,分别展示对应的图:
不添加任何多进程相关的参数: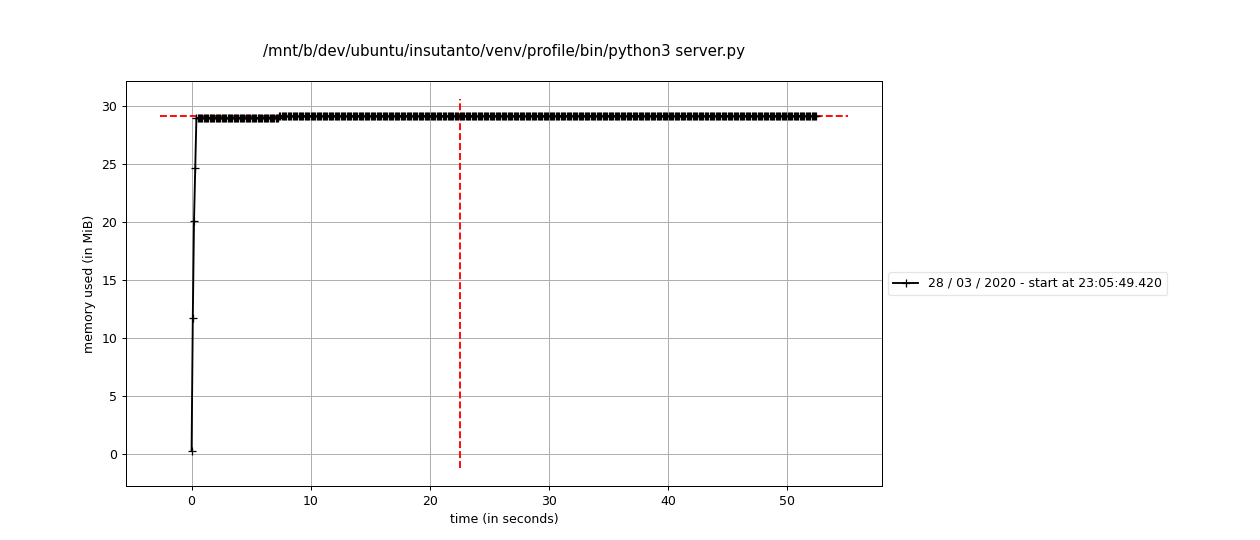
我们发现只有主进程的内存消耗统计。
添加 —multiprocess 参数: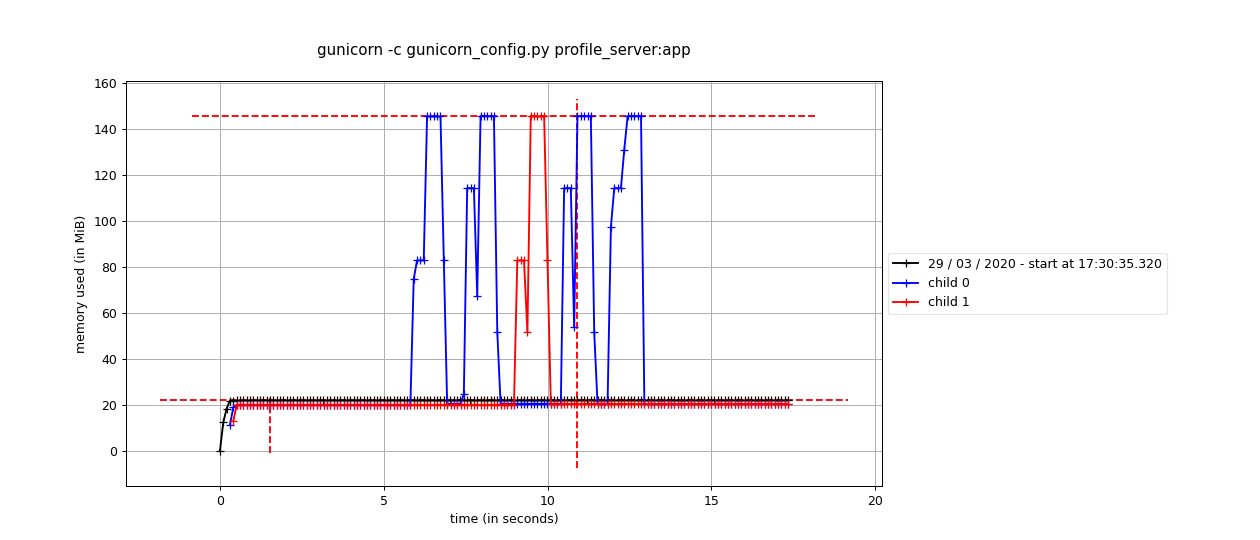
这种情况,我们就能看到我们多进程服务的两个worker的内存消耗了。
添加 —include-children 参数: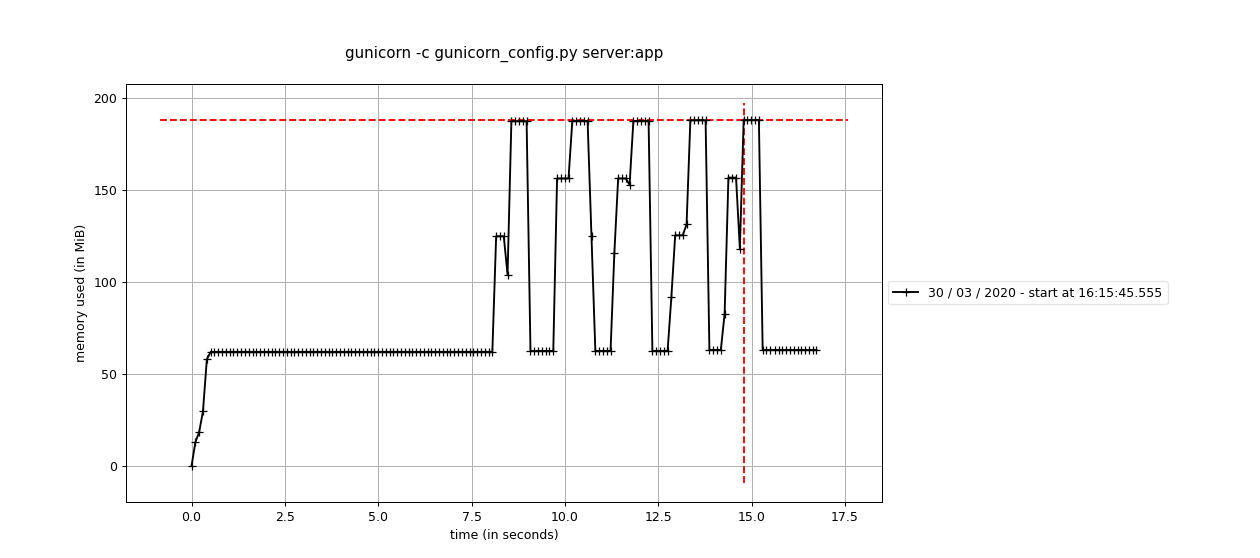
这种情况,只统计了多进程服务的全部内存消耗。
添加 —include-children 和 —multiprocess 参数: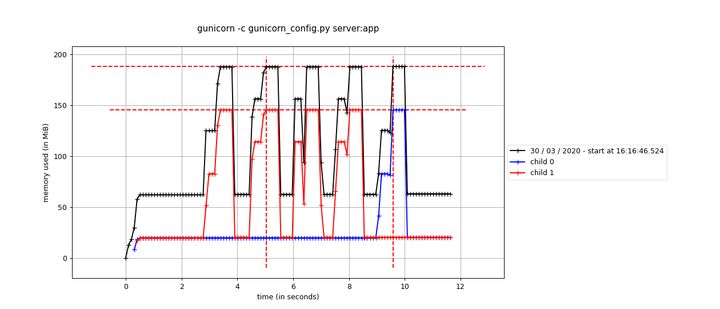
这种情况,统计了多进程服务的全部内存消耗,也统计了两个 worker 进程的内存消耗。
总结
如果在开发中对代码的内存消耗有疑惑,或者想要更快定位出程序的性能瓶颈,绝对可以尝试使用 memory_profiler。除了上面介绍的内容和实践,memory_profiler 还支持通过设定内存大小来进行debug。如果感觉 memory_profiler 的功能不够强大,还可以使用它的 API 来自己扩展和实现更加强大的功能。

若有收获,就点个赞吧
0 人点赞
