资料
- echart 官网
- echart github 地址
漫漫踩坑路
1. 在低分辨率的电脑上使用时,出现文字和图表模糊的情况。
- 问题解决前后的展示截图(截图被压缩了,实际效果比较明显)
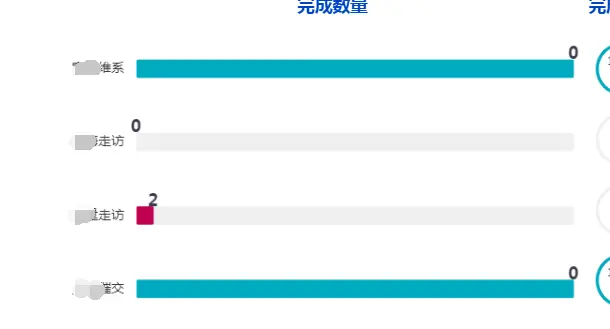
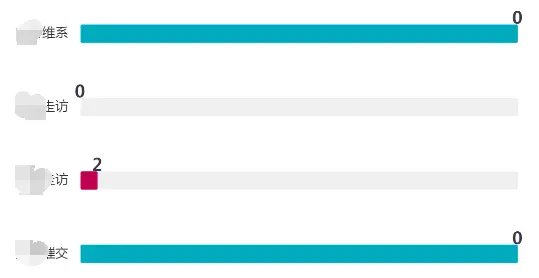
- 产生问题的原因
canvas在使用的时候给的width和height与实际展示出来的宽高比例不为 1:1,造成像素值的偏离

- 解决问题
- 解决参考地址
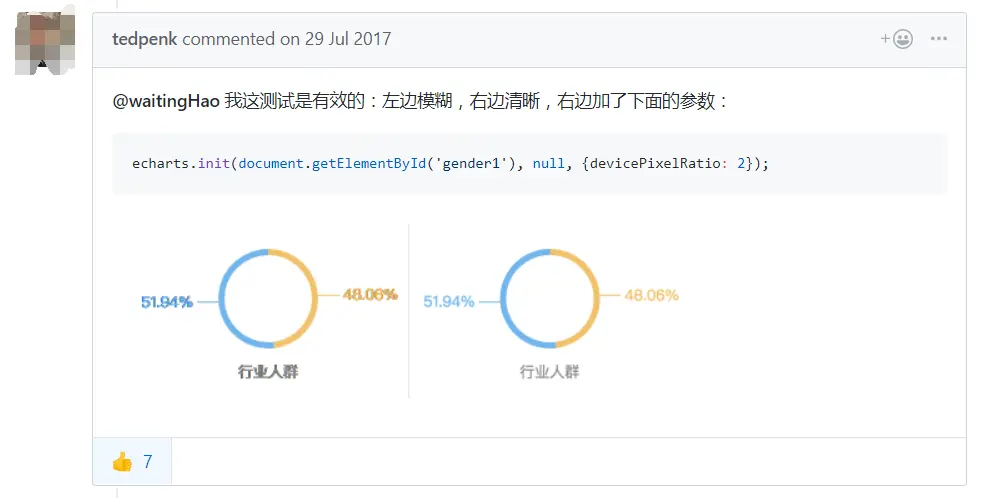
- 具体添加代码 ``` null, {devicePixelRatio: 2}
### 2. 隐藏掉柱形图表的数据分裂线,因为两次的比例不同造成重叠了- 示例图片> <br />- 设置的方法
option.yAxis[index].splitLine.show: false
### 3. 多种数据时 `series[index]` 引用不同的 `yAxis` 设置,以及在 `series[index]` 中嵌套数据- 示例图片> <br />【月收入】数据使用的是左侧的数据作参考,【同比】使用的是右侧的百分比数据作参考,【TO】使用的也是左侧的数据作参考- 总的展示方案:> 【月收入】数据中单独展示出【TO】的一行数据,这两个数据都是以左侧为参照,【同比】数据单独展示,并 以右侧为参考- `option` 配置代码展示
opation = { title: { text: ‘月收入趋势’, textStyle: { fontSize: 17, fontWeight: 800, color: “#37394C” }, left: ‘1%’, top: “5%” }, tooltip: { trigger: ‘axis’ }, grid: { left: ‘2%’, right: ‘2%’, top: “20%”, bottom: ‘5%’, containLabel: true }, legend: { data: [‘月收入’, ‘同比’, { name: ‘T0’, icon: ‘image:///static/img/module/index/S.png’ } ], top: 15, selectedMode: false, formatter: function (data) { return data + “ “; } }, xAxis: [ { type: ‘category’, data: [‘1月’, ‘2月’, ‘3月’, ‘4月’, ‘5月’, ‘6月’, ‘7月’, ‘8月’, ‘9月’, ‘10月’, ‘11月’, ‘12月’], axisPointer: { type: ‘shadow’ }, axisLine: { show: false, color: ‘#8795A8’
},axisTick: {show: false},axisPointer: {type: 'line'},axisLabel: {textStyle: {color: '#8795A8',}}}],yAxis: [{// 月收入 规则type: 'value',min: 0,axisLine: {show: false},axisTick: {show: false},axisLabel: {formatter: '{value}',textStyle: {color: '#8795A8',}}},{// 同比 规则type: 'value',min: -5,// 起始线是否显示axisLine: {show: false},// 起始线延长出的分裂线是否展示splitLine: {show: false},axisTick: {show: false},axisLabel: {formatter: '{value} %',textStyle: {color: '#8795A8',}}}],series: [{name: '月收入',type: 'bar',color: '#3E82FE',barWidth: 20,// 嵌套【TO】数据markLine: {symbol: 'none',silent: false,itemStyle: {normal: {borderWidth: 2,lineStyle: {type: 'dashed',color: '#D0021B',width: 1.5},}},data: [{yAxis: $T0}]},data: $incom},{name: '同比',type: 'line',symbolSize: 8,color: '#01BF8F',// 使用【同比】规则yAxisIndex: 1,data: $percent}]
}
### 4. 让地图中显示的文字居中- 默认的文字显示位置的规则> 全国:省份名称默认位置是在省会的位置;<br />这个规则是 `jsonData.features[index].properties.cp` 字段的经纬度,两个数值设置的<br />- 解决方法> 参考文章:[地图区域的label 文字显示在区域边界上了,如何调整label的位置 #4866](https://github.com/apache/incubator-echarts/issues/4866#issuecomment-270562424)<br />
let mapJson = require(“@/utils/map/json/china.json”);
mapJson.features.forEach(element => { delete element.properties.cp; });
- 最后的显示效果> ### 5. 地图的默认大小和滚动缩放的功能设置
series: [ { name: “测试”, type: “map”, // 默认展示的比例 zoom: 1.2, // 是否开启平游或缩放 roam: true, // 滚轮缩放的极限控制 scaleLimit: { min: 1, max: 10 }, } ]
### 6. 为 `series.label.formatter` 函数内部的内容单独设置样式> [官网配置文档](https://echarts.apache.org/zh/option.html#series-funnel.label.rich)- 思路> 使用上面官方网站提供的方法添加一个样式变量,之后在 `formatter` 中使用- 配置源码
// 漏斗形funnelChart: {calculable: true,color: ["#FFA944", "#39A0FF"],series: [{name: "漏斗图",type: "funnel",gap: 1,width: "40%",left: "0",right: "0",top: "0",bottom: "0",minSize: "0%",maxSize: "100%",sort: "ascending",label: {show: true,formatter: params => {console.log(params);const { name = "", data = "", money = "" } =params.data || {};return `${name} ${data} {gray| ${money}元}`;},// 这里是增加自定义样式的地方,可在 label.formatter 中使用rich: {gray: {color: "gray"}}},labelLine: {length: 20,lineStyle: {width: 1,type: "solid"}},data: [{value: "10",data: "1000",money: 1000,name: "头部客户"},{value: "20",data: "3000",money: 3000,name: "其他客户"}]}]},
- 最终演示效果> ### 7. 将 `series[0].type = funnel` 的漏斗图,强行展示成一个固定的 "金字塔" 三角形> 查阅了很多资料,发现 `echarts` 一直都没有做 `金字塔` 图形的打算,由于 `funnel` 的本身的机制,很容易就造成生成出来的图表 "变形" 的问题,为了解决上述 "变形" 的问题,我只好取巧设置:将 `value` 的属性设置成 `1:2` 的值,注意 `这个 vlue 值,最终只是为了显示起来好看,显示数据的字段并不是这个`,所以需要手动增加展示数据的字段 `data`(这个属性可以自定义,只要在 `formatter` 时取对即可)- 配置源码
// 漏斗形funnelChart: {calculable: true,color: ["#FFA944", "#39A0FF"],series: [{name: "漏斗图",type: "funnel",gap: 1,width: "40%",left: "0",right: "0",top: "0",bottom: "0",minSize: "0%",maxSize: "100%",sort: "ascending",label: {show: true,formatter: params => {console.log(params);const { name = "", data = "", money = "" } =params.data || {};return `${name} ${data} {gray| ${money}元}`;},// 这里是增加自定义样式的地方,可在 label.formatter 中使用rich: {gray: {color: "gray"}}},labelLine: {length: 20,lineStyle: {width: 1,type: "solid"}},data: [{value: "10",data: "1000",money: 1000,name: "头部客户"},{value: "20",data: "3000",money: 3000,name: "其他客户"}]}]},
```
- 最终演示效果


若有收获,就点个赞吧
0 人点赞
