canvas
canvas 是 HTML5 的新特性,它允许我们使用 canvas 元素在网页上通过 JavaScript 绘制图像。
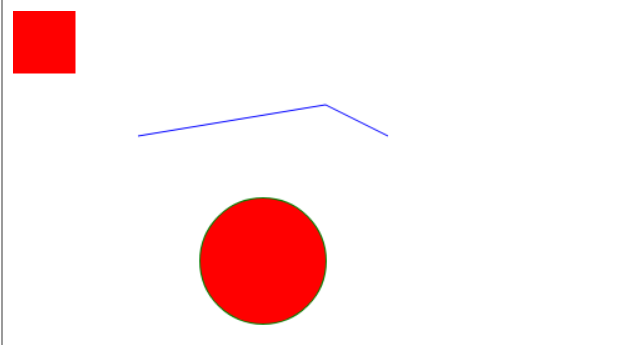
<html><head></head><body><canvas id="canvas" width="800" height="800"></canvas><script>const canvas = document.getElementById('canvas'); // 获取 DOM 对象const ctx = canvas.getContext('2d'); // 获取 Canvas 对象ctx.fillStyle = 'red'; // 填充为红色ctx.fillRect(0, 0, 50, 50); // 绘制矩形ctx.beginPath(); // 开始绘制路径ctx.lineWidth = 1; // 线条宽度ctx.strokeStyle = 'blue'; // 线条填充色ctx.moveTo(100, 100); // 起点坐标ctx.lineTo(250, 75); // 中间点坐标ctx.lineTo(300, 100); // 终点坐标ctx.stroke(); // 绘制线段ctx.beginPath();ctx.lineWidth = 2;ctx.strokeStyle = 'green'; // 圆形边框色ctx.fillStyle = 'red'; // 圆形填充色ctx.arc(200, 200, 50, 0, 2 * Math.PI); // 绘制圆形ctx.stroke(); // 绘制圆形的边框ctx.fill(); // 绘制圆形的填充色ctx.beginPath();ctx.lineWidth = 1;ctx.strokeStyle = 'red';ctx.moveTo(300, 300);ctx.lineTo(301, 301); // 绘制一个点ctx.stroke();</script></body></html>
步骤:
- 编写 canvas 标签(注意指定宽高)
- 获取 canvas DOM 对象
- 获取 Canvas 对象
- 设置绘图属性
- 调用绘图 API
svg
SVG是一种基于 XML 的图像文件格式,它的英文全称为Scalable Vector Graphics,意思为可缩放的矢量图形
<!DOCTYPE html><html><head></head><body><svg width="800" height="800"><rectwidth="50"height="50"style="fill:red;stroke-width:0;stroke:rgb(0,0,0);"/><linex1="100"y1="100"x2="250"y2="75"style="stroke:blue;stroke-width:1"/><linex1="250"y1="75"x2="300"y2="100"style="stroke:blue;stroke-width:1"/><circlecx="200"cy="200"r="50"stroke="green"stroke-width="2"fill="red"/><linex1="300"y1="300"x2="301"y2="301"style="stroke:red;stroke-width:1"/></svg></body></html>

步骤:
- 编写 svg 标签,指定宽高
- 编写 svg 绘图标签
- 编写绘图属性和样式

若有收获,就点个赞吧
0 人点赞
