1、Prometheus基本使用
1.1 Prometheus介绍
Prometheus(普罗米修斯)是一个最初在SoundCloud上构建的监控系统。自2012年成为社区开源项目,
拥有非常活跃的开发人员和用户社区。为强调开源及独立维护,Prometheus于2016年加入云原生云计算基
金会(CNCF),成为继Kubernetes之后的第二个托管项目。
Prometheus 特点:• 多维数据模型:由度量名称和键值对标识的时间序列数据• PromQL:一种灵活的查询语言,可以利用多维数据完成复杂的查询• 不依赖分布式存储,单个服务器节点可直接工作• 基于HTTP的pull方式采集时间序列数据• 推送时间序列数据通过PushGateway组件支持• 通过服务发现或静态配置发现目标• 多种图形模式及仪表盘支持(grafana)
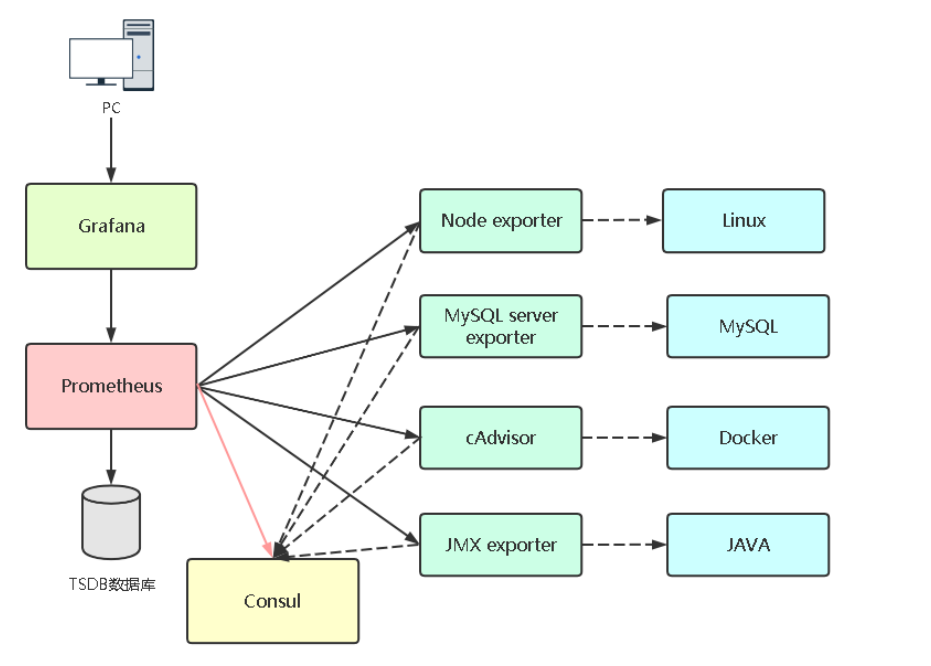
1.2 Prometheus组件与架构
https://prometheus.io/docs/introduction/overview/
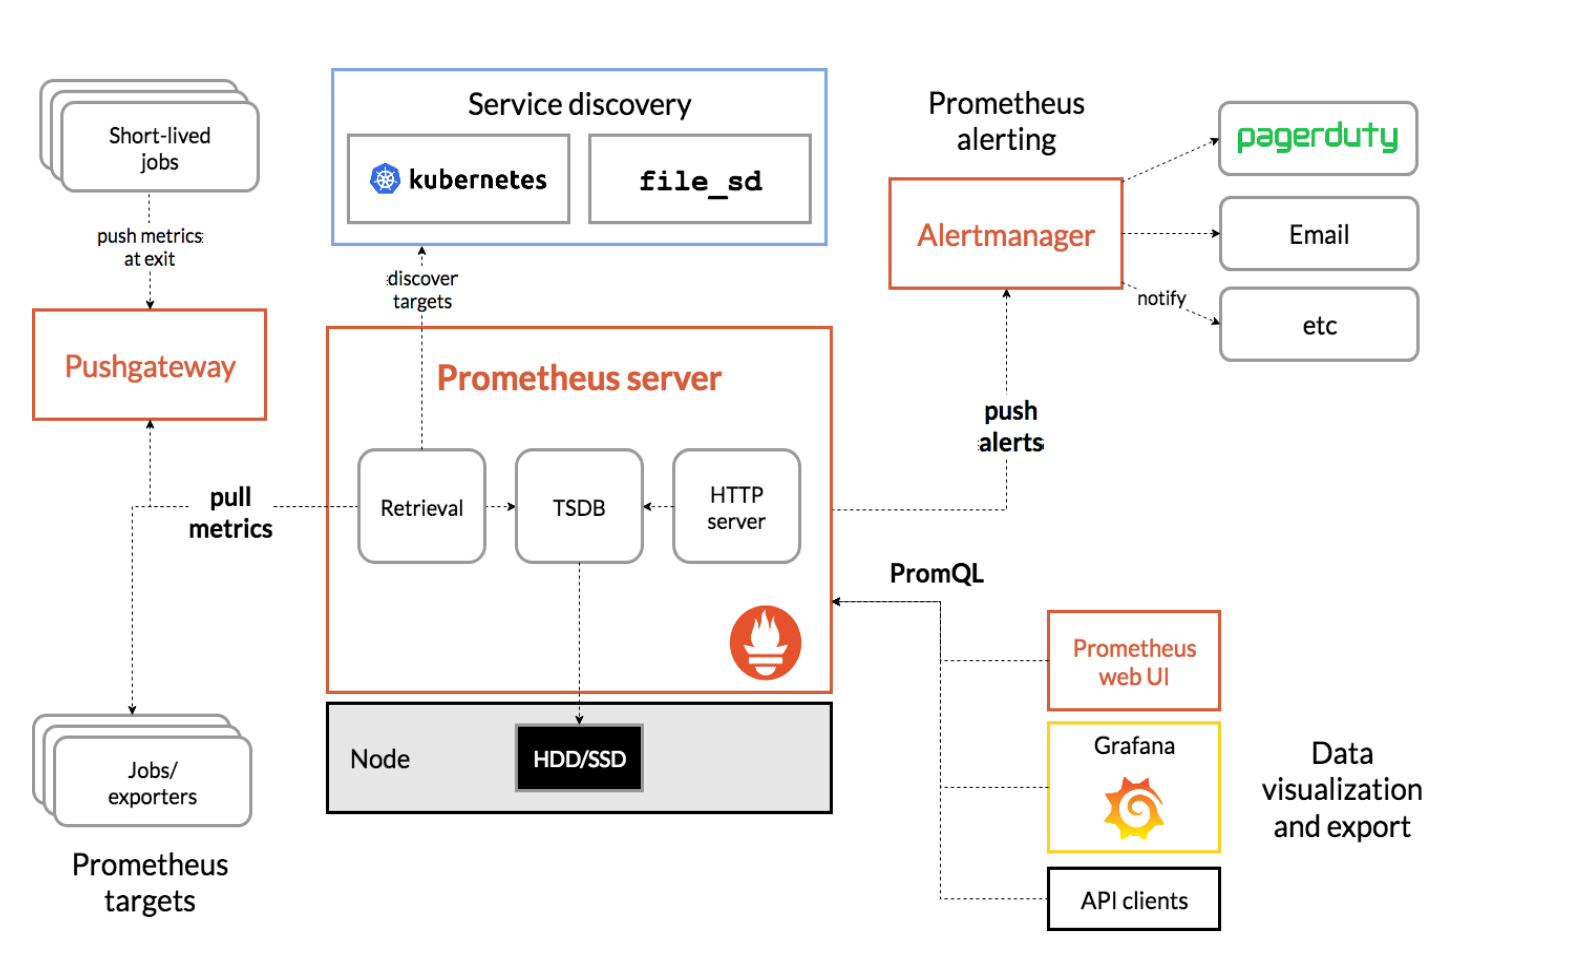
• Prometheus Server:收集指标和存储时间序列数据,并提供查询接口• ClientLibrary:客户端库• Push Gateway:短期存储指标数据。主要用于临时性的任务• Exporters:采集已有的第三方服务监控指标并暴露metrics• Alertmanager:告警• Web UI:简单的Web控制台
1.3 Prometheus部署
1.3.1 部署方式
• 二进制部署
https://prometheus.io/docs/prometheus/latest/getting_started/
• Docker部署
https://prometheus.io/docs/prometheus/latest/installation/
访问地址:http://IP:9090
./premetheus -h 命令行常用参数:• --config.file="prometheus.yml" # 指定配置文件• --web.listen-address= "0.0.0.0:9090" # 监听地址和端口• --log.level=info # 日志级别• --alertmanager.timeout=10s # 与报警组件的超时时间• --storage.tsdb.path="data/ " # 数据目录• --storage.tsdb.retention.time=15d # 数据保存时间,默认15天
- promtool 检查Prometheus语法
# 检查配置文件是否正确./promtool check config prometheus.yaml
1.3.2 使用systemd服务管理Prometheus
配置为系统服务管理:# vi /usr/lib/systemd/system/prometheus.service[Unit]Description=prometheus[Service]ExecStart=/opt/monitor/prometheus/prometheus --config.file=/opt/monitor/prometheus/prometheus.ymlExecReload=/bin/kill -HUP $MAINPIDKillMode=processRestart=on-failure[Install]WantedBy=multi-user.target# systemctl daemon-reload# systemctl start prometheus# systemctl enable prometheus
Prometheus添加访问时账号认证
- 查看prometheus相关参数
:::info —web.config.file=
:::
./prometheus --helpusage: prometheus [<flags>]The Prometheus monitoring serverFlags:-h, --help Show context-sensitive help (also try --help-long and --help-man).--version Show application version.--config.file="prometheus.yml"Prometheus configuration file path.--web.listen-address="0.0.0.0:9090"Address to listen on for UI, API, and telemetry.--web.config.file="" [EXPERIMENTAL] Path to configuration file that can enable TLS or authentication....
- 加密basic_auth
#安装工具包yum install -y httpd-tools#生成加密密码htpasswd -nBC 12 '' | tr -d ':\n'New password: # 这里设置密码为SZ_mssq@2022,实际使用请按照自己的集群需求定义密码Re-type new password:#生成的密码信息$2y$12$Ny/LBvgnADZpCZzHIg1CQOOlvnCpPZweZd/ULT9BS159BUAQKijqq
- 将秘钥写入配置文件
cat /data/prometheus/config.ymlbasic_auth_users:# 当前设置的用户名为admin, 可以设置多个admin: $2y$12$Ny/LBvgnADZpCZzHIg1CQOOlvnCpPZweZd/ULT9BS159BUAQKijqq
- 修改Prometheus配置文件
cat prometheus.ymlscrape_configs:- job_name: 'prometheus'basic_auth:username: adminpassword: SZ_mssq@2022static_configs:- targets: ['prometheus:9090']
- 添加启动环境变量
修改/usr/lib/systemd/system/prometheus.service文件,在ExecStart后面追加–web.config.file=/xx/xx/xx/config.yml
ExecStart=/data/prometheus/prometheus --config.file=/data/prometheus/prometheus.yml --web.config.file=/data/prometheus/config.yml
1.3.3 docker部署
进入到加压目录或者配置文件目录docker run -d --restart always\-p 9090:9090 \--name prometheus \-v $PWD/prometheus.yml:/etc/prometheus/prometheus.yml \bitnami/prometheus# 或者docker run -d --restart always\-p 9090:9090 \--name prometheus \-v $PWD/prometheus.yml:/opt/prometheus/conf/prometheus.yml \geray/prometheus:2.36.1
1.4 Prometheus配置文件
prometheus.yml
# 全局配置global:scrape_interval: 15s # 采集数据时间间隔,默认15秒evaluation_interval: 15s # 评估告警规则时间间隔,默认1分钟# scrape_timeout # 采集数据超时时间,默认10秒# 告警规则alerting: # 告警配置alertmanagers:- static_configs:- targets:# - alertmanager:9093# Load rules once and periodically evaluate them according to the global 'evaluation_interval'.rule_files: # 告警规则# - "first_rules.yml"# - "second_rules.yml"# A scrape configuration containing exactly one endpoint to scrape:# Here it's Prometheus itself.scrape_configs:# 配置被监控端,称为target,每个target用job_name分组管理,又分为静态配置和服务发现- job_name: 'prometheus' # 分组管理,又分为静态配置和服务发现# metrics_path defaults to '/metrics' # 暴露接口的地址# scheme defaults to 'http'.static_configs:- targets: ['localhost:9090']
- 每次向配置文件中配置后,重启服务开销比较大,可以使用kill热加载(signal)
# 检查配置文件是否正确$ ./promtool check config prometheus.ymlChecking ./prometheus.ymlSUCCESS: 0 rule files found# 热加载配置文件$ kill -HUP <pid>
1.5 配置文件解析
1.5.1 配置文件
参考文档:https://prometheus.io/docs/prometheus/latest/configuration/configuration/
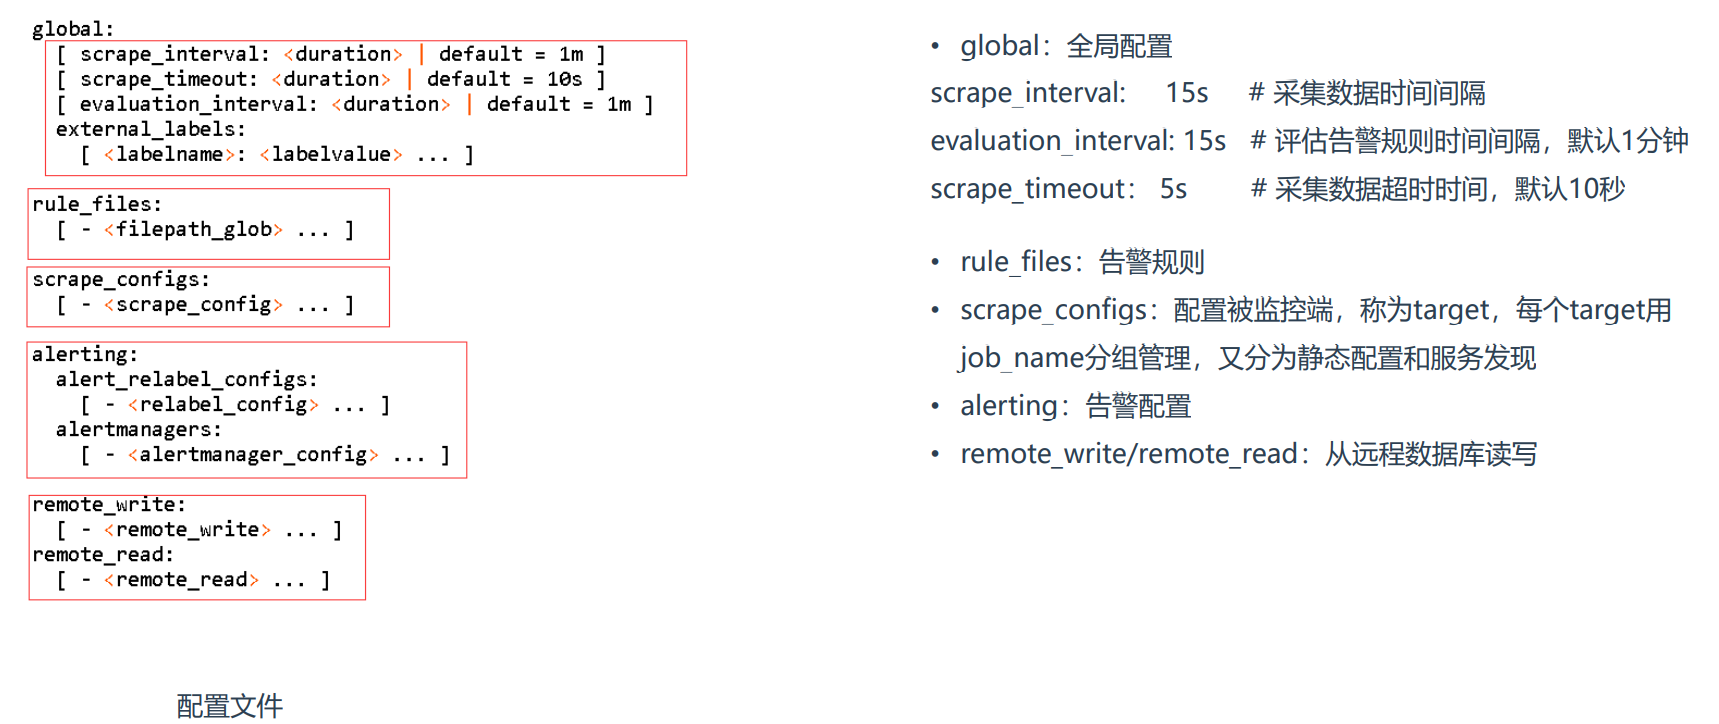
• global:全局配置scrape_interval: 15s # 采集数据时间间隔evaluation_interval: 15s # 评估告警规则时间间隔,默认1分钟scrape_timeout: 5s # 采集数据超时时间,默认10秒• rule_files:告警规则• scrape_configs:配置被监控端,称为target,每个target用job_name分组管理,又分为静态配置和服务发现• alerting:告警配置• remote_write/remote_read:从远程数据库读写
1.5.2 配置被监控端
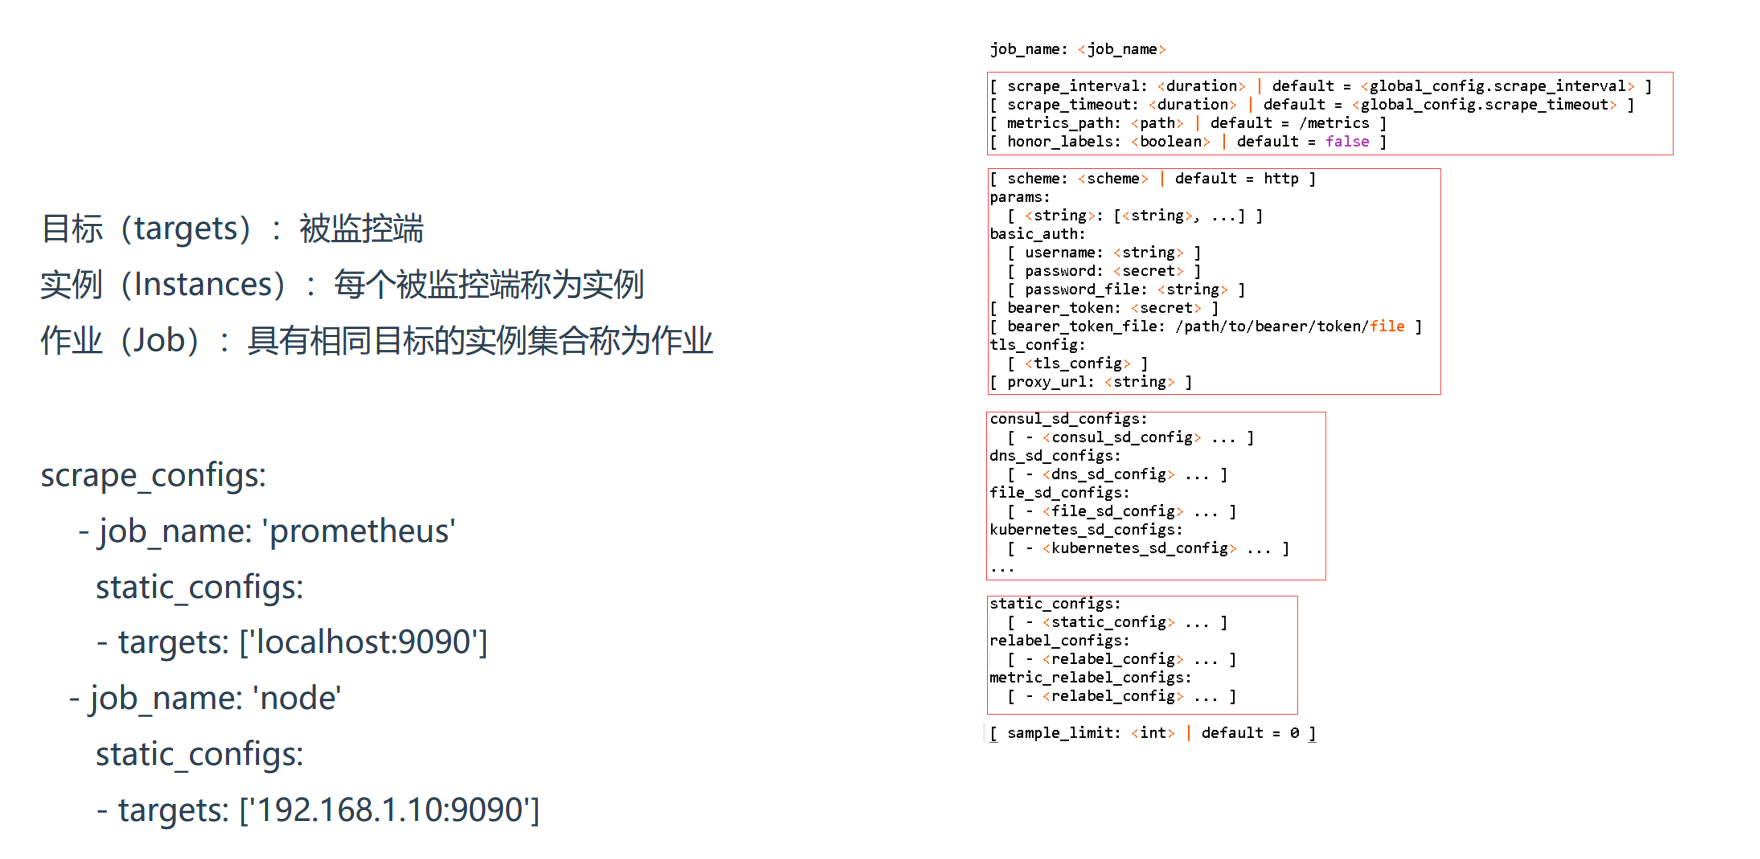
目标(targets):被监控端实例(Instances):每个被监控端称为实例作业(Job):具有相同目标的实例集合称为作业scrape_configs:- job_name: 'prometheus'metrics_path: '/metrics'scheme: 'http'.static_configs:- targets: ['localhost:9090']
1.5.3 监控指标数据模型
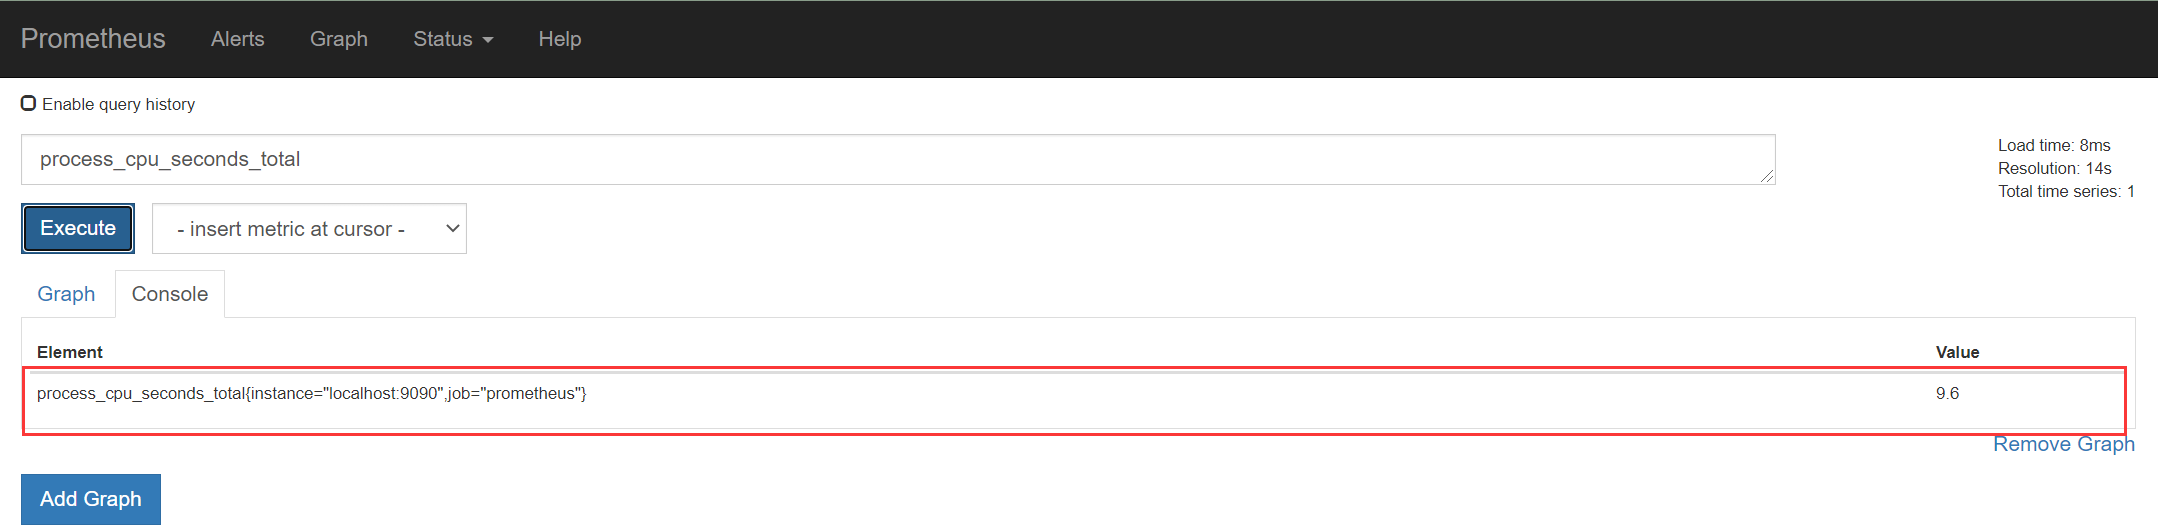
数据模型:• Prometheus将所有数据存储为时间序列;• 具有相同度量名称以及标签属于同一个指标;• 每个时间序列都由度量标准名称和一组键值对(称为标签)唯一标识,通过标签查询指定指标。指标格式:<metric name>{<label name>=<label value>,...}

2、监控案例
2.1 如何监控服务
exporter列表:
https://prometheus.io/docs/instrumenting/exporters
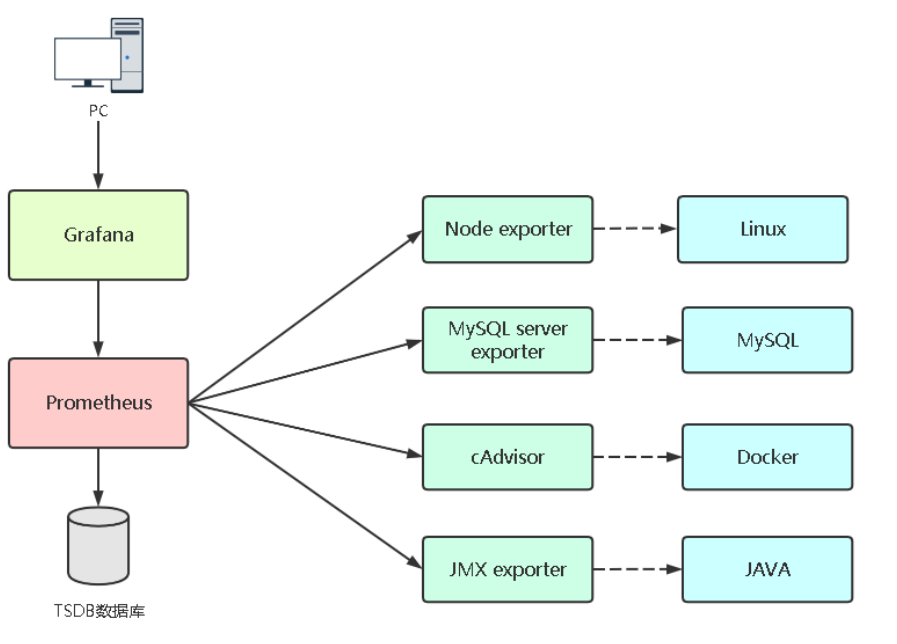
如果要想监控,前提是能获取被监控端指标数据,并且这个数据格式必须遵循Prometheus数据模型,这样才能识别和采集,一般使用exporter提供监控指标数据。
2.2 Grafana部署
Grafana是一个开源的度量分析和可视化系统。
部署文档:https://grafana.com/grafana/download
访问地址:http://IP:3000
用户名/密码:admin/admin
- 第一次需要重置密码
./grafana-cli admin reset-admin-password admin@123
1. 解压配置
tar -xf grafana-enterprise-8.5.5.linux-amd64.tar.gzln -s grafana-8.5.5/ grafana# 创建用户授权(-M不创建用户的主目录)useradd -s /sbin/nologin -M grafanachown -R grafana:grafana /opt/grafana/mkdir /opt/grafana/{data,logs}# 修改配置文件vim /opt/grafana/conf/defaults.inidata = /opt/grafana/datalogs = /opt/grafana/logsplugins = /opt/grafana/pluginsprovisioning = /opt/grafana/conf/provisioning
2. 使用systemd服务管理
配置为系统服务管理:vi /usr/lib/systemd/system/grafana.service[Unit]Description=grafana[Service]User=grafanaGroup=grafanaExecStart=/opt/grafana/bin/grafana-server -homepath=/opt/grafanaExecReload=/bin/kill -HUP $MAINPIDKillMode=processRestart=on-failure[Install]WantedBy=multi-user.targetsystemctl daemon-reloadsystemctl start grafanasystemctl status grafanasystemctl enable grafana
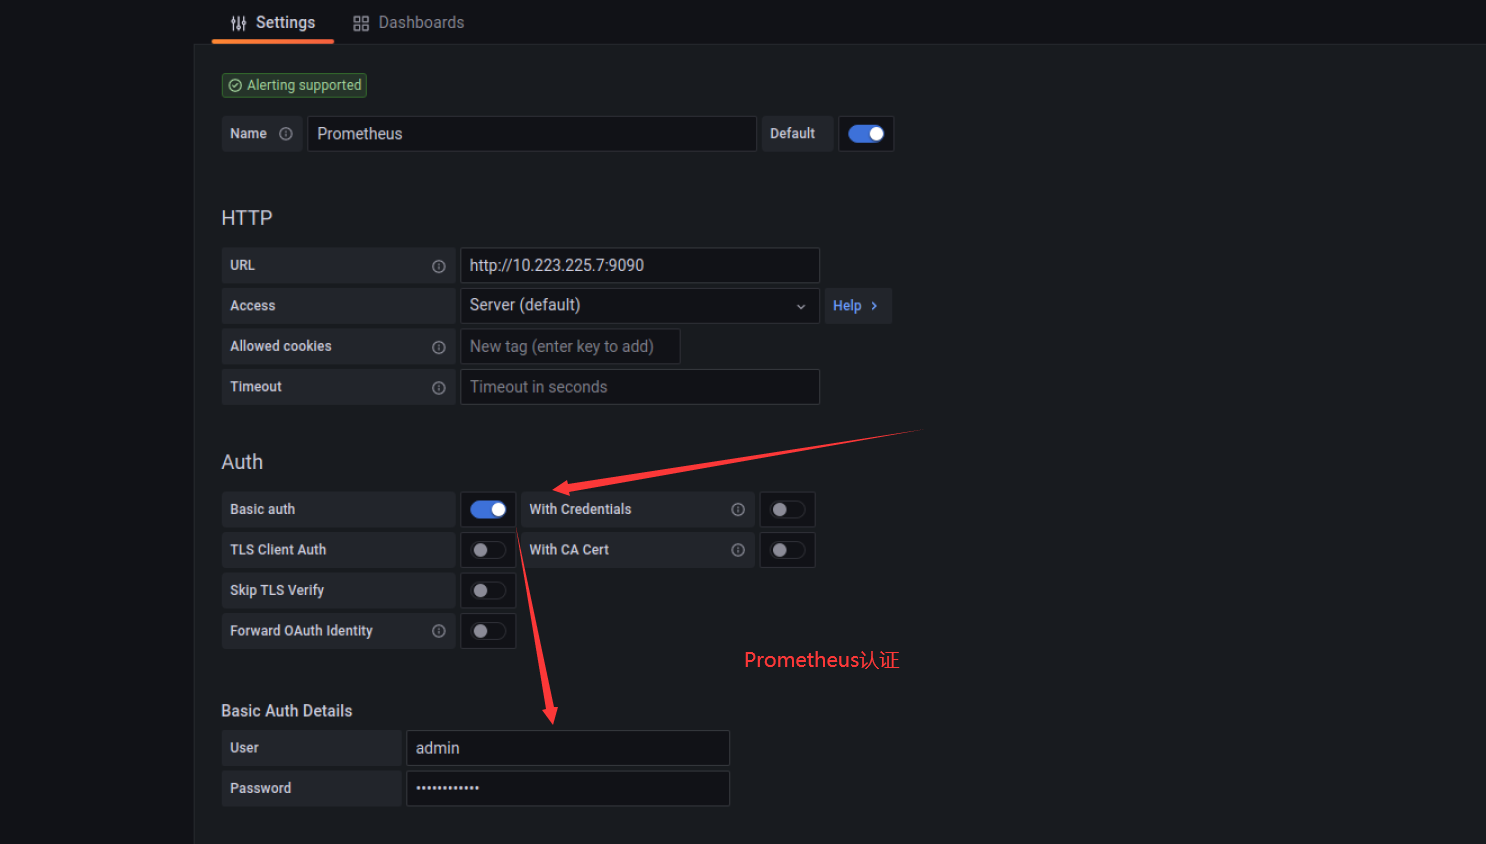
Grafana只用于展示数据,但这个数据从哪里来?
需要你根据提供数据的服务选择,支持的数据源如下:(选择Prometheus,只需要指定URL即可)
添加认证如下
3. docker部署
admin/admin
docker run \--user root \-d \-p 3000:3000 \--name=grafana \-v /docker/grafana/:/var/lib/grafana \-v grafana_conf:/etc/grafana/ \grafana/grafana
2.3 监控Linux服务
使用文档:https://prometheus.io/docs/guides/node-exporter/
GitHub:https://github.com/prometheus/node_exporter
node_exporter:用于监控Linux系统的指标采集器。常用指标:• CPU• 内存• 硬盘• 网络流量• 文件描述符• 系统负载• 系统服务数据接口:http://IP:9100
使用systemd服务管理:
wget https://github.com/prometheus/node_exporter/releases/download/v1.3.1/node_exporter-1.3.1.linux-amd64.tar.gz# 配置为系统服务管理:# vi /usr/lib/systemd/system/node_exporter.service[Unit]Description=node_exporter[Service]ExecStart=/usr/local/node_exporter/node_exporter --web.listen-address=192.168.6.10:9100ExecReload=/bin/kill -HUP $MAINPIDKillMode=processRestart=on-failure[Install]WantedBy=multi-user.target# systemctl daemon-reload# systemctl start node_exporter# systemctl enable node_exporter
2.3.1 添加Prometheus配置
# 添加监控- job_name: 'k8s-host'metrics_path: '/metrics'scheme: 'http'static_configs:- targets: ['192.168.6.31:9100','192.168.6.32:9100']
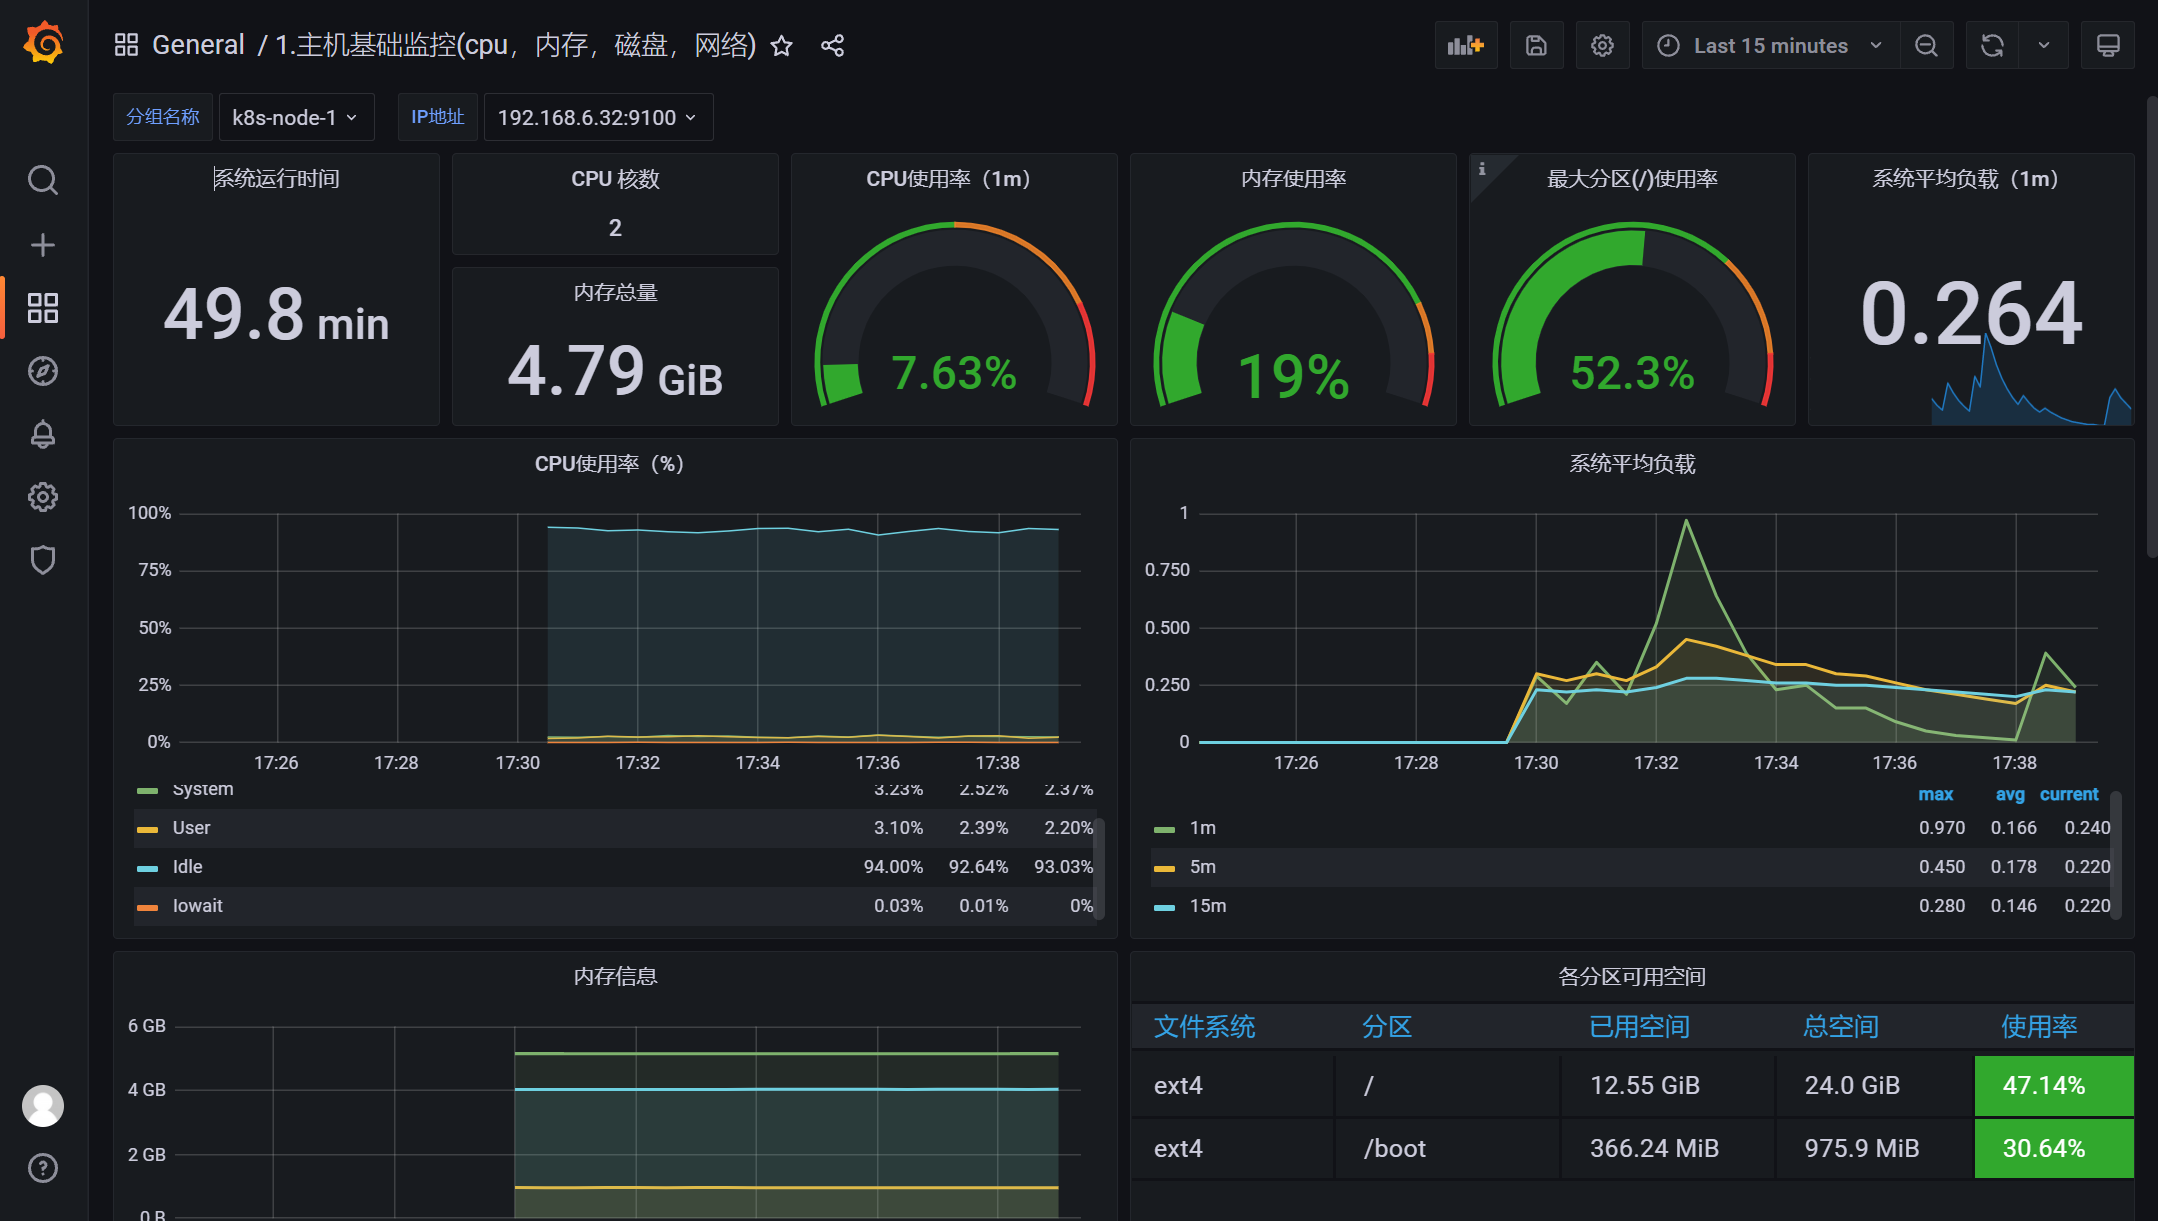
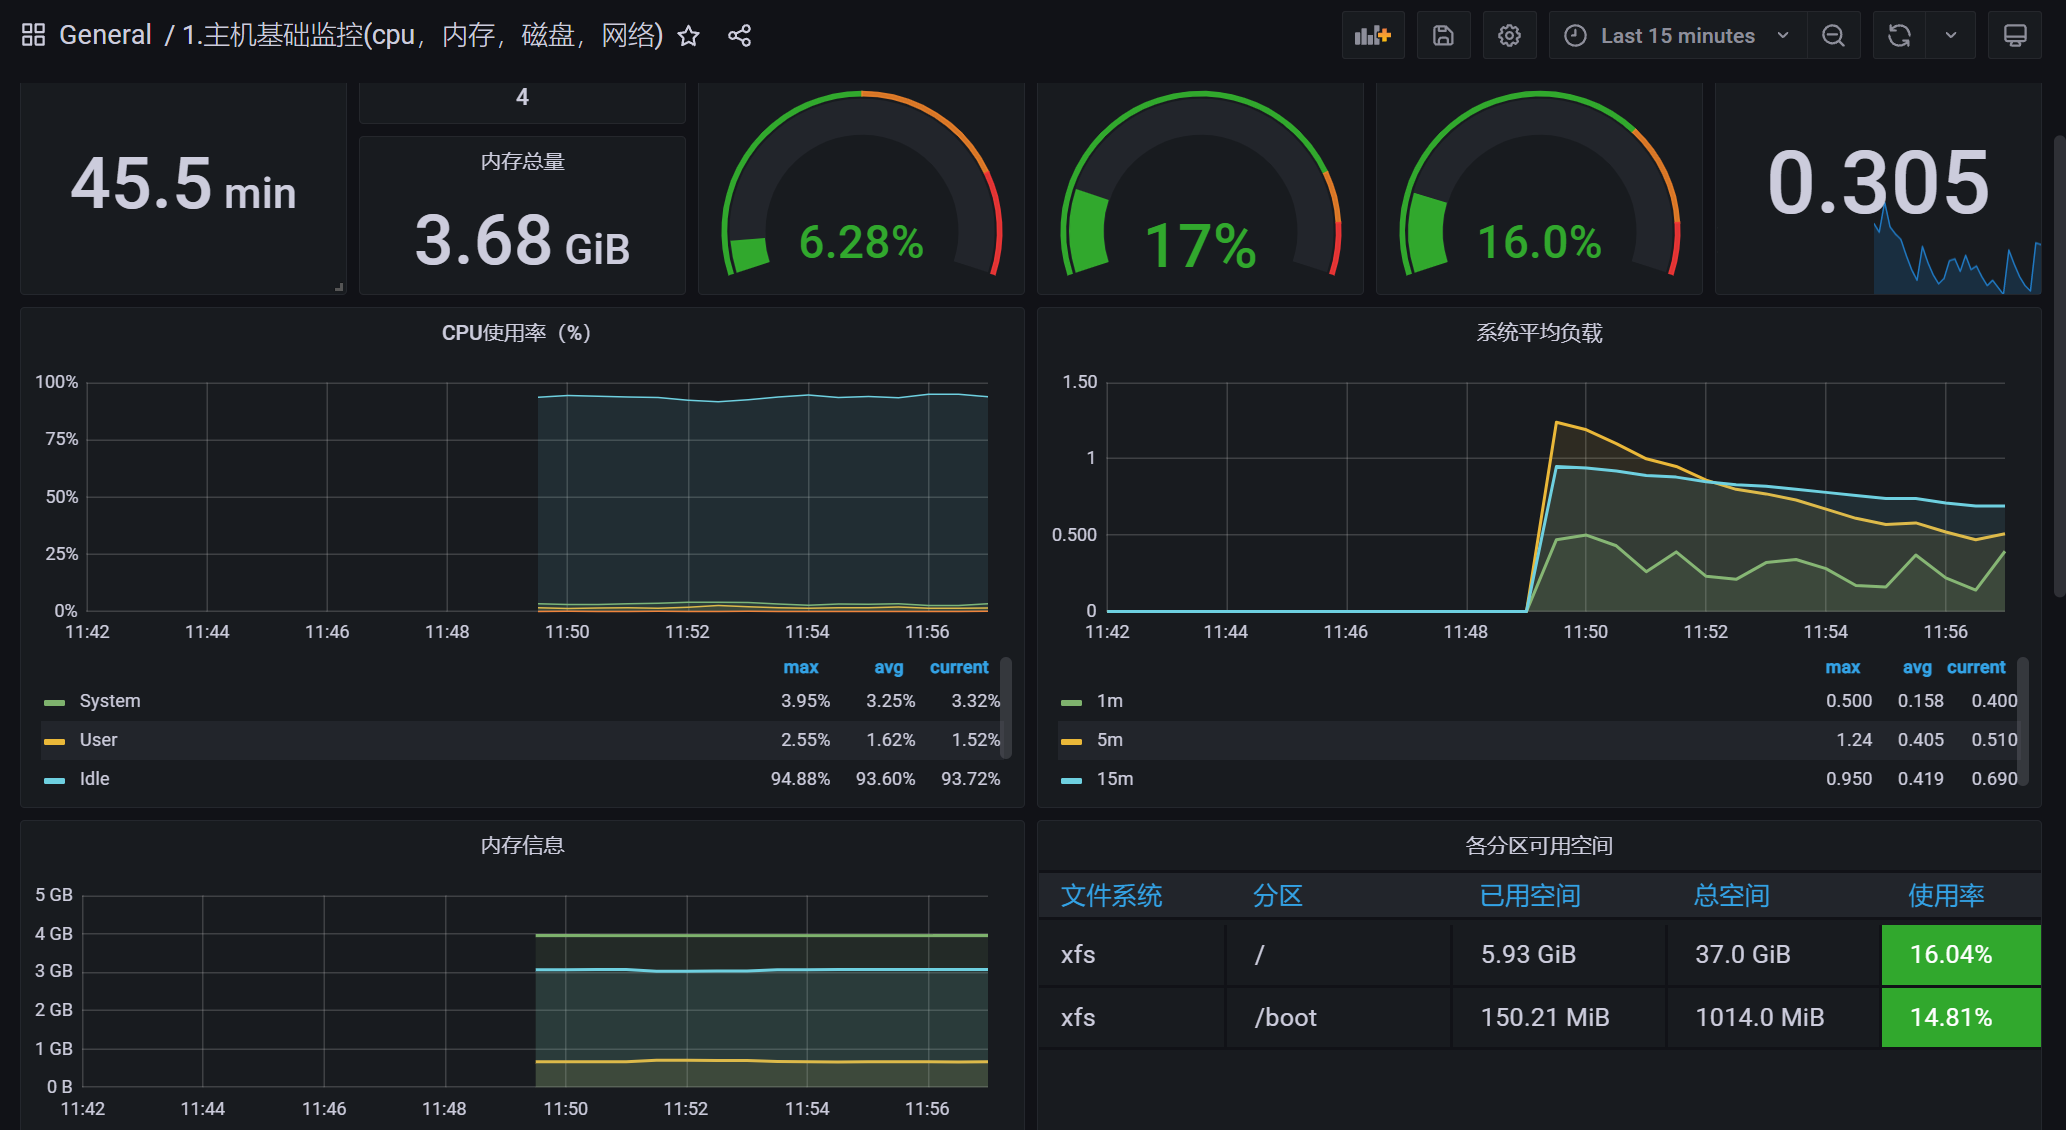
2.3.2 添加grafana仪表盘(仪表盘ID: 9276)
https://grafana.com/grafana/dashboards/
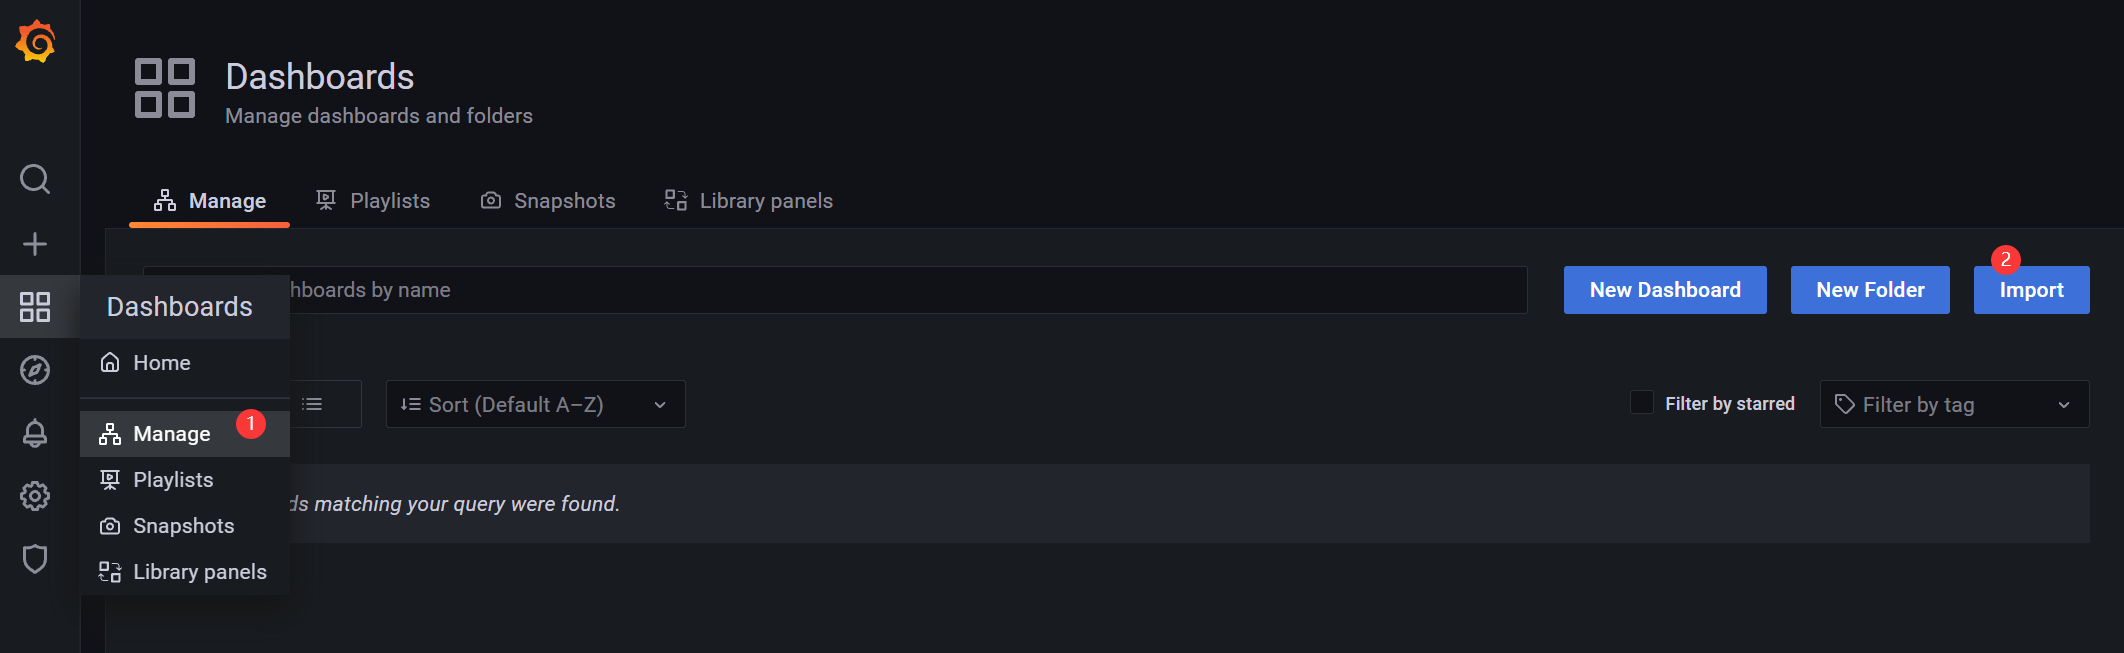
仪表盘ID: 9276
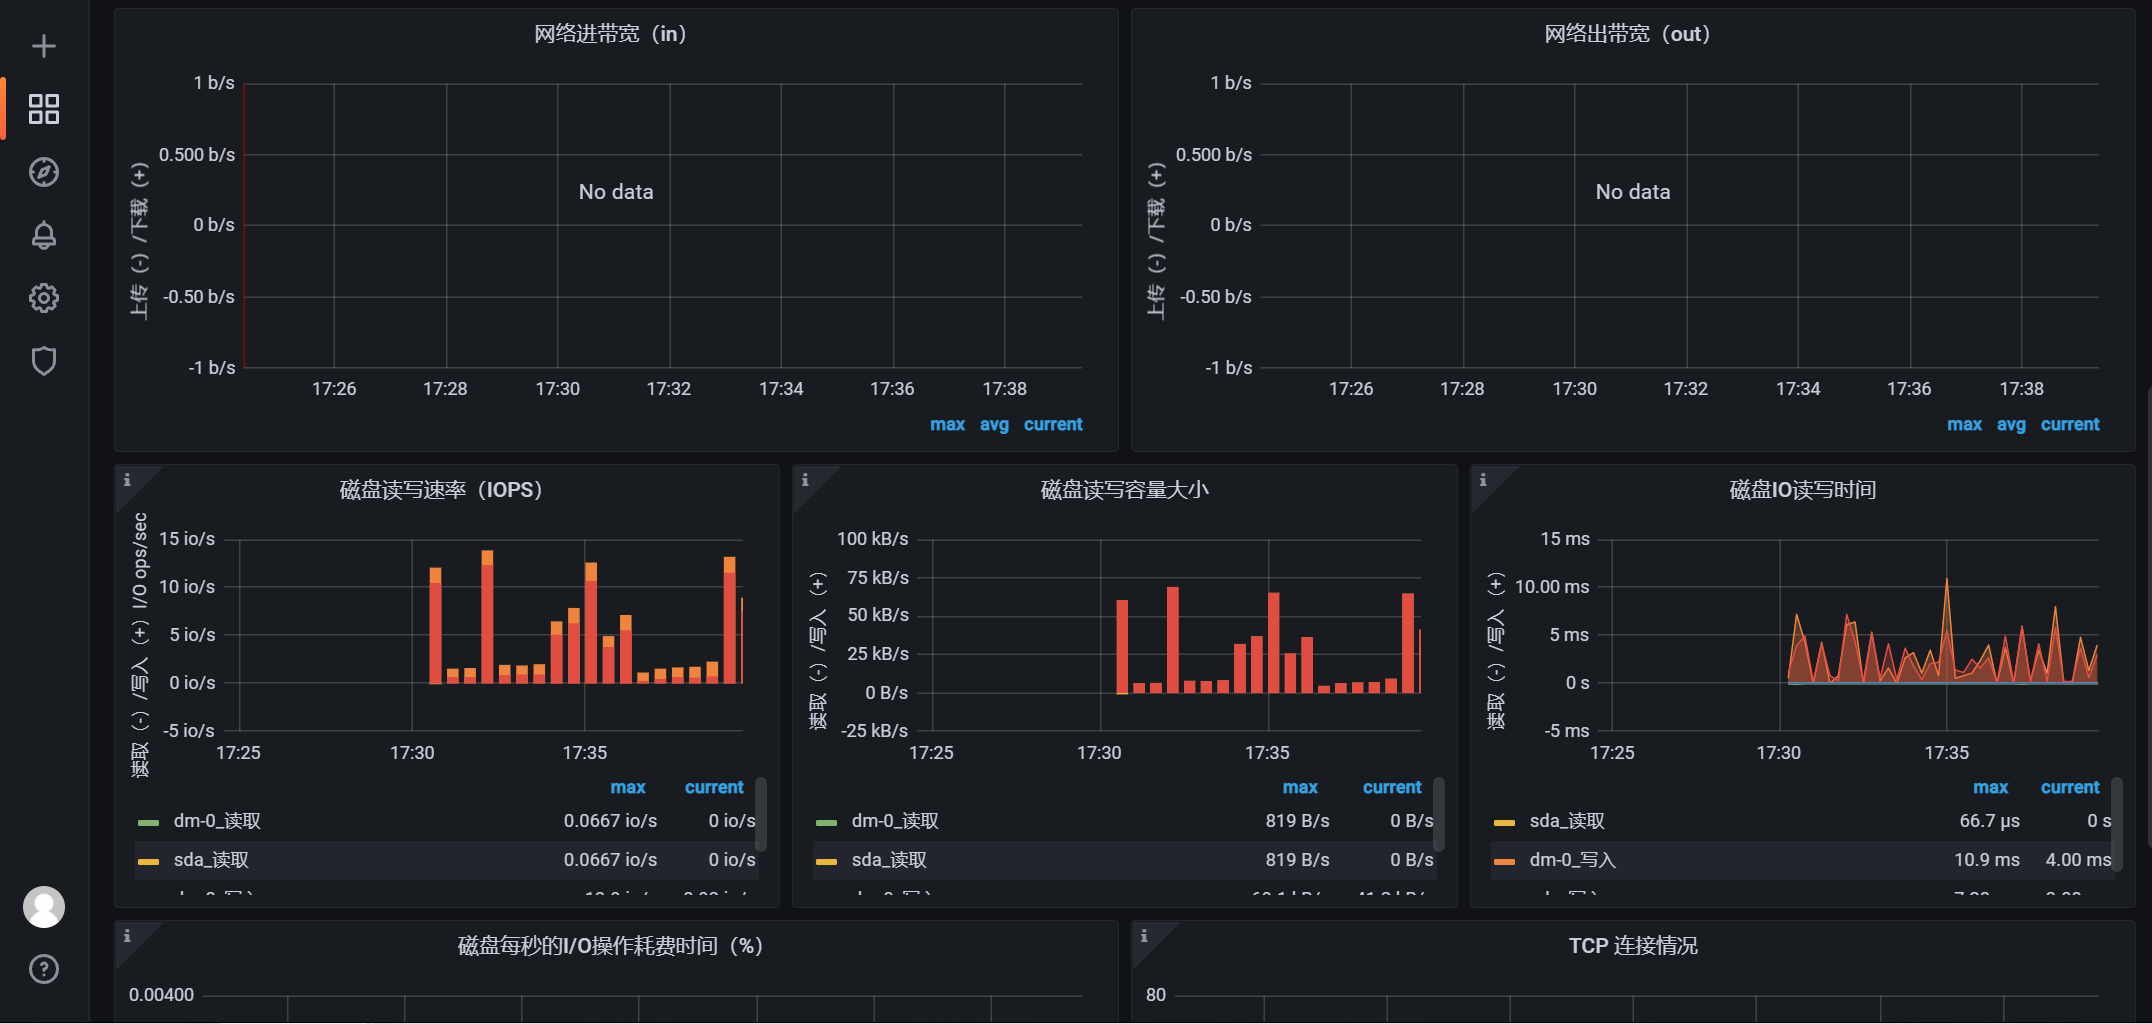
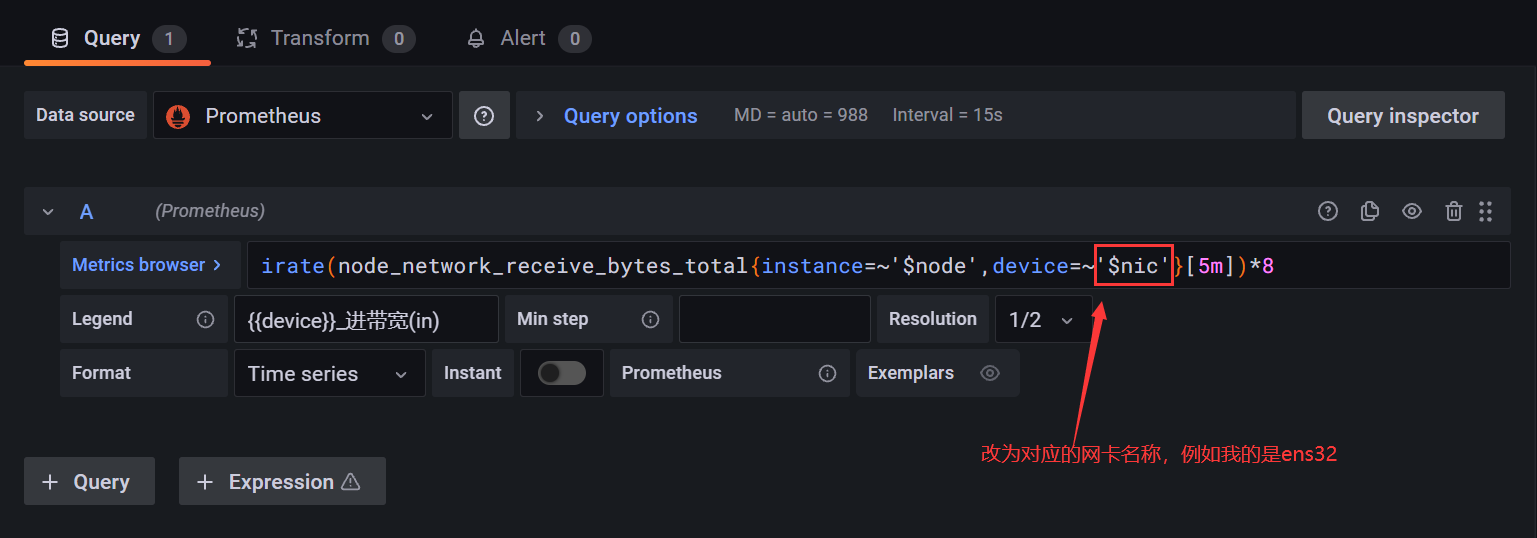
2.3.3 网络无数据 - 监控指标的设备名称不合适
例如我的是ens32网卡名称

2.3.4 启用HTTP认证暴露指标接口
加密:
# 安装加密工具apt install apache2-utils -yyum install httpd-tools –y$ htpasswd -nBC 12 '' | tr -d ':\n'New password:Re-type new password:$2y$12$8K7NFVCXqygXELVsX4mtqO2dHfoxb3CTkU2qkB/P5jAY7JgoGRLC2
- $2y$12$8K7NFVCXqygXELVsX4mtqO2dHfoxb3CTkU2qkB/P5jAY7JgoGRLC2 (123456加密后的内容)
# 启用HTTP认证$ vi /usr/local/node_exporter/config.ymlbasic_auth_users:# 用户名: 密码prometheus: $2y$12$8K7NFVCXqygXELVsX4mtqO2dHfoxb3CTkU2qkB/P5jAY7JgoGRLC2
指定ExecStart参数,使node_export加载该配置:
ExecStart=/usr/local/node_exporter/node_exporter --web.config=/usr/local/node_exporter/config.ymlsystemctl daemon-reloadsystemctl restart node_exporter.service
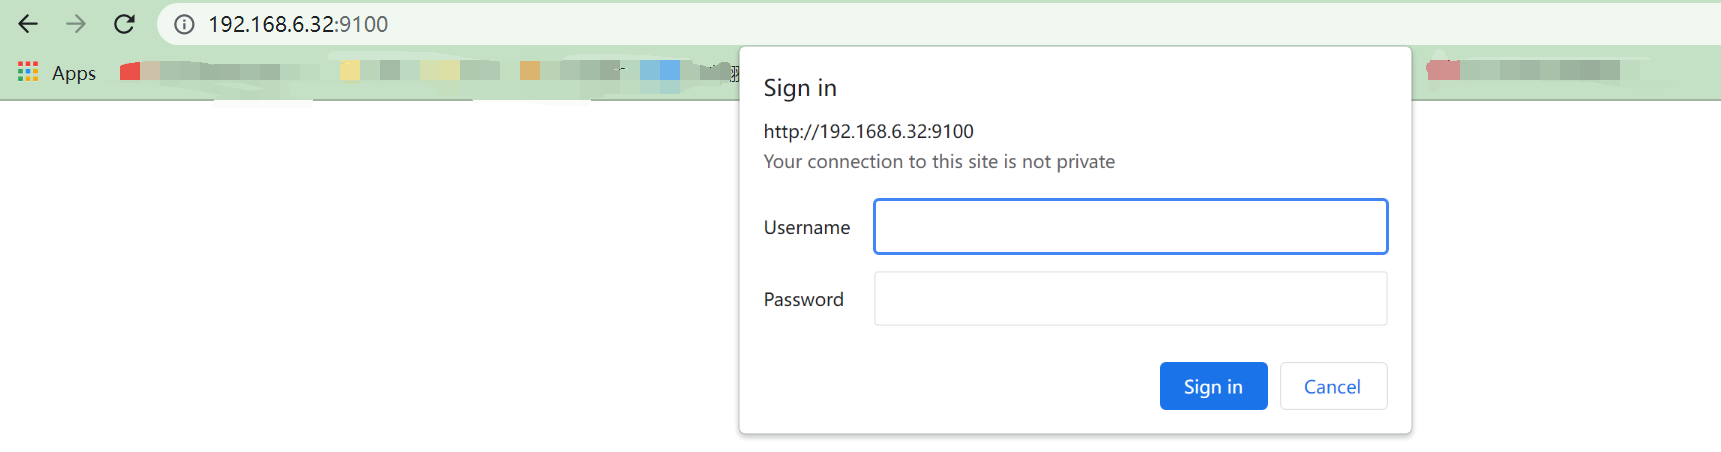
- 用户名密码就是config.yml配置文件中的(prometheus/123456)
Prometheus监控添加认证
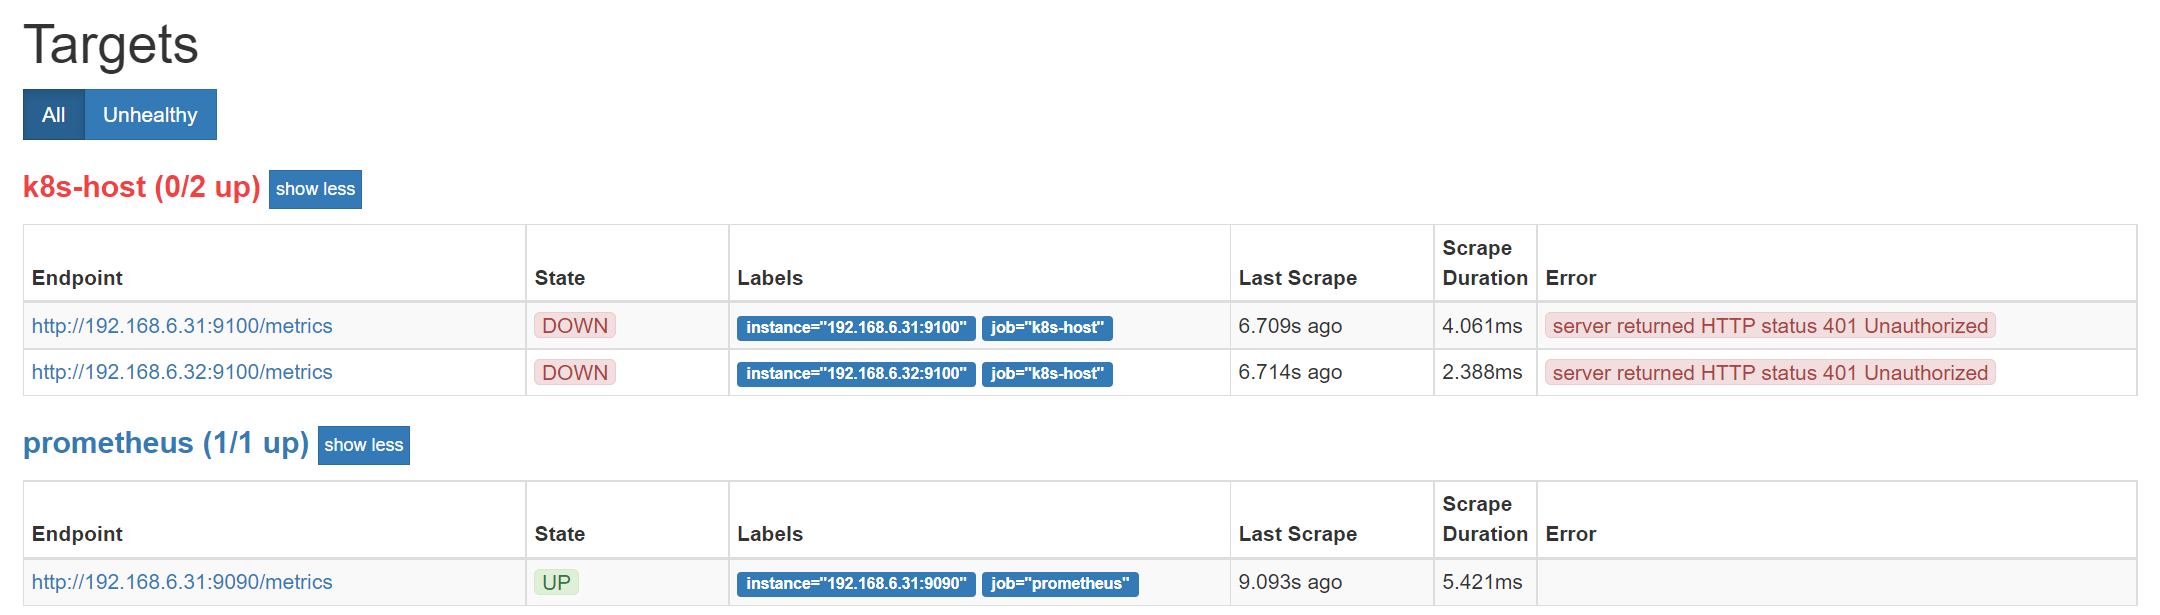
- job_name: 'k8s-host'metrics_path: '/metrics'scheme: 'http'basic_auth: # 添加认证username: prometheuspassword: 123456static_configs:- targets: ['192.168.6.31:9100','192.168.6.32:9100']
2.4 监控监控系统服务运行状态
使用node_exporter,添加相关服务启动参数
https://github.com/prometheus/node_exporter
# 可以使用一下命令查看参数./node_exporter --helpExecStart=/usr/local/node_exporter/node_exporter --web.config=/usr/local/node_exporter/config.yml --collector.systemd --collector.systemd.unit-whitelist=(docker|sshd|nginx|kubelet).service
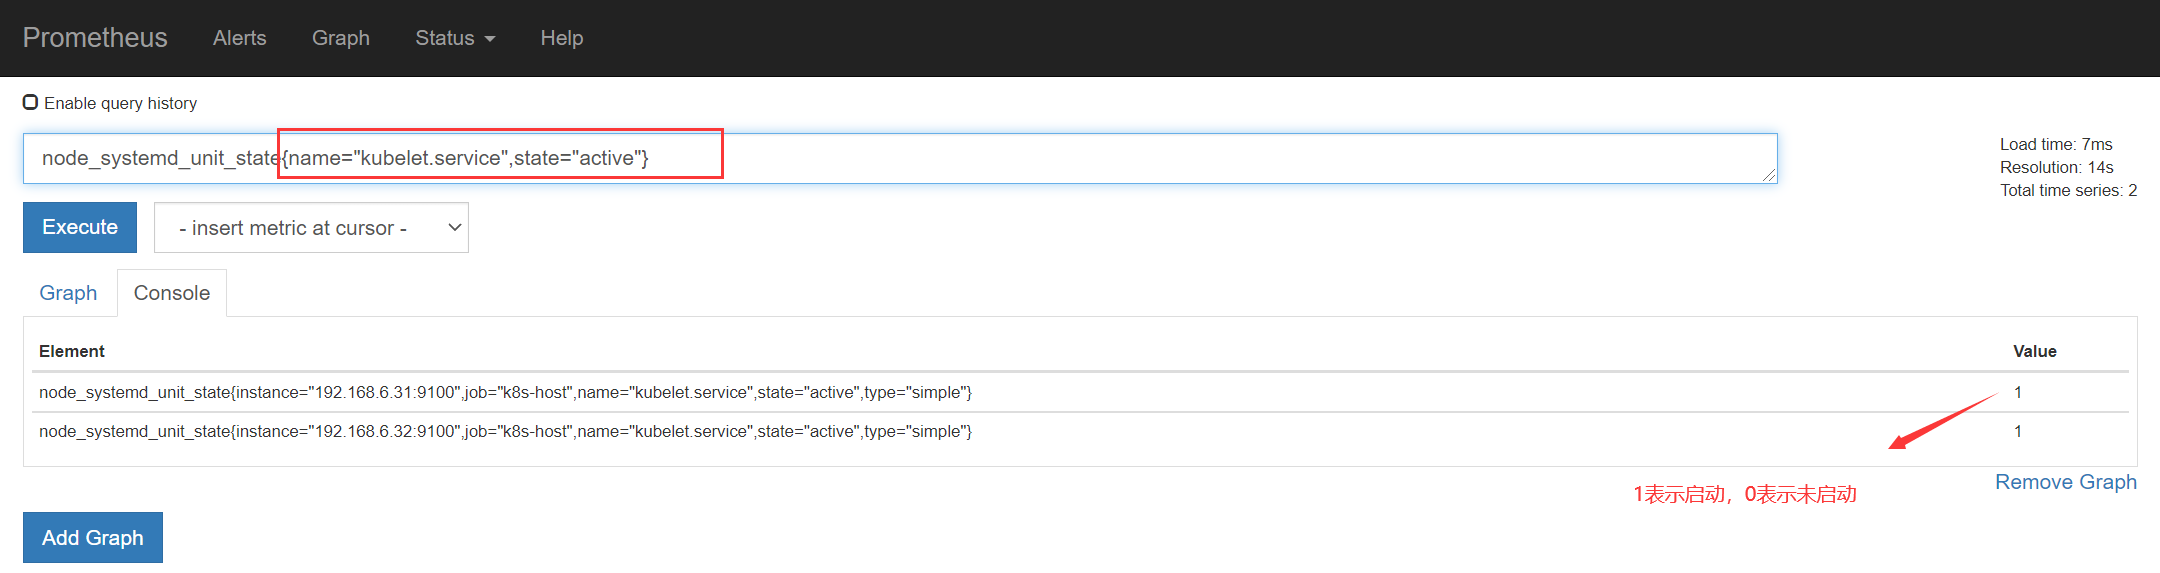
使用PromSQL过滤查询想要的服务指标
# 获取服务名称是kubelet,状态为active的指标node_systemd_unit_state{name="kubelet.service",state="active"}
- 后面的Value值可以看到是否处于启动状态
2.5 监控Docker服务
项目地址:https://github.com/google/cadvisor
cAdvisor (Container Advisor) :用于收集正在运行的容器资源使用和性能信息。
# Docker部署cAdvisor:docker run -d --restart always \--volume=/:/rootfs:ro \--volume=/var/run:/var/run:ro \--volume=/sys:/sys:ro \--volume=/var/lib/docker/:/var/lib/docker:ro \--volume=/dev/disk/:/dev/disk:ro \--publish=8080:8080 \--detach=true \--name=cadvisor \--privileged=true \google/cadvisor:latest
- 访问地址:ip:8080
docker logs -f cadvisorW0816 09:41:28.976241 1 manager.go:349] Could not configure a source for OOM detection, disabling OOM events: open /dev/kmsg: no such file or directory
- 该问题是由于配置权限导致,需要配置特权
--privileged=true

2.5.1 添加Prometheus配置
- job_name: 'docker'static_configs:- targets: ['192.168.6.31:8080']
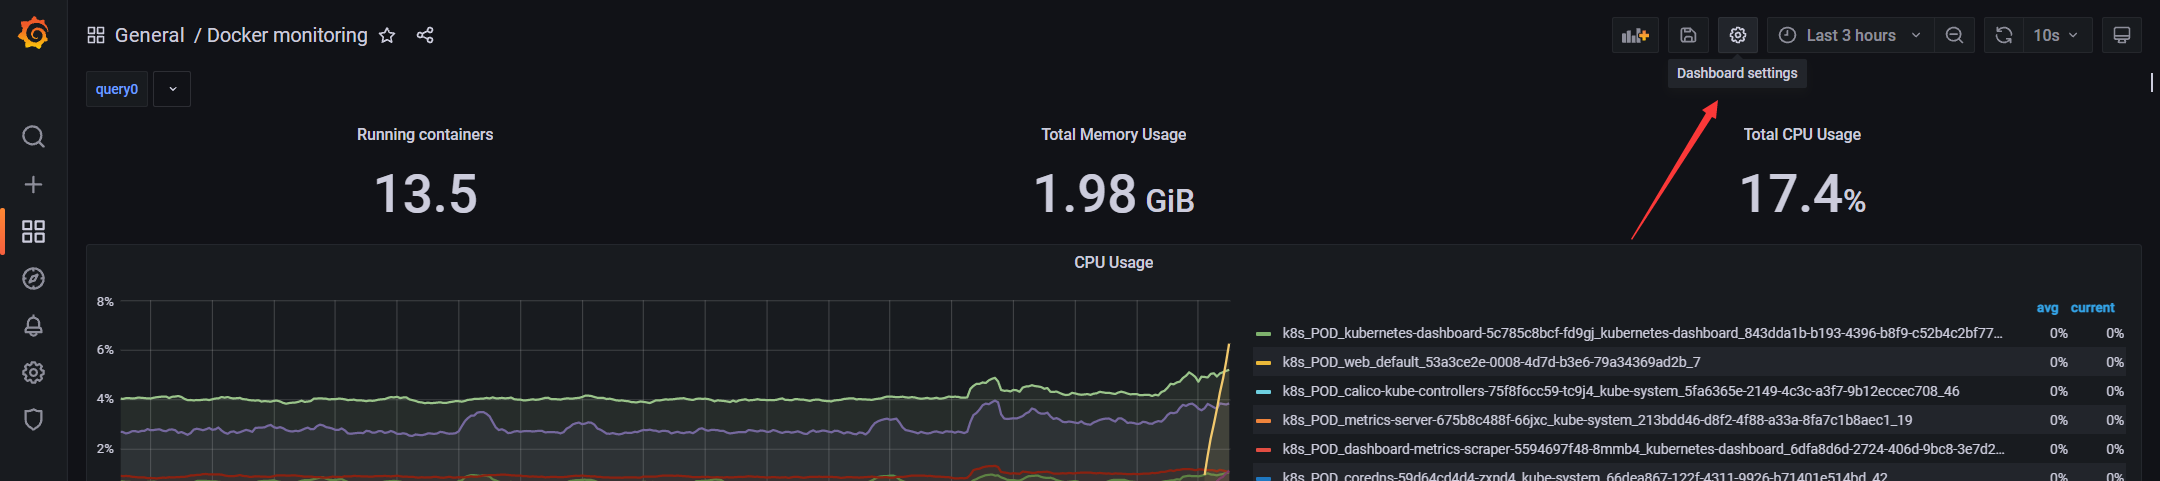
2.5.2 添加grafana仪表盘(仪表盘ID:193)

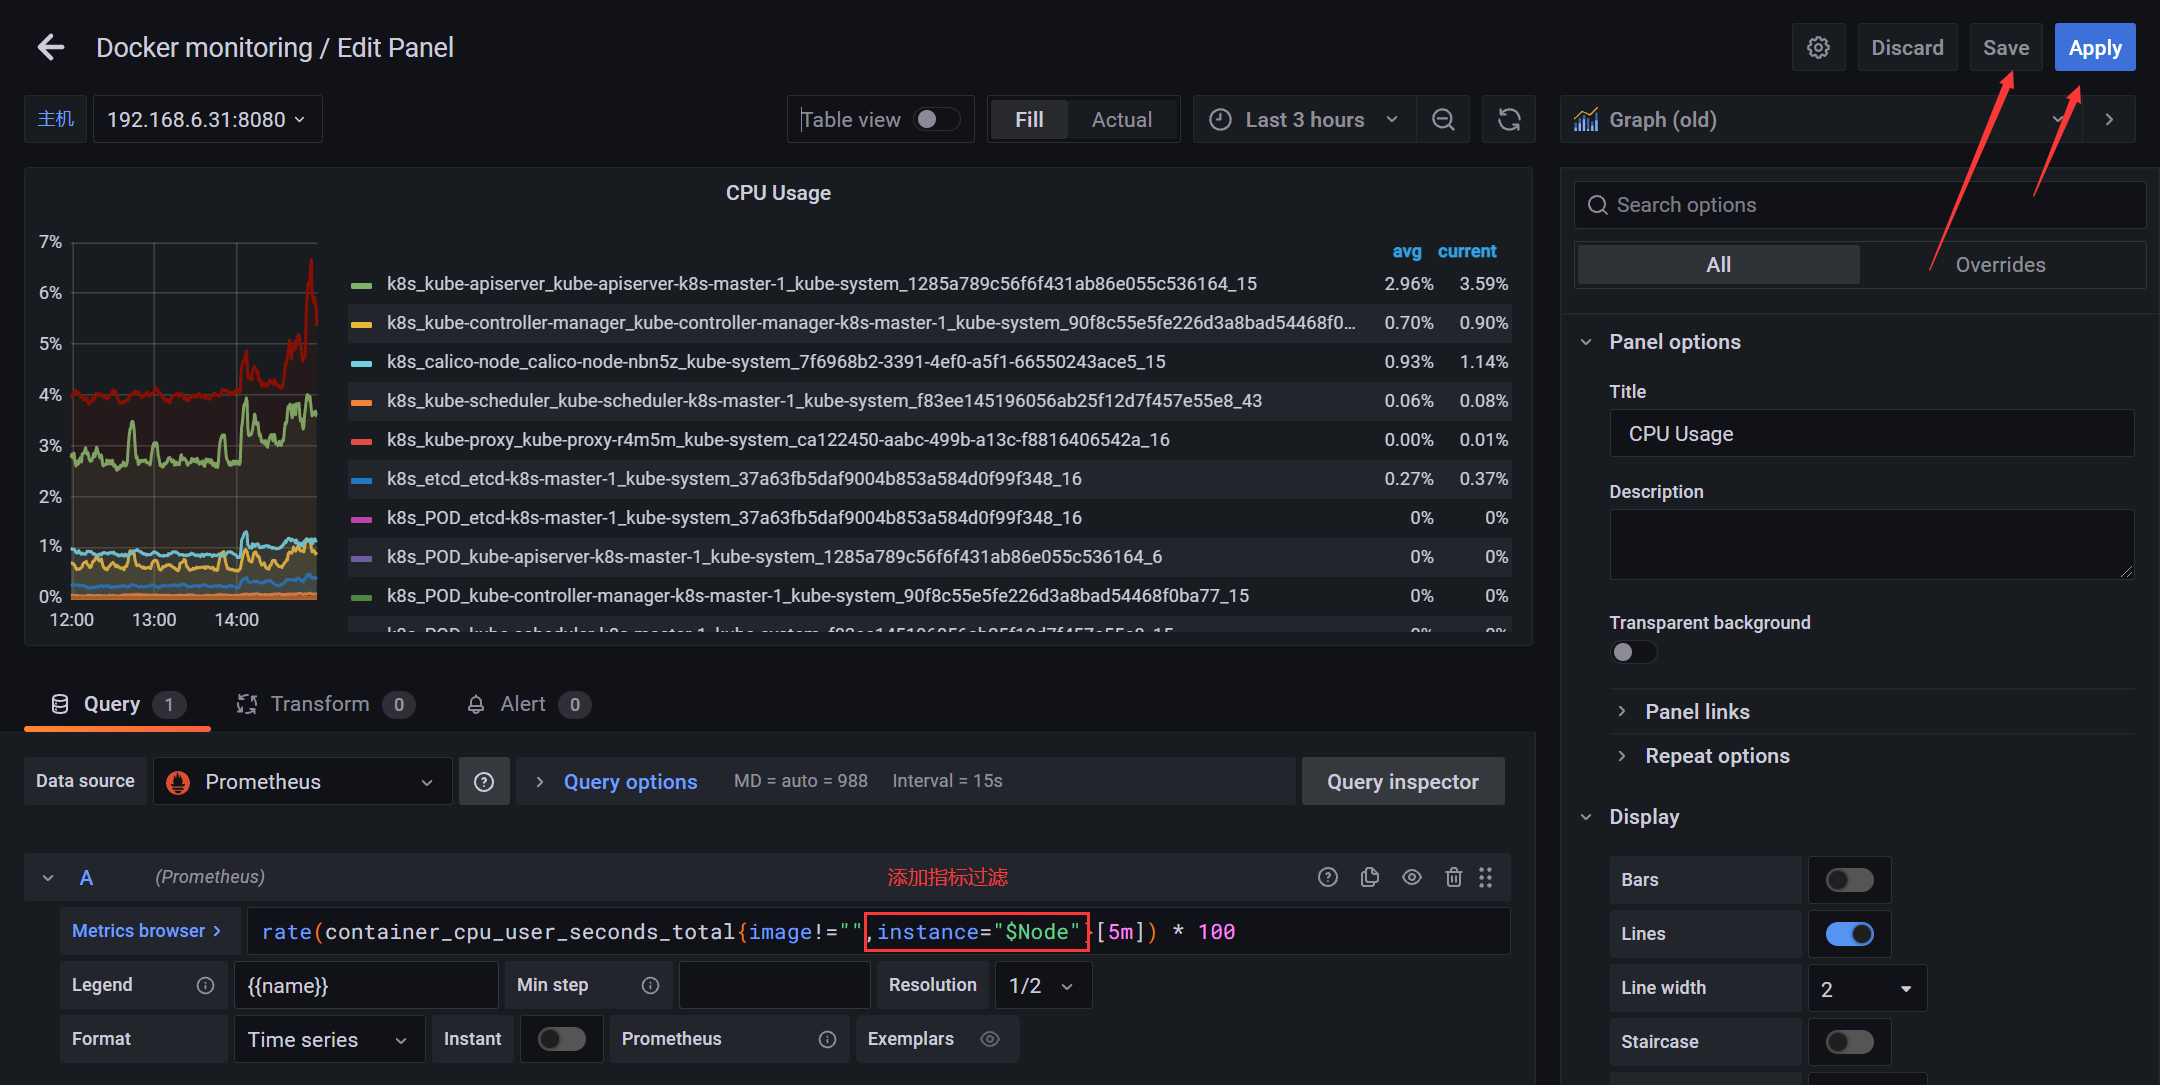
2.5.3 添加多个docker导航栏
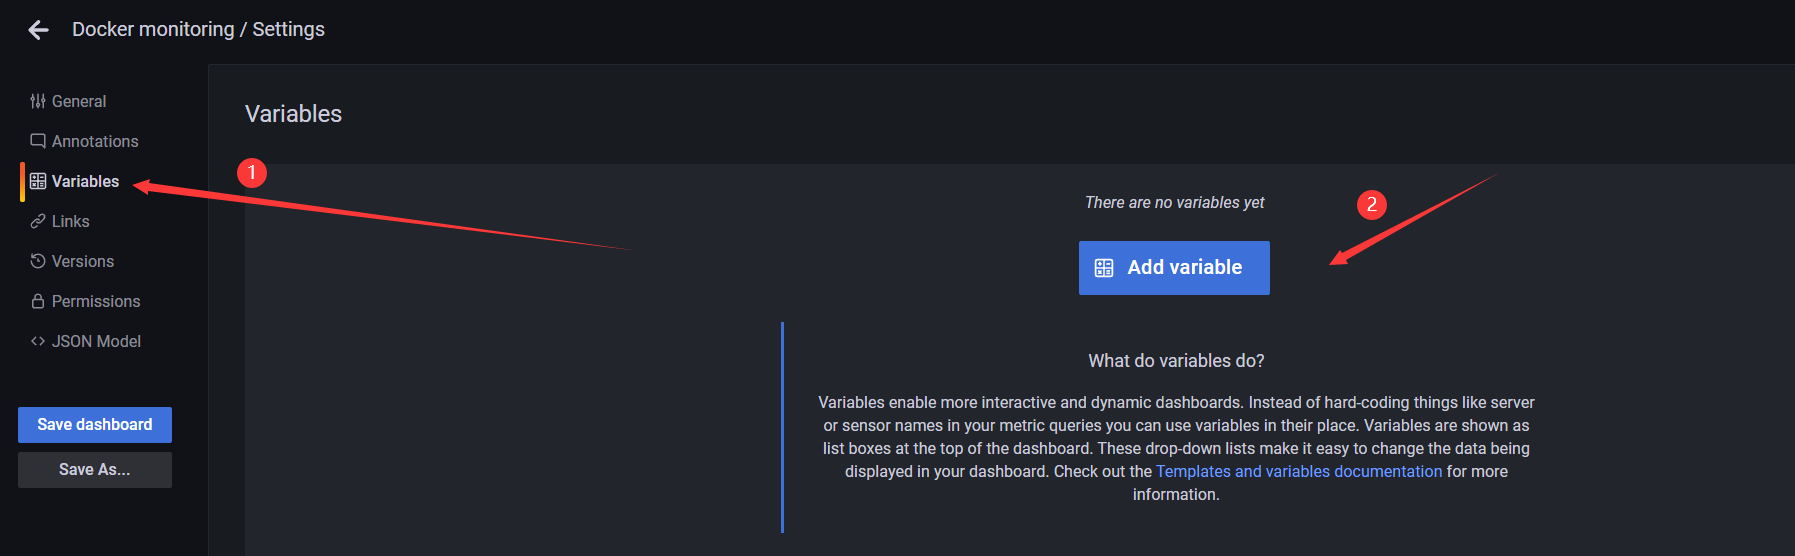
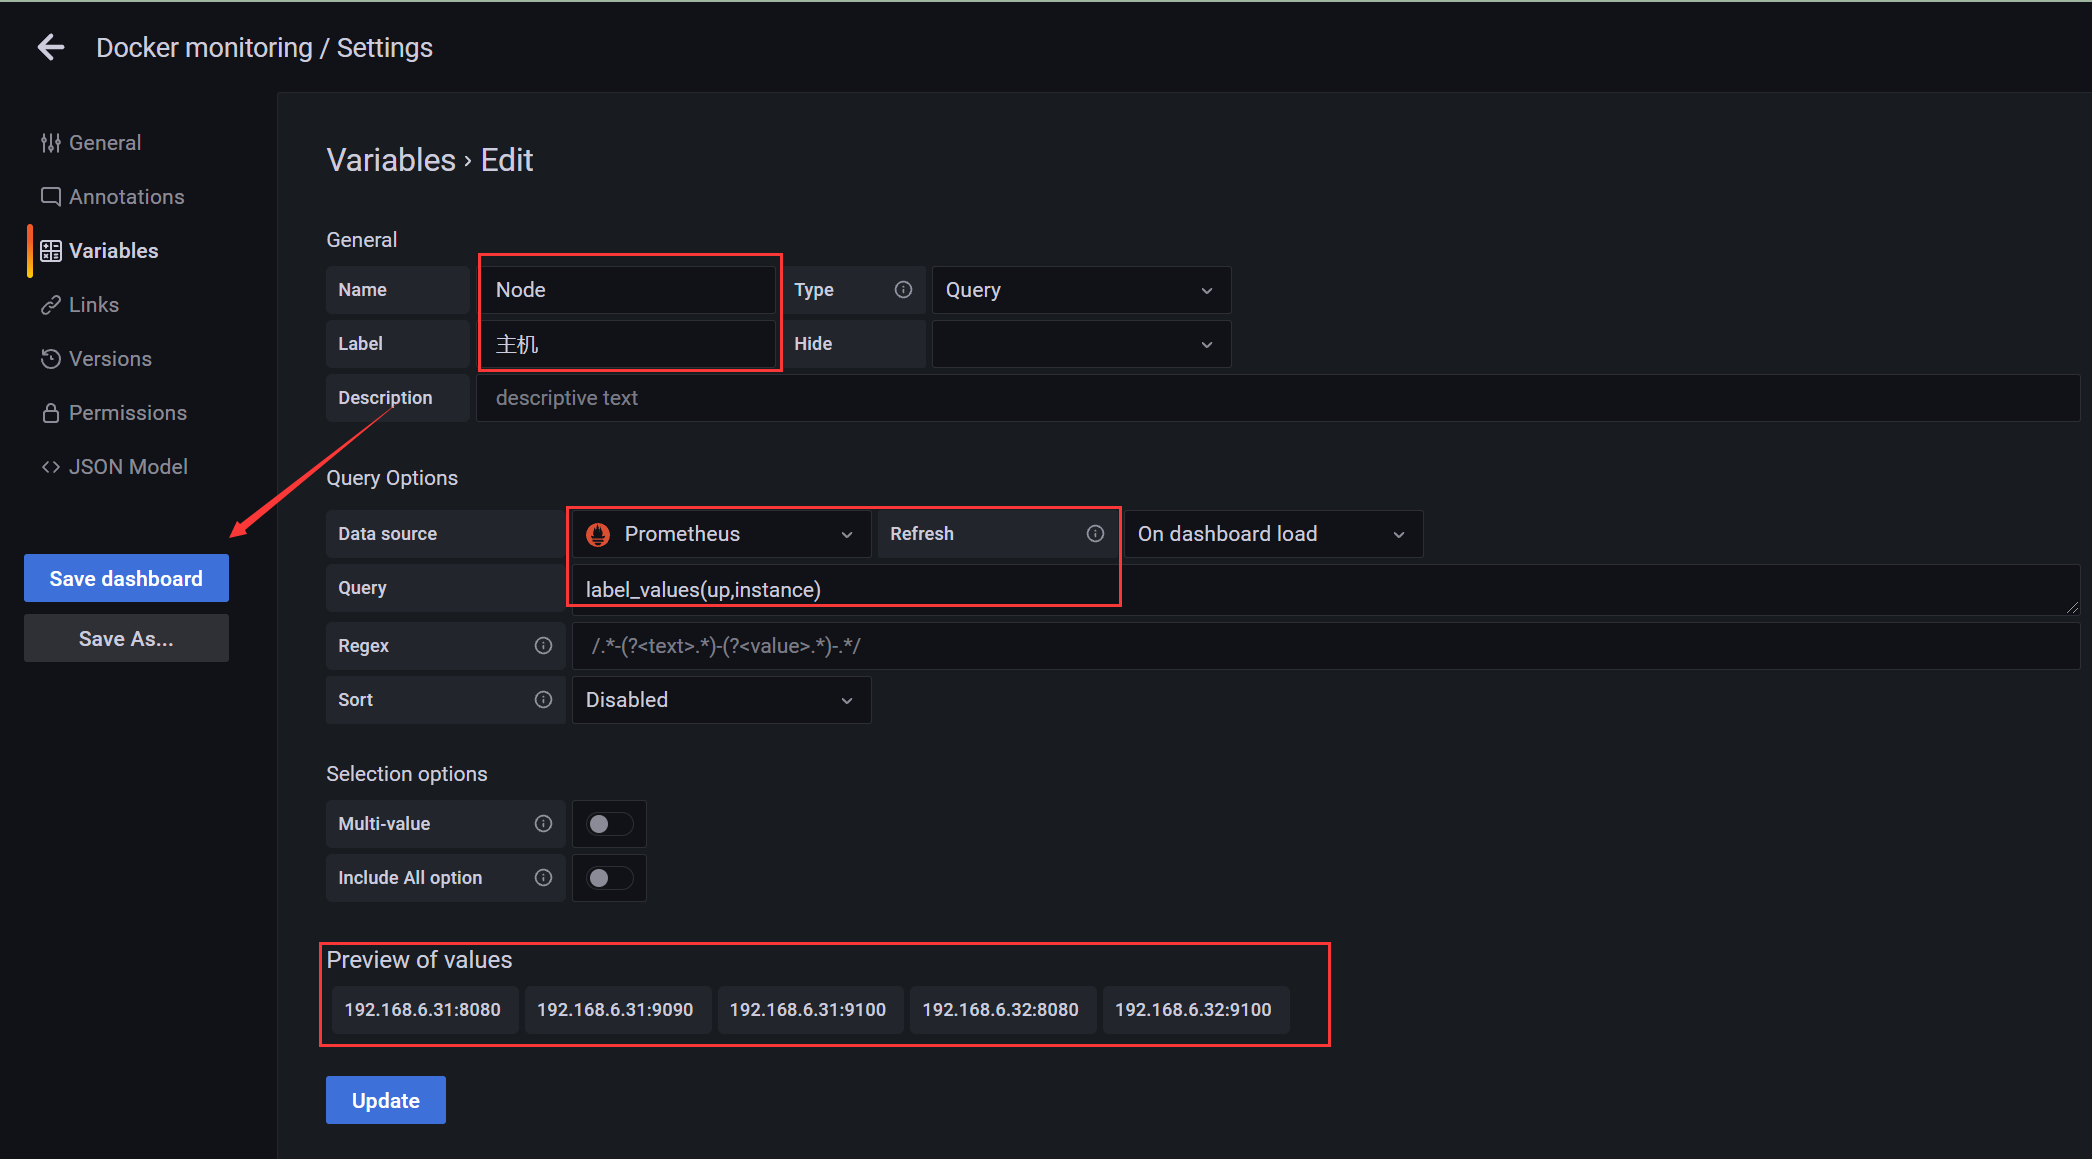
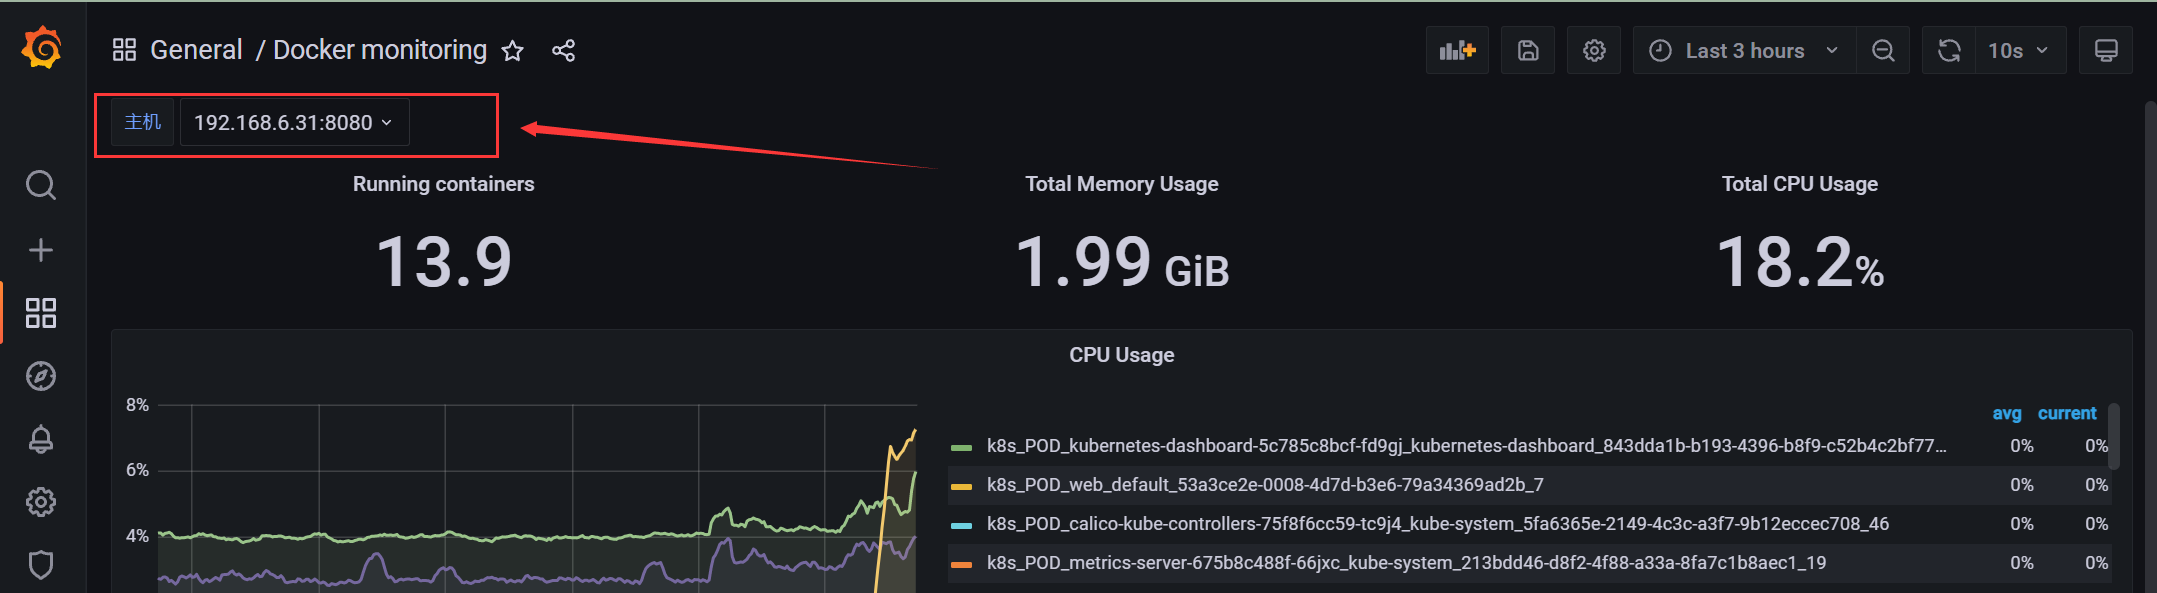
使用正则只匹配对应监控指标

使监控对应的node指标,而不是所有的
添加过滤指标
2.6 监控MySQL服务
项目地址:https://github.com/prometheus/mysqld_exporter
mysql_exporter:用于收集MySQL性能信息。监听端口:9104
wget https://github.com/prometheus/mysqld_exporter/releases/download/v0.14.0/mysqld_exporter-0.14.0.linux-amd64.tar.gz# docker run -d --name db -p 3306:3306 -e MYSQL_ROOT_PASSWORD=123456 mysql:5.7# docker exec -it db bashmysql -uroot -p123456# 设置exporter用户权限权限,查看进程,主从复制等mysql> grant PROCESS, REPLICATION CLIENT, SELECT ON *.* to 'exporter'@'%' identified by '123456';# 配置文件获取mysql服务信息# vi /usr/local/mysqld_exporter/.my.cnf[client]host=127.0.0.1port=3306user=exporterpassword=123456# ./mysqld_exporter --config.my-cnf=.my.cnf
.my.cnf完整配置文件:
[client]host=127.0.0.1port=3306user=exporterpassword=123456
mysql8.0版本创建账号并赋权:
# 创建账号密码create user 'exporter'@'%' identified by '123456';# 授权grant PROCESS, REPLICATION CLIENT, SELECT on *.* to 'exporter'@'%';# 刷新FLUSH PRIVILEGES;
使用systemd服务管理:
# vi /usr/lib/systemd/system/mysqld_exporter.service[Unit]Description=mysqld_exporter[Service]ExecStart=/usr/local/mysqld_exporter/mysqld_exporter --config.my-cnf=/usr/local/mysqld_exporter/.my.cnfExecReload=/bin/kill -HUP $MAINPIDKillMode=processRestart=on-failure[Install]WantedBy=multi-user.target
2.6.1 添加Prometheus配置
- job_name: 'mysql'static_configs:- targets: [''192.168.6.32:9104']
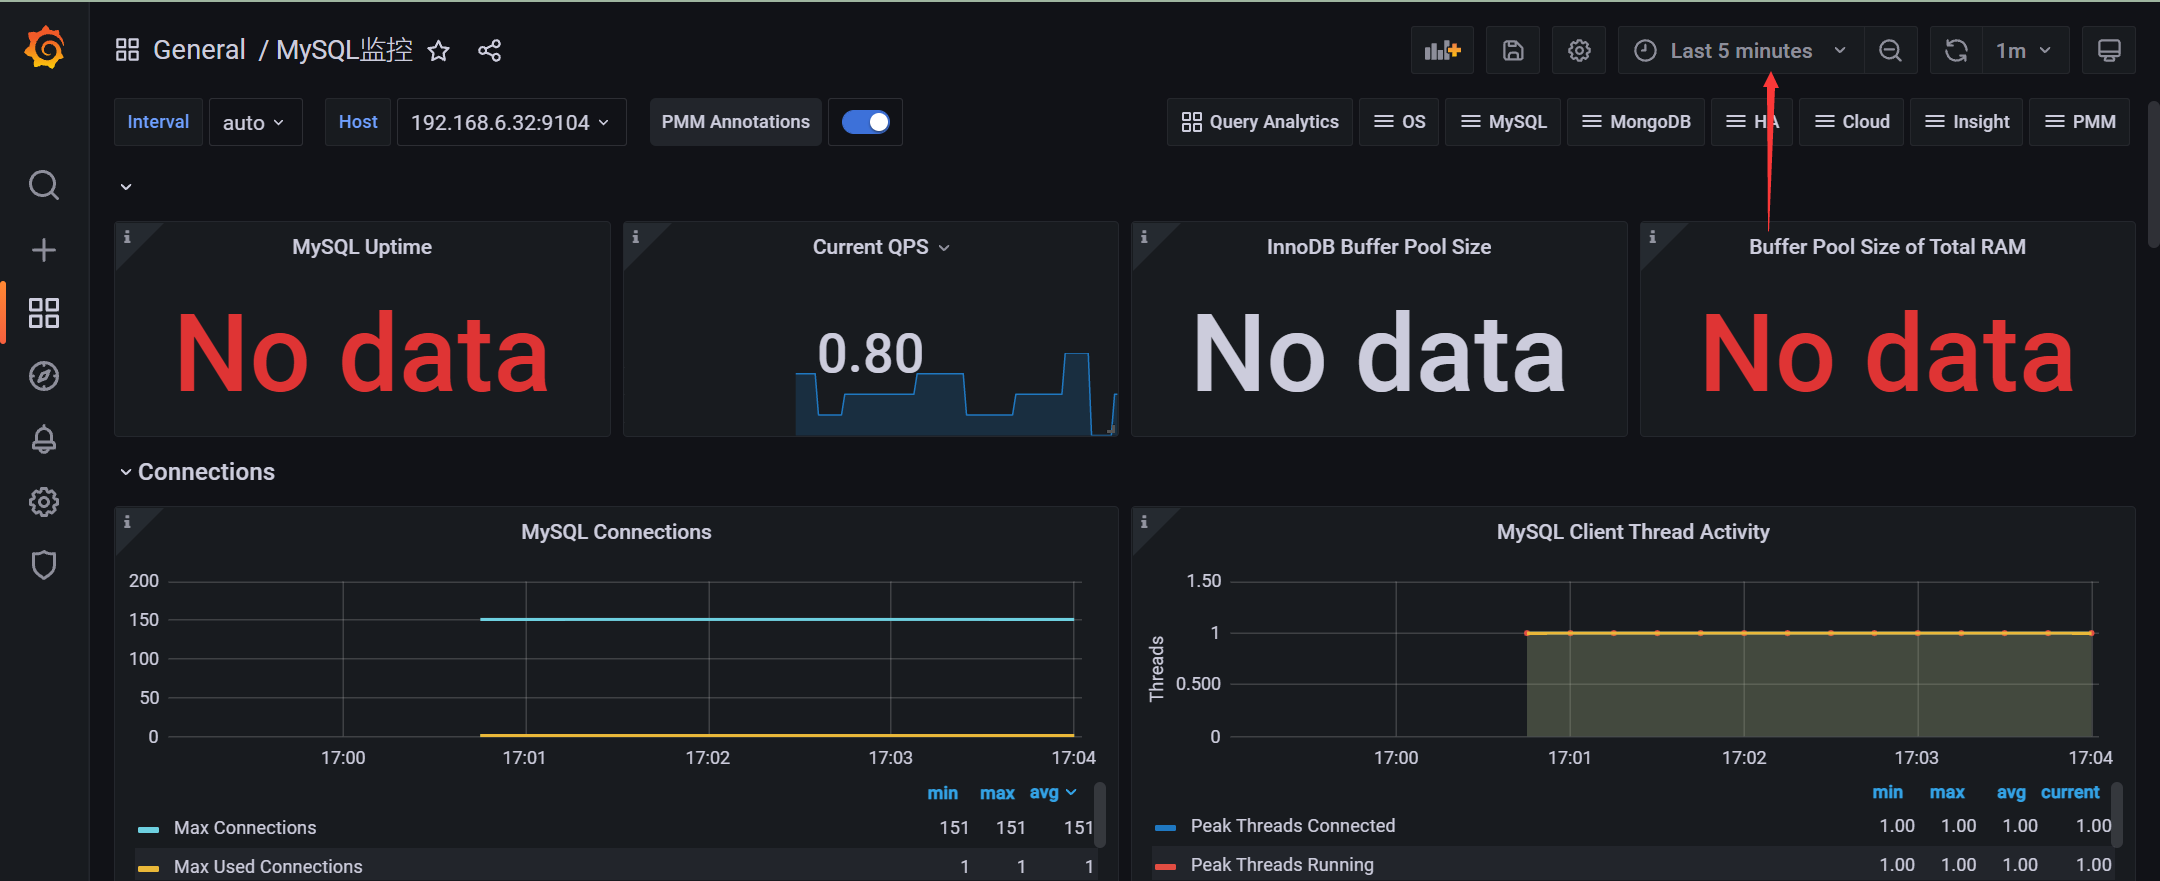
2.6.2 添加grafana仪表盘(仪表盘ID:7362)
- 设置时间,默认时间太长,可能无数据
3、Prometheus自动化监控
3.1 Prometheus服务发现概述
Prometheus添加被监控端支持两种方式:
- 静态配置:手动配置
- 服务发现:动态发现需要监控的Target实例
支持服务发现的来源:
• azure_sd_configs
• consul_sd_configs• dns_sd_configs
• ec2_sd_configs
• openstack_sd_configs
• file_sd_configs• gce_sd_configs
• kubernetes_sd_configs• marathon_sd_configs
• nerve_sd_configs
• serverset_sd_configs
• triton_sd_configs
3.2 基于文件的服务发现
3.2.1 添加Prometheus配置
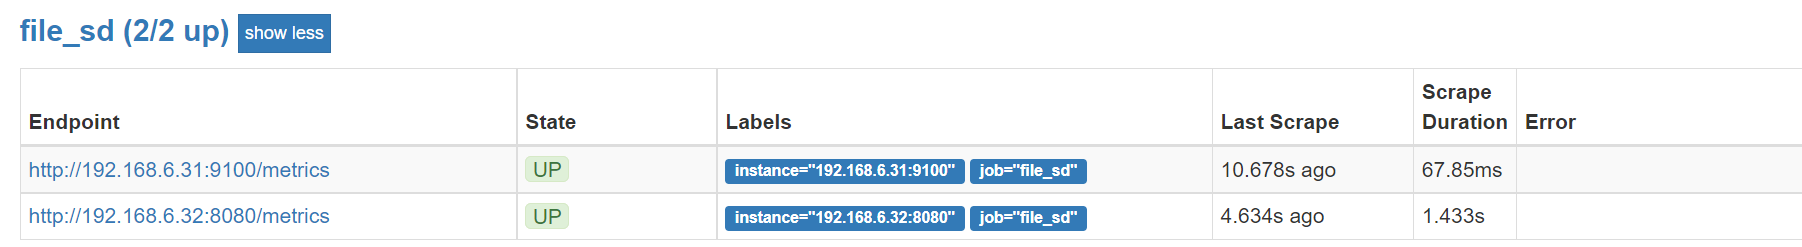
# 启用基于文件的服务发现:- job_name: 'file_sd'file_sd_configs:- files: ['/opt/monitor/prometheus/sd_config/*.yml']refresh_interval: 5s # 每隔5秒检查一次
3.2.2 添加被监控端
添加被监控端:cd /opt/monitor/prometheus/sd_config/vi test.yml- targets: ['192.168.6.31:9100']
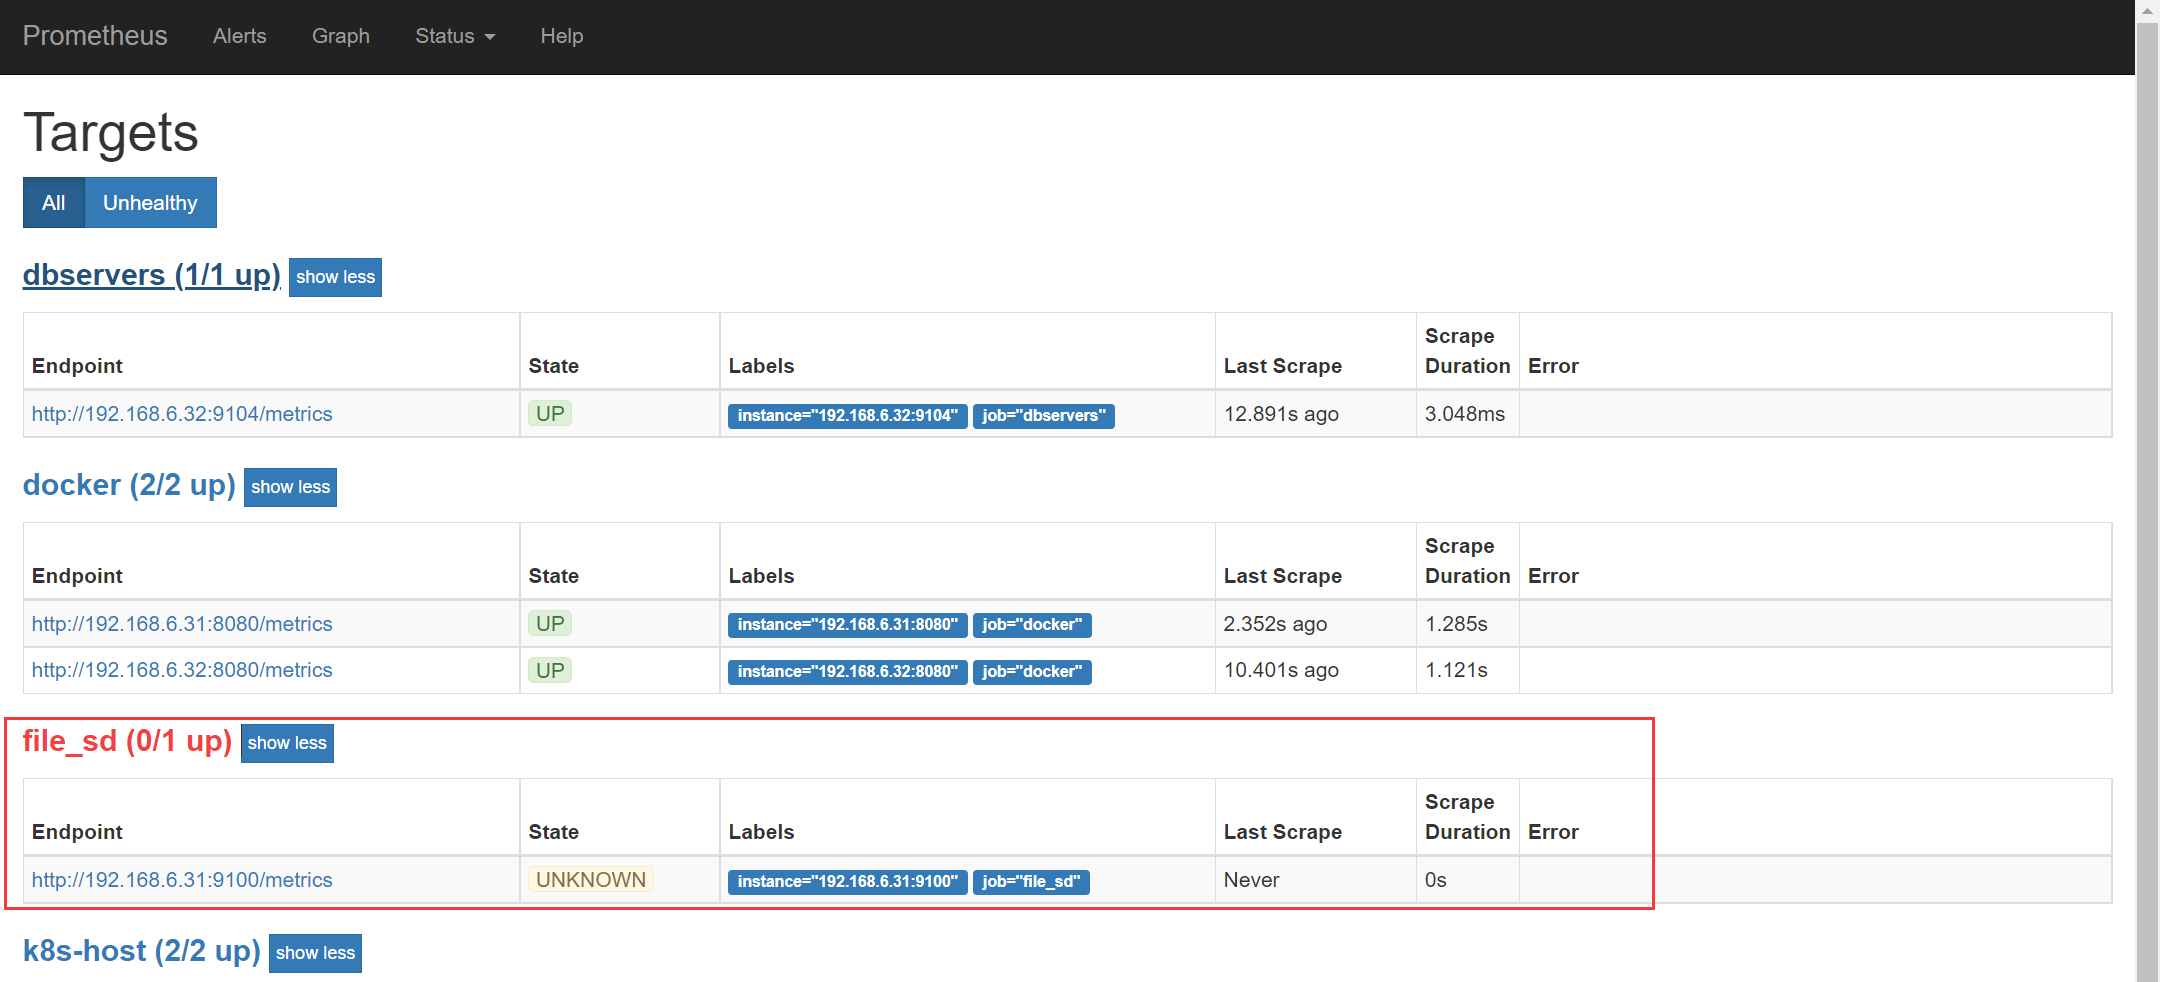
- 由于该服务使用了用户名密码认证,所有获取不到数据可以添加认证信息
- job_name: 'file_sd'basic_auth: # 添加认证username: prometheuspassword: 123456file_sd_configs:- files: ['/opt/monitor/prometheus/sd_config/*.yml']refresh_interval: 5s # 每隔5秒检查一次
3.3 基于consul的服务发现
Consul是一个分布式的服务发现和键/值存储系统。
https://releases.hashicorp.com/consul/
3.3.1 部署consul
Docker部署Consul:docker run --name consul -d -p 8500:8500 consul向Consul注册服务:curl -X PUT -d '{"id": "Linux-1","name": "Linux","address": "192.168.6.31","port": 9100,"tags": ["service"],"checks": [{"http": "http://192.168.6.31:9100","interval": "5s"}]}' http://192.168.6.31:8500/v1/agent/service/register
- id 相当于Prometheus配置文件中的一个实例,也就是一个监控单元
- name 相当于一个job,也就是分组
- tags 也就是注册的一个服务标签
- checks 健康检查
- 最后是一个借口地址
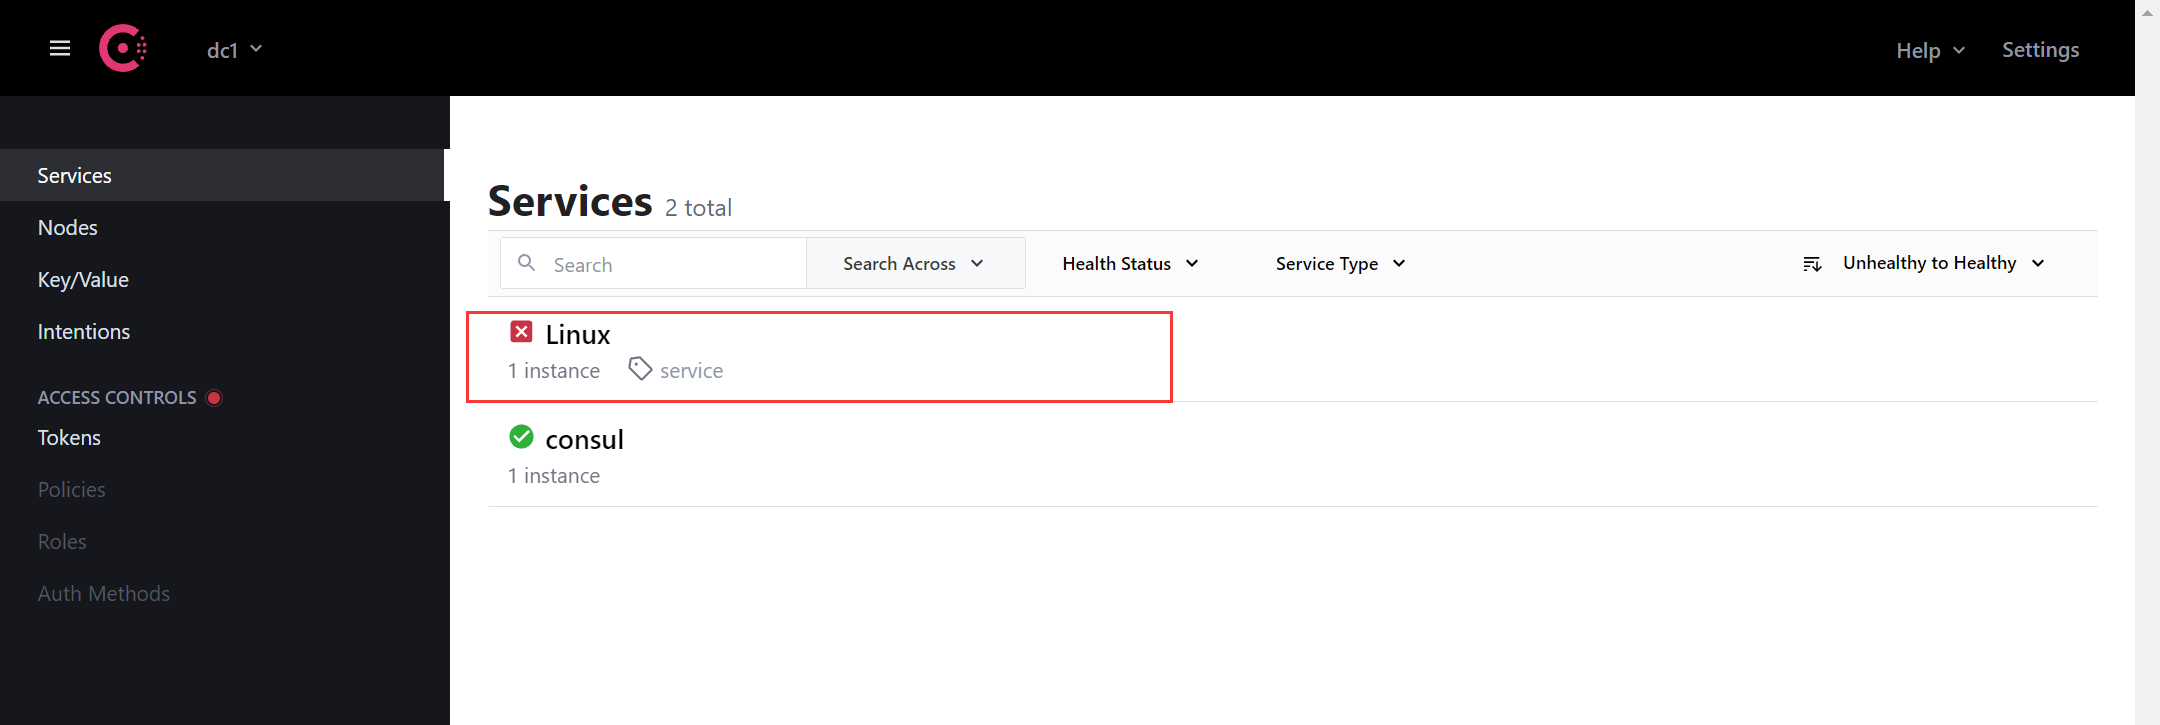
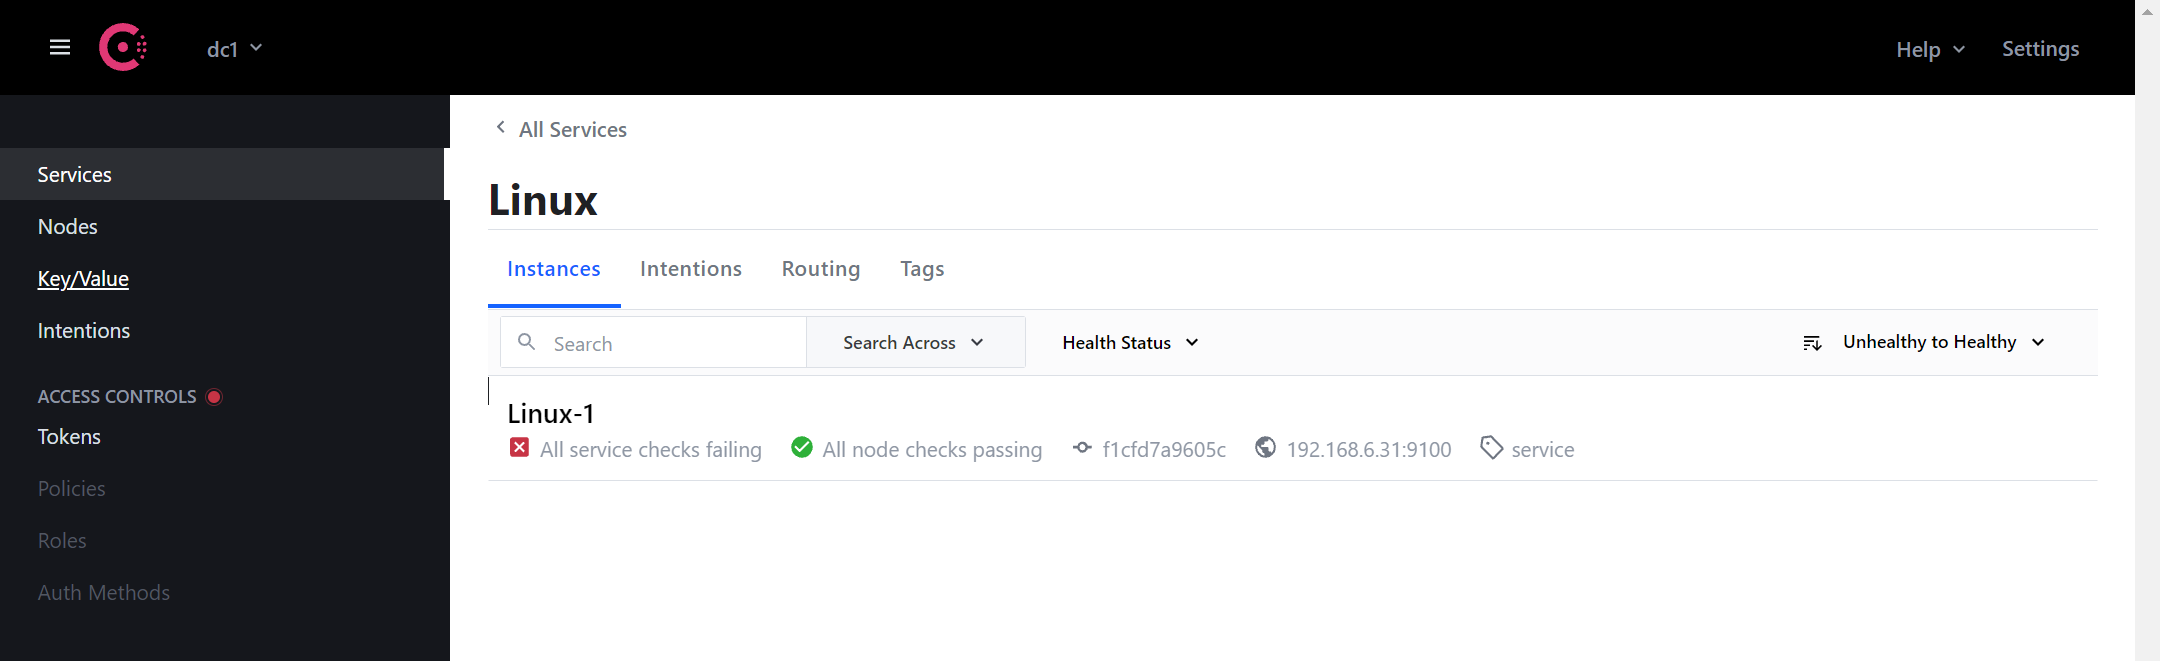
- 由于9100启用了认证所以显示红叉
3.3.2 添加Prometheus配置 - 启用consul服务发现
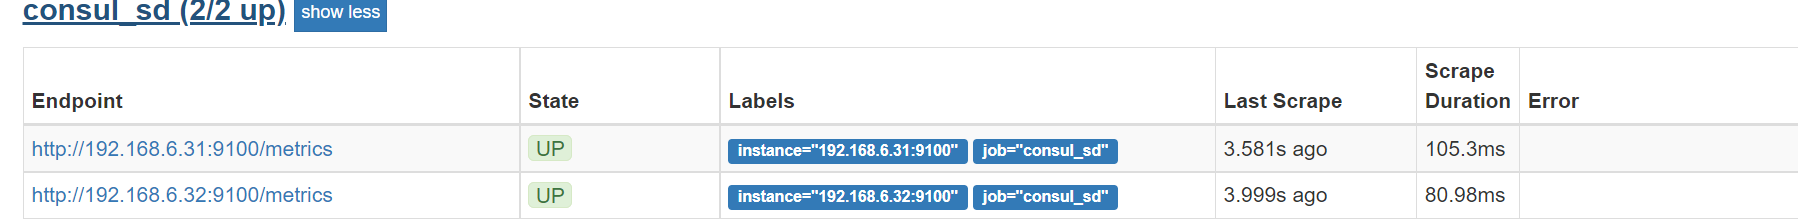
启用基于consul的服务发现:- job_name: 'consul_sd'basic_auth: # 添加认证username: prometheuspassword: 123456consul_sd_configs:- server: 192.168.6.31:8500services: ['Linux']

添加Linux-2
curl -X PUT -d '{"id": "Linux-2","name": "Linux","address": "192.168.6.32","port": 9100,"tags": ["service"],"checks": [{"http": "http://192.168.6.32:9100","interval": "5s"}]}' http://192.168.6.31:8500/v1/agent/service/register
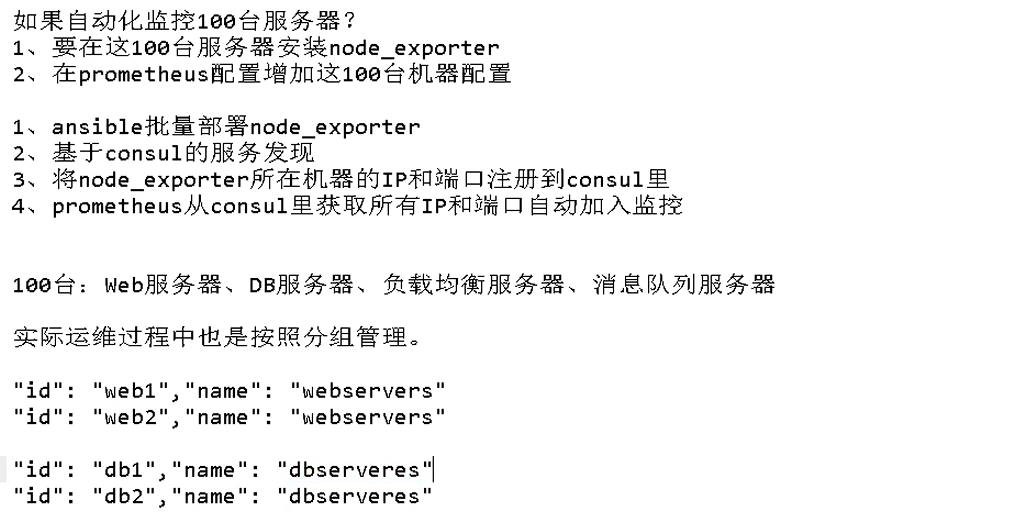
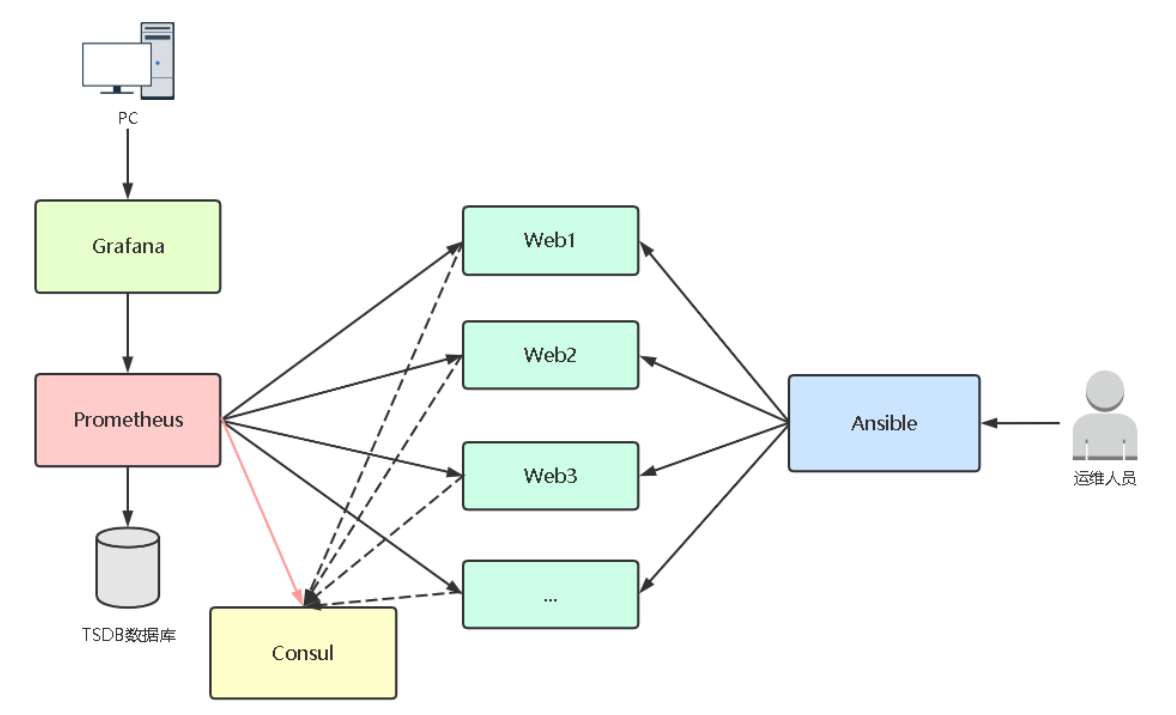
3.4 Ansible+Consul实现100台主机自动监控
注:环境已清理
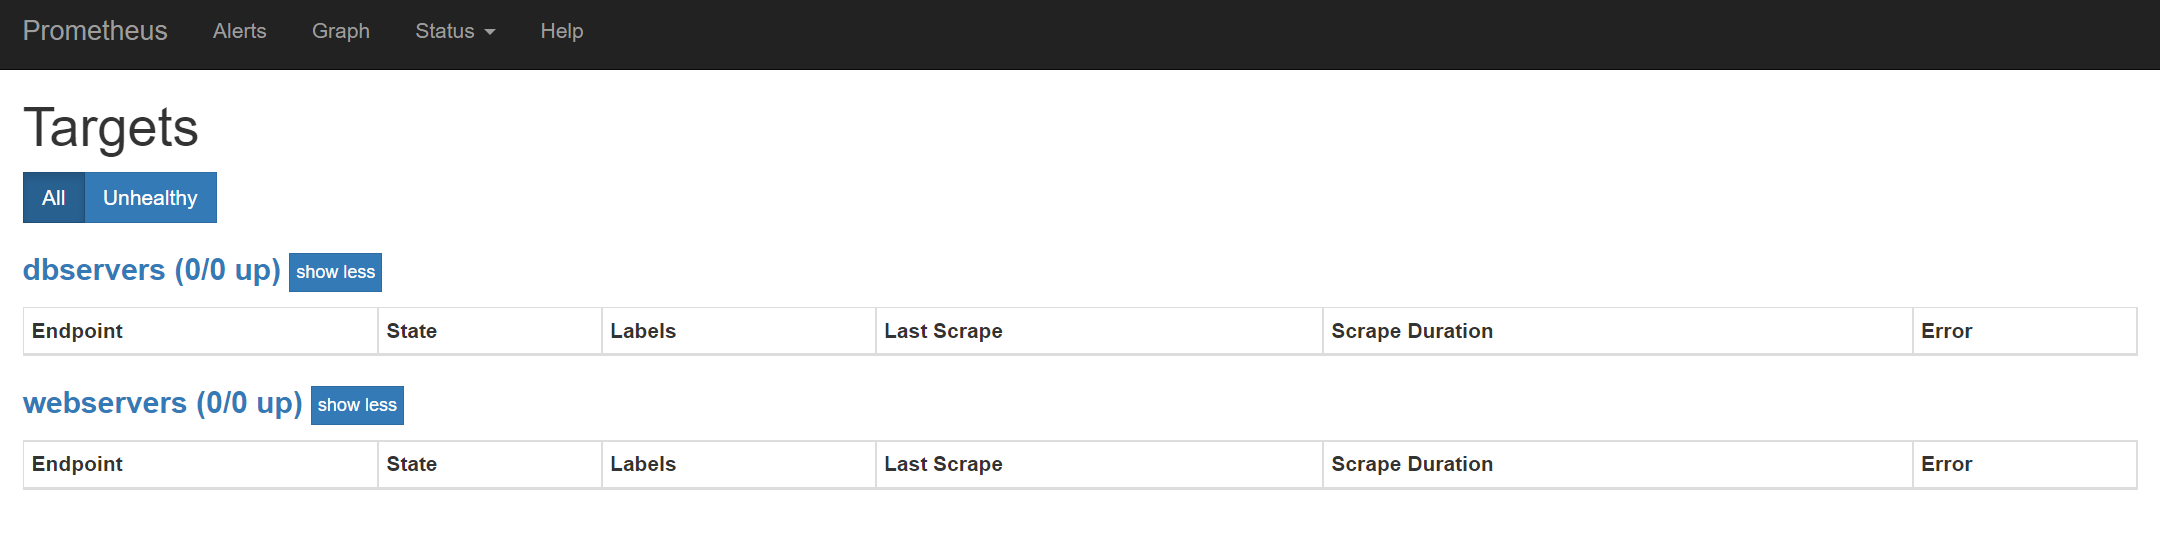
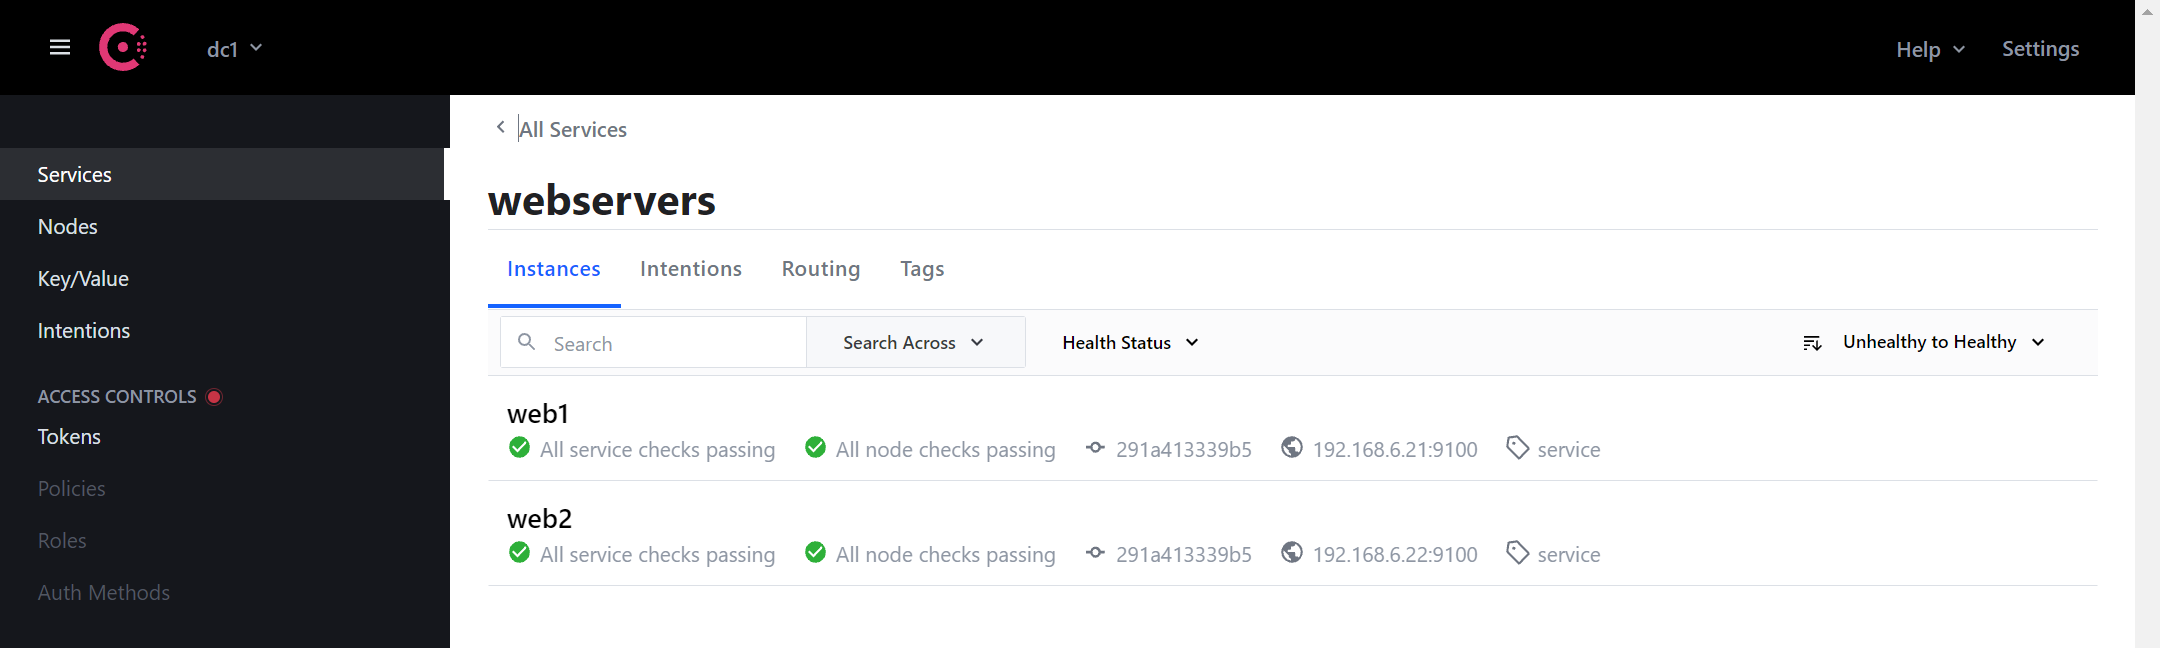
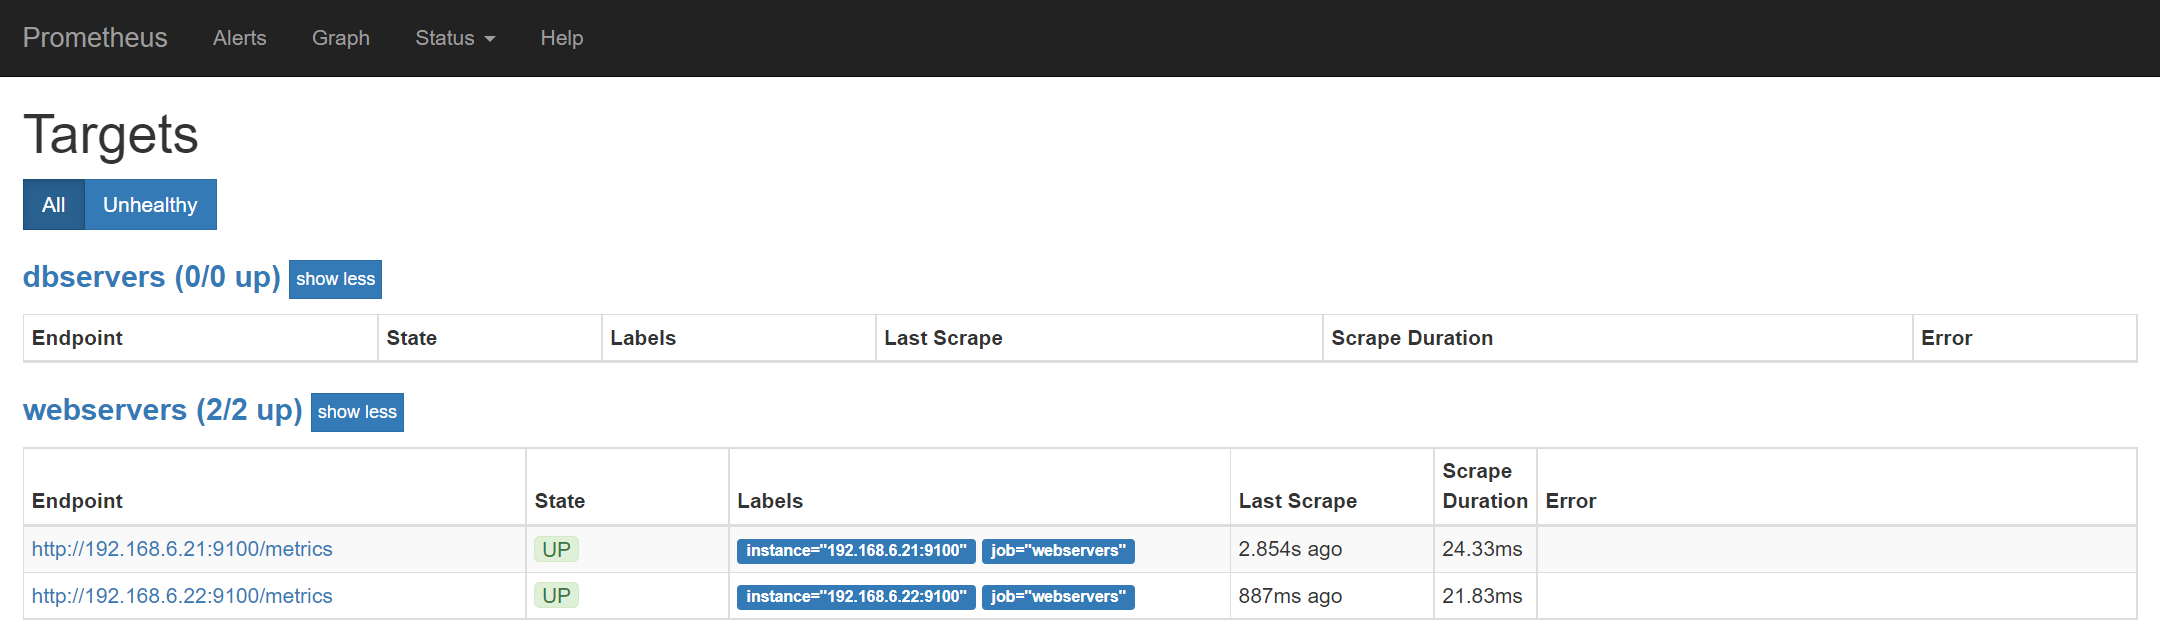
修改Prometheus配置文件
# my global configglobal:scrape_interval: 15s # Set the scrape interval to every 15 seconds. Default is every 1 minute.evaluation_interval: 15s # Evaluate rules every 15 seconds. The default is every 1 minute.# scrape_timeout is set to the global default (10s).# Alertmanager configurationalerting:alertmanagers:- static_configs:- targets:# - alertmanager:9093# Load rules once and periodically evaluate them according to the global 'evaluation_interval'.rule_files:# - "first_rules.yml"# - "second_rules.yml"# A scrape configuration containing exactly one endpoint to scrape:# Here it's Prometheus itself.scrape_configs:# The job name is added as a label `job=<job_name>` to any timeseries scraped from this config.- job_name: 'webservers'consul_sd_configs:- server: 192.168.6.31:8500services: ['webservers']- job_name: 'dbservers'consul_sd_configs:- server: 192.168.6.31:8500services: ['dbservers']
3.4.1 准备环境清单
清理之前环境
systemctl disable node_exporter.servicesystemctl stop node_exporter.servicerm -rf /etc/systemd/system/node_exporter.servicerm -rf /usr/local/node_exporter
systed服务管理node_exporter
vi /opt/monitor/ansible/node_exporter.service[Unit]Description=node_exporter[Service]ExecStart=/usr/local/node_exporter/node_exporterExecReload=/bin/kill -HUP $MAINPIDKillMode=processRestart=on-failure[Install]WantedBy=multi-user.target
vi mysqld_exporter.service[Unit]Description=mysqld_exporter[Service]ExecStart=/usr/local/mysqld_exporter/mysqld_exporter --config.my-cnf="/usr/local/mysqld_exporter/.my.cnf"ExecReload=/bin/kill -HUP $MAINPIDKillMode=processRestart=on-failure[Install]WantedBy=multi-user.target
主机清单
vi /opt/monitor/ansible/hosts[webservers]192.168.6.31 name=web1[dbservers]192.168.6.32 name=db1
- 两个组中有相同的ip会导致出现问题
consul-register.sh
vi /opt/monitor/ansible/consul-register.sh#!/bin/bashservice_name=$1instance_id=$2ip=$3port=$4echo $service_nameecho $instance_idecho $ipecho $portcurl -X PUT -d '{"id": "'"$instance_id"'","name": "'"$service_name"'","address": "'"$ip"'","port": '"$port"',"tags": ["service"],"checks": [{"http": "http://'"$ip"':'"$port"'","interval": "5s"}]}' http://192.168.6.31:8500/v1/agent/service/register
认证文件
vi /opt/monitor/ansible/config.ymlbasic_auth_users:# 用户名: 密码prometheus: $2y$12$8K7NFVCXqygXELVsX4mtqO2dHfoxb3CTkU2qkB/P5jAY7JgoGRLC2
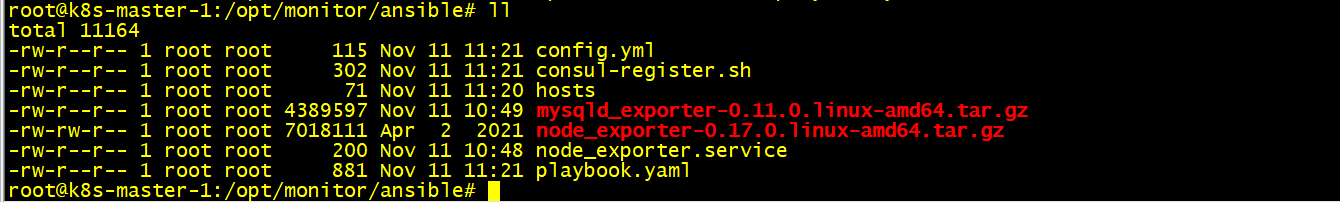
playbook.yaml
vi /opt/monitor/ansible/playbook.yaml- hosts: webservers# remote_user: rootgather_facts: no# 定义变量vars:port: 9100tasks:- name: 推送二进制文件unarchive: src=node_exporter-0.17.0.linux-amd64.tar.gz dest=/usr/local- name: 重命名shell: |cd /usr/local/if [ ! -d node_exporter ];thenmv node_exporter-0.17.0.linux-amd64 node_exporterfi# - name: 推送认证配置文件# copy: src=config.yml dest=/usr/local/node_exporter- name: 推送systemd服务管理配置copy: src=node_exporter.service dest=/etc/systemd/system/- name: 启动服务systemd: name=node_exporter state=started enabled=yes daemon_reload=yes- name: 推送注册脚本copy: src=consul-register.sh dest=/usr/local/bin/- name: 注册当前节点# 服务名 实例名 ip portshell: /bin/bash /usr/local/bin/consul-register.sh {{ group_names[0] }} {{ name }} {{ inventory_hostname }} {{ port }}
- mysqld_exporter-0.11.0.linux-amd64.tar.gz 暂未使用
- {{ group_names[0] }} 返回的是- hosts: webservers值
- {{ name }} 返回的是hosts清单中的name
- {{ inventory_hostname }} 当前的ip
- {{ port }} 使用的是变量port
3.4.2 检查playbook清单,并执行
ansible-playbook -v --syntax-check playbook.yaml -i hosts
执行
ansible-playbook -i hosts playbook.yaml -uroot -k

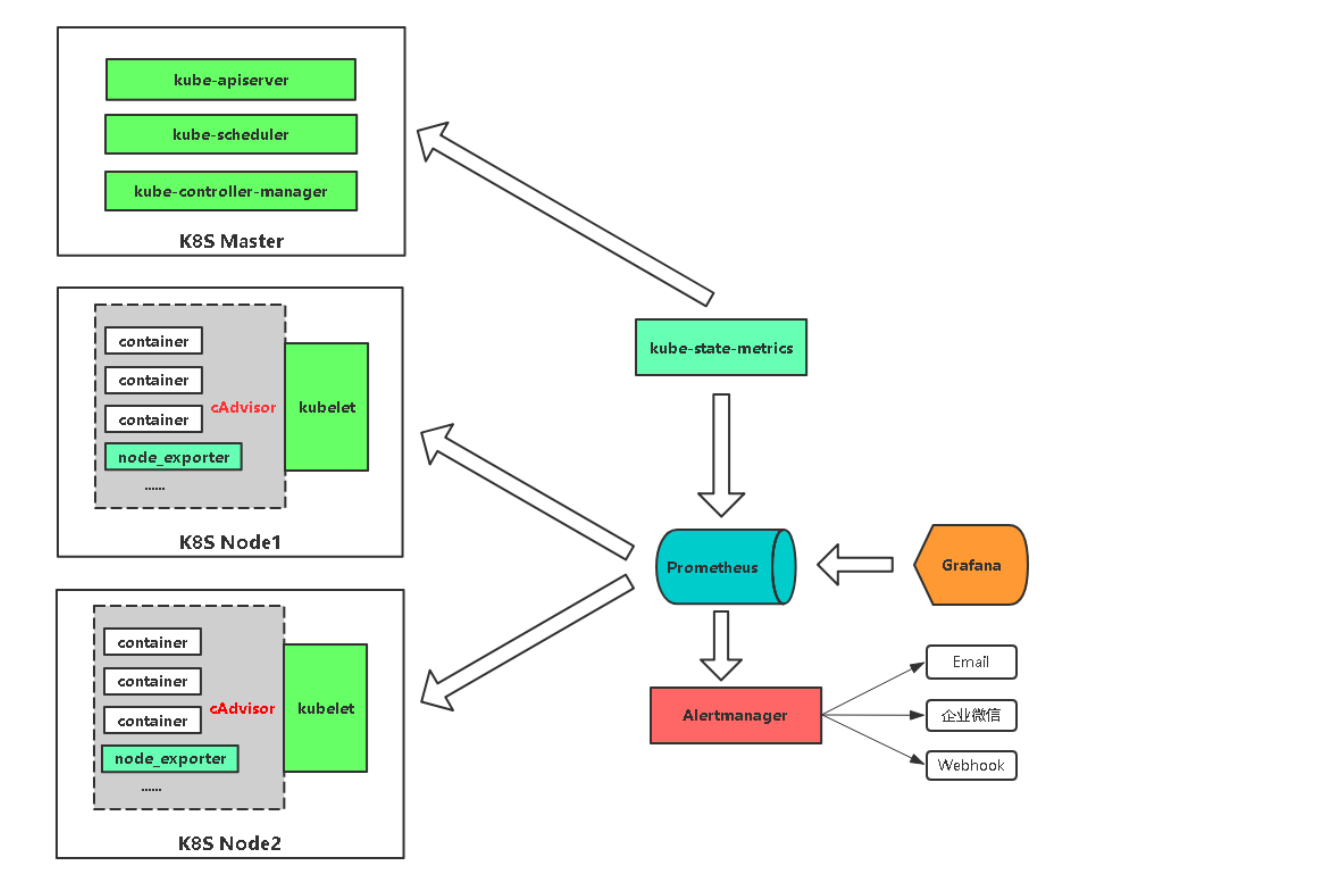
3.5 监控kubernetes
- ubuntu测试没有添加正确的token.k8s导致找不到监控指标
参考文档:https://prometheus.io/docs/prometheus/latest/configuration/configuration/#kubernetes_sd_config
3.5.1 监控k8s概述
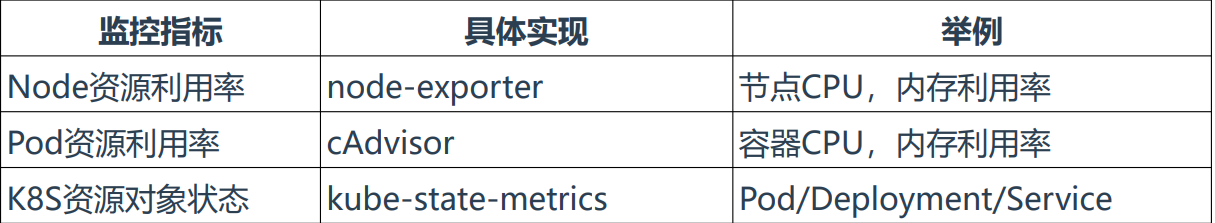
监控指标
Kubernetes本身监控
• Node资源利用率
• Node数量
• Pods数量(Node)
• 资源对象状态
Pod监控
• Pod数量(项目)
• 容器资源利用率
• 应用程序
参考文档:https://prometheus.io/docs/prometheus/latest/configuration/configuration/#kubernetes_sd_config
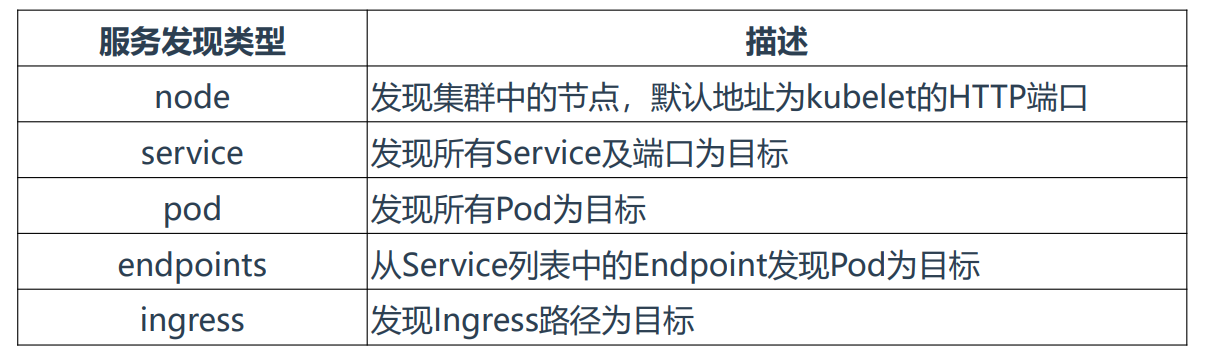
3.5.2 配置k8s服务发现 - 监控pod
1)授权
kubectl apply -f rbac.yaml
2)获取Token并保存到文件
kubectl get sa prometheus -n kube-system -o yamlkubectl describe secret <prometheus-token-xxx | secret名称> -n kube-system# 例如kubectl describe secret prometheus-token-ghtr9 -n kube-system | grep token: | awk '{print $2}' > /opt/prometheus/token.k8s
- 将结果保存到指定文件中,token.k8s(Prometheus需要该token获取信息)
3、创建Job和kubeconfig_sd_configs - 添加Prometheus配置
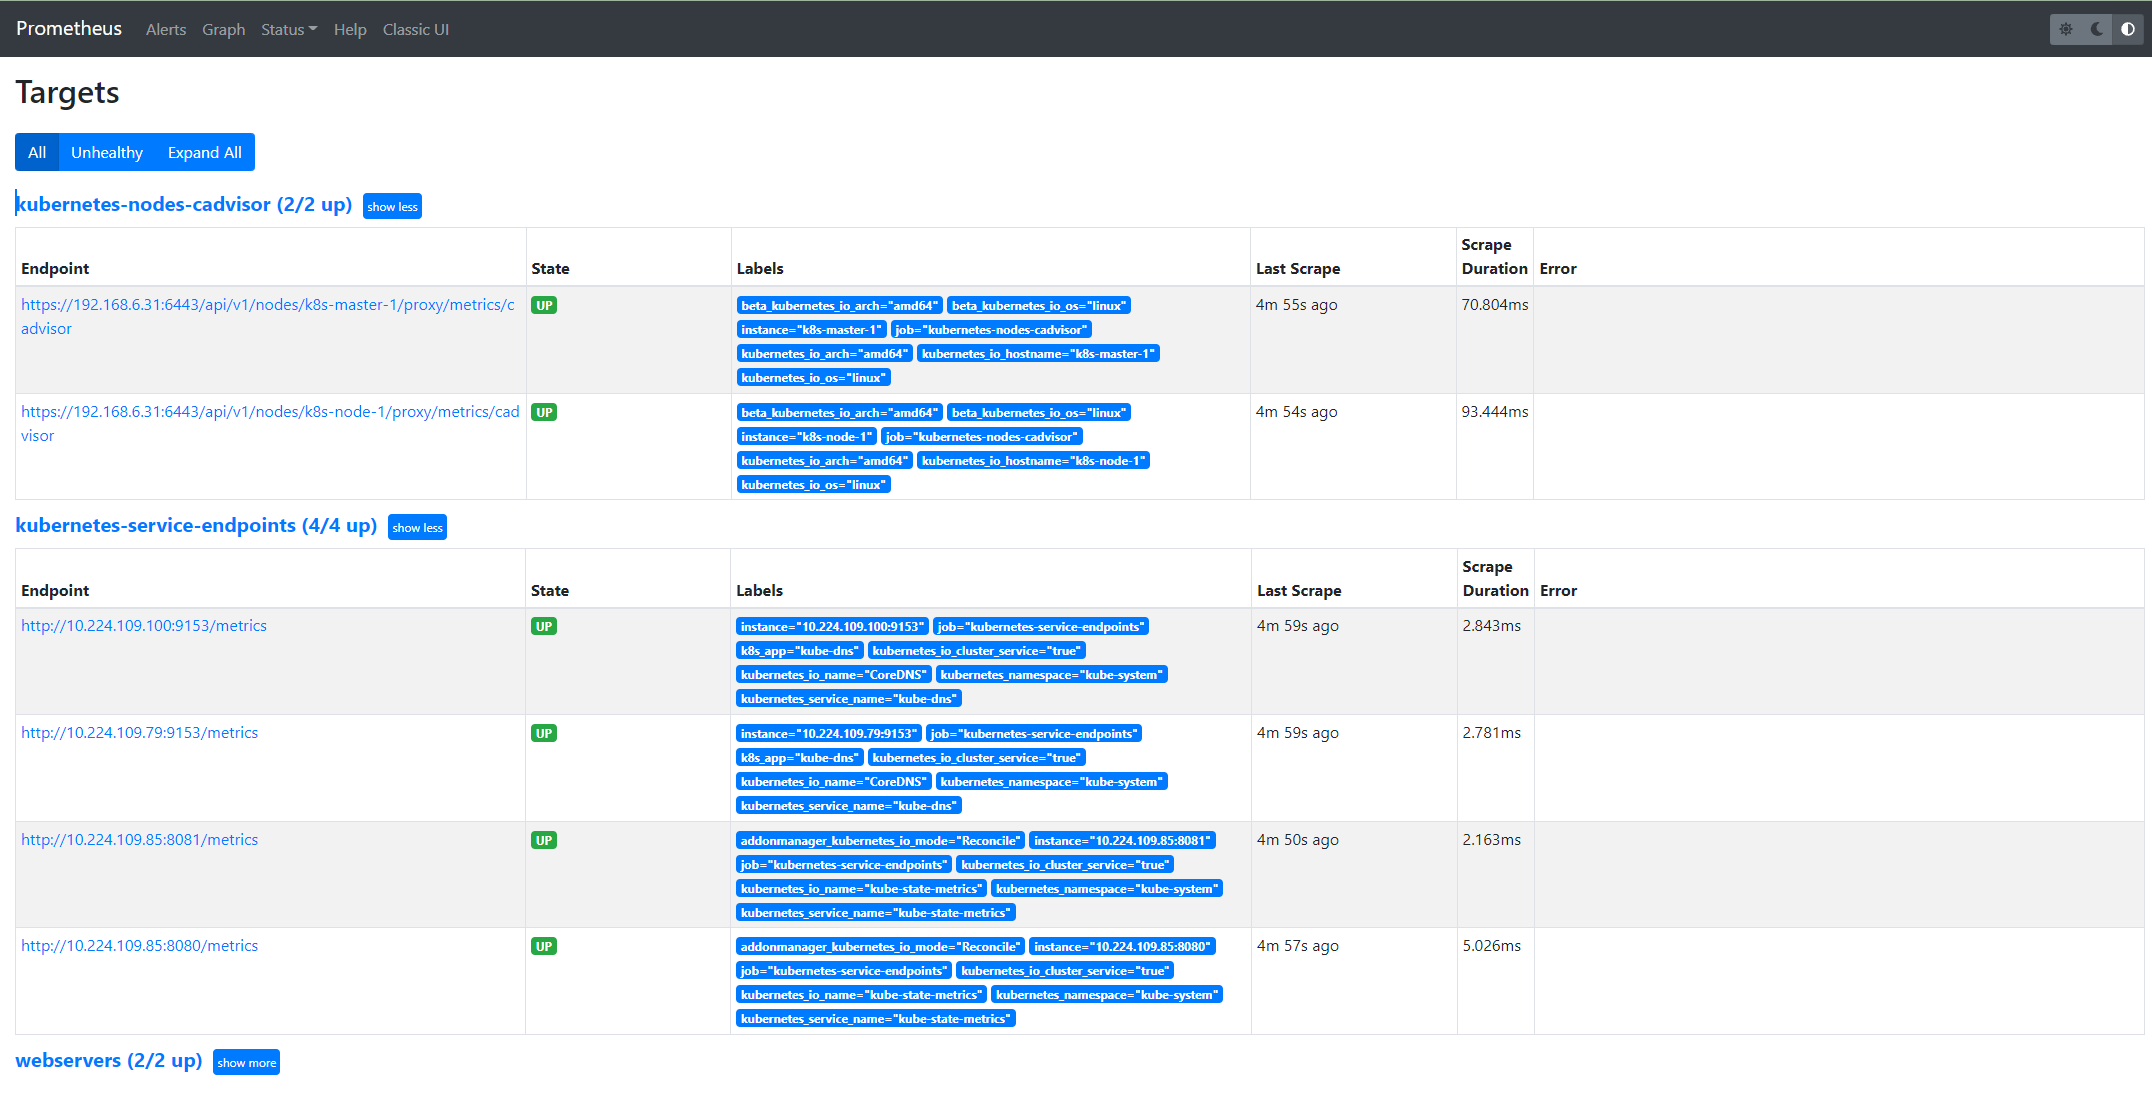
# k8s监控 配置》》》》》》》》》》》》》》》》》》》》》》》》》》》- job_name: kubernetes-nodes-cadvisormetrics_path: /metricsscheme: httpskubernetes_sd_configs:- role: nodeapi_server: https://192.168.6.20:6443bearer_token_file: /opt/prometheus/token.k8stls_config:insecure_skip_verify: truebearer_token_file: /opt/prometheus/token.k8stls_config:insecure_skip_verify: truerelabel_configs:# 将标签(.*)作为新标签名,原有值不变- action: labelmapregex: __meta_kubernetes_node_label_(.*)# 修改NodeIP:10250为APIServerIP:6443- action: replaceregex: (.*)source_labels: ["__address__"]target_label: __address__replacement: 192.168.6.20:6443# 实际访问指标接口 https://NodeIP:10250/metrics/cadvisor 这个接口只能APISERVER访问,故此重新标记标签使用APISERVER代理访问- action: replacesource_labels: [__meta_kubernetes_node_name]target_label: __metrics_path__regex: (.*)replacement: /api/v1/nodes/${1}/proxy/metrics/cadvisor- job_name: kubernetes-service-endpointskubernetes_sd_configs:- role: endpointsapi_server: https://192.168.6.20:6443bearer_token_file: /opt/prometheus/token.k8stls_config:insecure_skip_verify: truebearer_token_file: /opt/prometheus/token.k8stls_config:insecure_skip_verify: true# Service没配置注解prometheus.io/scrape的不采集relabel_configs:- action: keepregex: truesource_labels:- __meta_kubernetes_service_annotation_prometheus_io_scrape# 重命名采集目标协议- action: replaceregex: (https?)source_labels:- __meta_kubernetes_service_annotation_prometheus_io_schemetarget_label: __scheme__# 重命名采集目标指标URL路径- action: replaceregex: (.+)source_labels:- __meta_kubernetes_service_annotation_prometheus_io_pathtarget_label: __metrics_path__# 重命名采集目标地址- action: replaceregex: ([^:]+)(?::\d+)?;(\d+)replacement: $1:$2source_labels:- __address__- __meta_kubernetes_service_annotation_prometheus_io_porttarget_label: __address__# 将K8s标签(.*)作为新标签名,原有值不变- action: labelmapregex: __meta_kubernetes_service_label_(.+)# 生成命名空间标签- action: replacesource_labels:- __meta_kubernetes_namespacetarget_label: kubernetes_namespace# 生成Service名称标签- action: replacesource_labels:- __meta_kubernetes_service_nametarget_label: kubernetes_service_name- job_name: kubernetes-podskubernetes_sd_configs:- role: podapi_server: https://192.168.6.20:6443bearer_token_file: /opt/prometheus/token.k8stls_config:insecure_skip_verify: truebearer_token_file: /opt/prometheus/token.k8stls_config:insecure_skip_verify: true# 重命名采集目标协议relabel_configs:- action: keepregex: truesource_labels:- __meta_kubernetes_pod_annotation_prometheus_io_scrape# 重命名采集目标指标URL路径- action: replaceregex: (.+)source_labels:- __meta_kubernetes_pod_annotation_prometheus_io_pathtarget_label: __metrics_path__# 重命名采集目标地址- action: replaceregex: ([^:]+)(?::\d+)?;(\d+)replacement: $1:$2source_labels:- __address__- __meta_kubernetes_pod_annotation_prometheus_io_porttarget_label: __address__# 将K8s标签(.*)作为新标签名,原有值不变- action: labelmapregex: __meta_kubernetes_pod_label_(.+)# 生成命名空间标签- action: replacesource_labels:- __meta_kubernetes_namespacetarget_label: kubernetes_namespace# 生成Service名称标签- action: replacesource_labels:- __meta_kubernetes_pod_nametarget_label: kubernetes_pod_name# k8s监控 结束》》》》》》》》》》》》》》》》》》》》》》》》》》》
4、Grafana导入仪表盘
3.5.3 配置k8s服务发现 - 监控资源对象
1、部署kube-state-metrics
kubectl create -f kube-state-metrics.yamlkubectl get -f kube-state-metrics.yaml | grep service | grep -i clusterIP | awk '{print $3}'metrics_ip=$(kubectl get -f kube-state-metrics.yaml | grep service | grep -i clusterIP | awk '{print $3}')echo $metrics_ipcurl $metrics_ip:8080/metrics
检查是否可以被监听到
2、添加prometheus配置
改文件和上面的配置一样
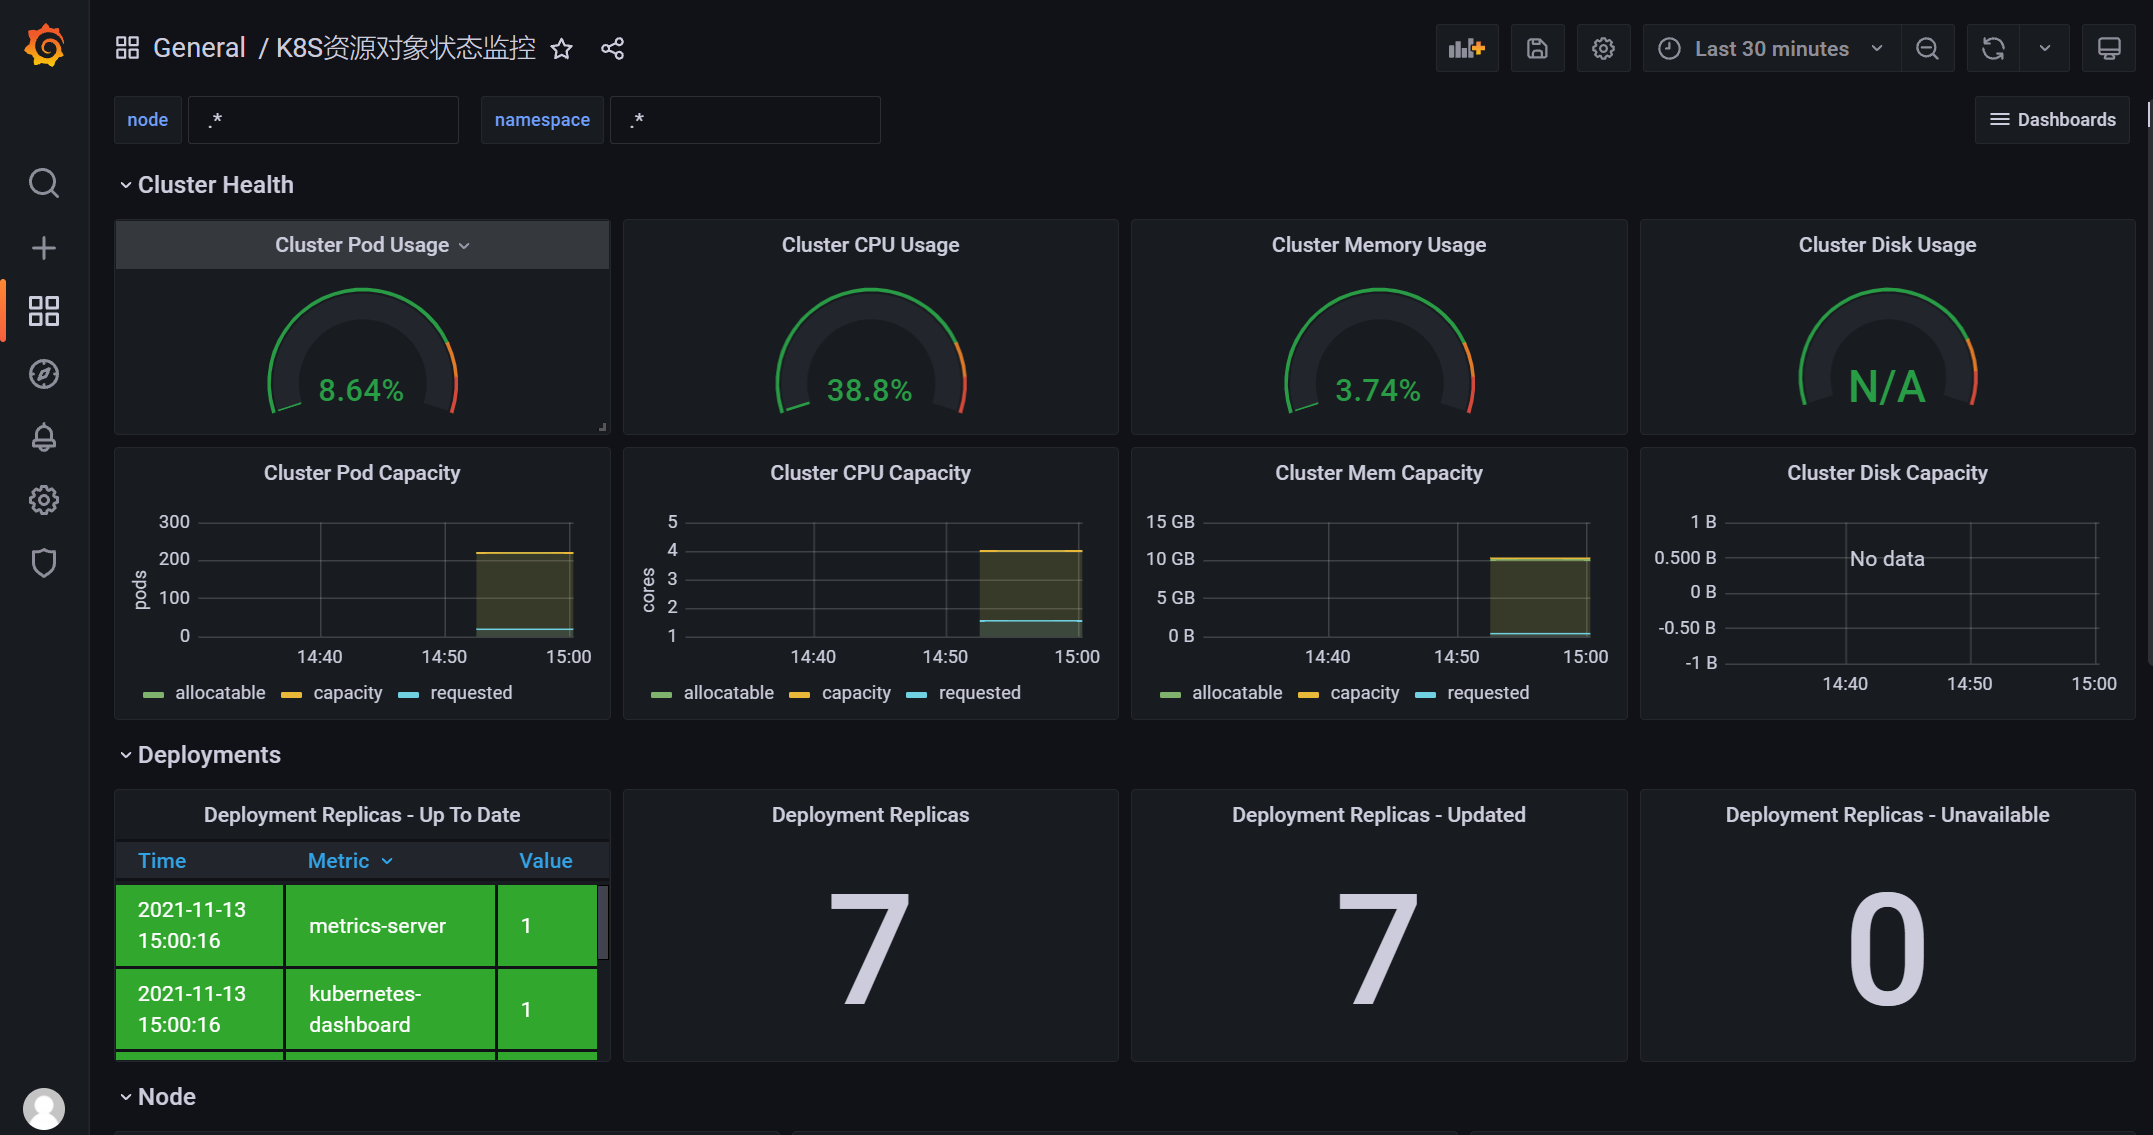
3、Grafana导入仪表盘 K8S资源对象状态监控-2020.json
3.5.4 集群外部署问题解决
- 以上Prometheus都是在k8s集群的节点中部署的,所以不存在访问pod内部ip问题
- 集群之外部署会存在PodIP无法获取问题
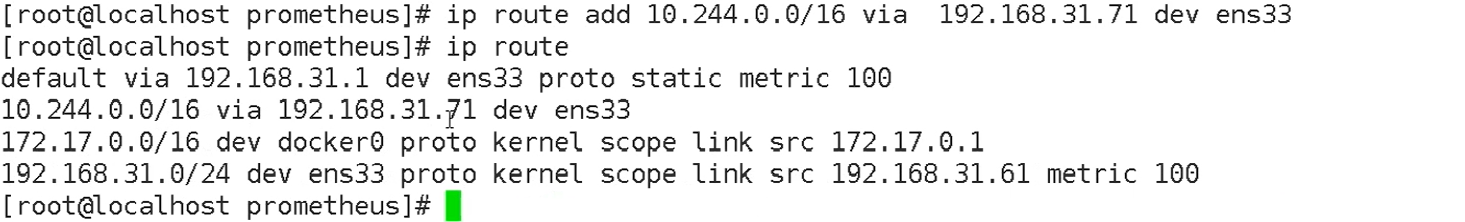
1、开启路由转发
- 这里是同网段,可以直接添加路由表
- 如果是跨网段,需要在上层添加路由表
# Prometheus节点添加路由表ip route add 10.244.0.0/16 via 192.168.31.71 dev ens33# 查看添加的路由表ip route
- 192.168.31.71 是k8s集群master地址

若有收获,就点个赞吧
0 人点赞
