1、环境准备
- 挂载磁盘
https://www.yuque.com/docs/share/93cace4b-e7bf-4eed-bc6f-f571916851a0?# 《磁盘挂载》
- 添加用户,并修改系统配置
useradd elkpasswd elk # 设置用户密码WwQ8M8tn5!Z!R#uU
- 修改系统内存权限
修改vm.max_map_count(es至少需要的内存权限为:262144,默认用户的内存权限为:65530)
# 查看用户内存权限sysctl -a|grep vm.max_map_count# 设置用户内存权限vim /etc/sysctl.conf# 禁止内存与硬盘交换vm.swappiness=1# 设置虚拟内存大小,Elasticsearch使用了 NioFs(非阻塞文件系统)和 MMapFs(内存映射文件系统)。# 配置最大映射数量,以便有足够的虚拟内存可用于mmapped文件vm.max_map_count=262144# 是配置生效sysctl -p
- 修改打开文件数
默认打开文件描述符为4096,es至少需要65535
vim /etc/security/limits.conf# 追加一下内容(es是用户,也可以使用*代替所有用户)elk soft nofile 65536elk hard nofile 65536# 内存锁定交换elk soft memlock unlimitedelk hard memlock unlimited# 重新登陆用户并查看$su elk$ ulimit -acore file size (blocks, -c) 0data seg size (kbytes, -d) unlimitedscheduling priority (-e) 0file size (blocks, -f) unlimitedpending signals (-i) 31118max locked memory (kbytes, -l) 64max memory size (kbytes, -m) unlimitedopen files (-n) 65536 # 这里pipe size (512 bytes, -p) 8POSIX message queues (bytes, -q) 819200real-time priority (-r) 0stack size (kbytes, -s) 8192cpu time (seconds, -t) unlimitedmax user processes (-u) 4096virtual memory (kbytes, -v) unlimitedfile locks (-x) unlimited$ ulimit -Sn65536$ ulimit -Hn65536
ulimit -Hn: 是查看max number of open file descriptors的hard限制 ulimit -Sn: 是查看max number of open file descriptors的soft限制
2、Elasticsearch
:::
1. 解压并授权
# 解压tar xf elasticsearch-7.16.1-linux-x86_64.tar.gzmv elasticsearch-7.16.1 elasticsearchchown -R elk:elk /data/elk/
2. 修改配置文件
# 修改jvmvim /data/elk/elasticsearch/config/jvm.options# mkdir /data/elk/elasticsearch/{logs,data}# 配置文件vim /data/elk/elasticsearch/config/elasticsearch.yml#======= es配置开始 =======# 禁用geoip数据库的更新ingest.geoip.downloader.enabled: false# 数据目录和日志目录配置path.data: /data/elk/elasticsearch/datapath.logs: /data/elk/elasticsearch/logshttp.port: 9200# 集群名cluster.name: cluster-es# 节点名node.name: node-${HOSTNAME}# 监听ipnetwork.host: 192.168.6.5# 集群通信端口transport.port: 9300discovery.seed_hosts: ["192.168.6.5:9300"]# 首次启动指定的master节点cluster.initial_master_nodes: ["192.168.6.5:9300"]# 开启x-pack插件,用于添加账号密码xpack.security.enabled: true# 配置集群内容通证书xpack.security.transport.ssl.enabled: truexpack.security.transport.ssl.verification_mode: certificatexpack.security.transport.ssl.keystore.path: /data/elk/elasticsearch/config/elastic-certificates.p12xpack.security.transport.ssl.truststore.path: /data/elk/elasticsearch/config/elastic-certificates.p12#用HTTPS方式访问es,即logstash 发送数据至 es 的 方式# 如果需要使用https则开启一下配置xpack.security.http.ssl.enabled: falsexpack.security.http.ssl.verification_mode: certificatexpack.security.http.ssl.keystore.path: /data/elk/elasticsearch/config/elastic-certificates.p12xpack.security.http.ssl.truststore.path: /data/elk/elasticsearch/config/elastic-certificates.p12#======= es配置结束 =======
3. 配置es环境变量
vim /etc/profile.d/my_env.shexport ES_HOME=/data/elk/elasticsearchexport PATH=$PATH:${ES_HOME}/bin
4. 启动测试、配置账号密码
elasticsearch# 后台启动elasticsearch -d# 配置账号密码# 交互式配置密码(SE7AWZpxW8H6kVjW)elasticsearch-setup-passwords interactive# 信息如下Initiating the setup of passwords for reserved users elastic,apm_system,kibana,kibana_system,logstash_system,beats_system,remote_monitoring_user.You will be prompted to enter passwords as the process progresses.Please confirm that you would like to continue [y/N]yEnter password for [elastic]:Reenter password for [elastic]:Enter password for [apm_system]:Reenter password for [apm_system]:Enter password for [kibana_system]:Reenter password for [kibana_system]:Enter password for [logstash_system]:Reenter password for [logstash_system]:Enter password for [beats_system]:Reenter password for [beats_system]:Enter password for [remote_monitoring_user]:Reenter password for [remote_monitoring_user]:Changed password for user [apm_system]SE7AWZpxW8H6kVjWChanged password for user [kibana_system]Changed password for user [kibana]Changed password for user [logstash_system]Changed password for user [beats_system]Changed password for user [remote_monitoring_user]Changed password for user [elastic]
后期想要更改密码
curl -XPOST -u elastic "localhost:9200/_security/user/elastic/_password" -H 'Content-Type: application/json' -d'{"password" : "abcd1234"}'
5. 添加防火前规则访问测试
firewall-cmd --zone=public --add-port=9200/tcp --permanentfirewall-cmd --zone=public --add-port=9300/tcp --permanentfirewall-cmd --reloadfirewall-cmd --zone=public --remove-port=9200/tcp --permanentfirewall-cmd --zone=public --remove-port=9300/tcp --permanent# 查看开放的所有端口firewall-cmd --zone=public --list-ports
6. 访问测试
curl -X POST -H "Content-Type: application/json" \-d '{"username":"elastic", "password":"SE7AWZpxW8H6kVjW"}' \http://192.168.6.5:9200curl localhost:3000/api/basic -X POST -d 'hello=world'
3、Kibana
kibana和es的版本不能高于es,最好保持统一个版本号1. 解压
tar xf kibana-7.16.1-linux-x86_64.tar.gzmv kibana-7.16.1-linux-x86_64 kibana
2. 配置证书(如果es开了SSL,则kibana也必须使用SSL连接)
kibana 不能够直接使用 PKCS#12类型的证书!
# 生成kibana证书/data/elk/elasticsearch/bin/elasticsearch-certutil cert --ca /data/elk/elasticsearch/config/elastic-stack-ca.p12 --dns kibana --name kibana# 使用kibana证书生成kibana所需的ca证书openssl pkcs12 -in kibana.p12 -clcerts -nokeys -chain -out ca.pem
用下面的命令 从 elastic-stack-ca.p12 中分离出 kibana节点的key 和 crt
- kibana.p12 为 kibana 的证书,我们指定了 他的 dns 为 kibana
elasticsearch-certutil cert --pem -ca elastic-stack-ca.p12 --dns kibana
得到 certificate-bundle.zip,解压后得到 kibana节点的 key和 crt,就是下面配置中的 instance.key 和 instance.crt
3. 配置文件
# 配置文件vim kibana.ymllogging.dest: /data/elk/kibana/logs/kibana.log# kibana访问地址后面不能带/(不配置访问会报缺失server.publicBaseUrl 配置)server.publicBaseUrl: "http://192.168.6.11:5601"server.host: "192.168.6.5"server.port: 5601i18n.locale: "zh-CN"elasticsearch.requestTimeout: 90000elasticsearch.username: "kibana"elasticsearch.password: "SE7AWZpxW8H6kVjW"# es中设置的kibana账号信息(如果es使用https这里也必须配置)elasticsearch.hosts: ["http://192.168.6.5:9200"] # 如果开启了SSL这里需要配置为https##用HTTPS方式访问kibana#server.ssl.enabled: true#elasticsearch.ssl.verificationMode: certificate#server.ssl.certificate: /data/elk/kibana/config/instance.crt#server.ssl.key: /data/elk/kibana/config/instance.key## 注意 这里 用 ca.pem 证书#elasticsearch.ssl.certificateAuthorities: ["/data/elk/kibana/config/ca.pem"]#xpack.reporting.encryptionKey: "something_at_least_32_characters"
如果你不想将用户ID和密码放在kibana.yml文件中明文配置,可以将它们存储在密钥库中。运行以下命令以创建Kibana密钥库并添加配置:
- 8.4.3版本去掉了
logging.dest,使用一下配置来替换
# Set the value of this setting to off to suppress all logging output, or to debug to log everything. Defaults to 'info'# 将此设置的值设置为off以禁止所有日志记录输出,或调试以记录所有内容。默认为“info”logging.root.level: info# 允许您指定Kibana存储日志输出的文件。(Enables you to specify a file where Kibana stores log output.)logging.appenders.default:type: filefileName: /dcos/elk/kibana/logs/kibana.loglayout:type: json# 记录发送到Elasticsearch的查询。(Logs queries sent to Elasticsearch.)#logging.loggers:# - name: elasticsearch.query# level: debug### 记录http响应。(Logs http responses.)#logging.loggers:# - name: http.server.response# level: debug### 记录系统使用信息。(Logs system usage information.)#logging.loggers:# - name: metrics.ops# level: debug# =================== System: Other ===================# Kibana存储Elasticsearch中未保存的持久数据的路径。path.data: data# 进程ID存储位置pid.file: /dcos/elk/kibana/kibana.pid
./bin/kibana-keystore create./bin/kibana-keystore add elasticsearch.username./bin/kibana-keystore add elasticsearch.password
4. 启动测试
# 前台启动./bin/kibana# 后台启动nohup ./bin/kibana &firewall-cmd --zone=public --add-port=5601/tcp --permanentfirewall-cmd --reloadfirewall-cmd --zone=public --list-ports
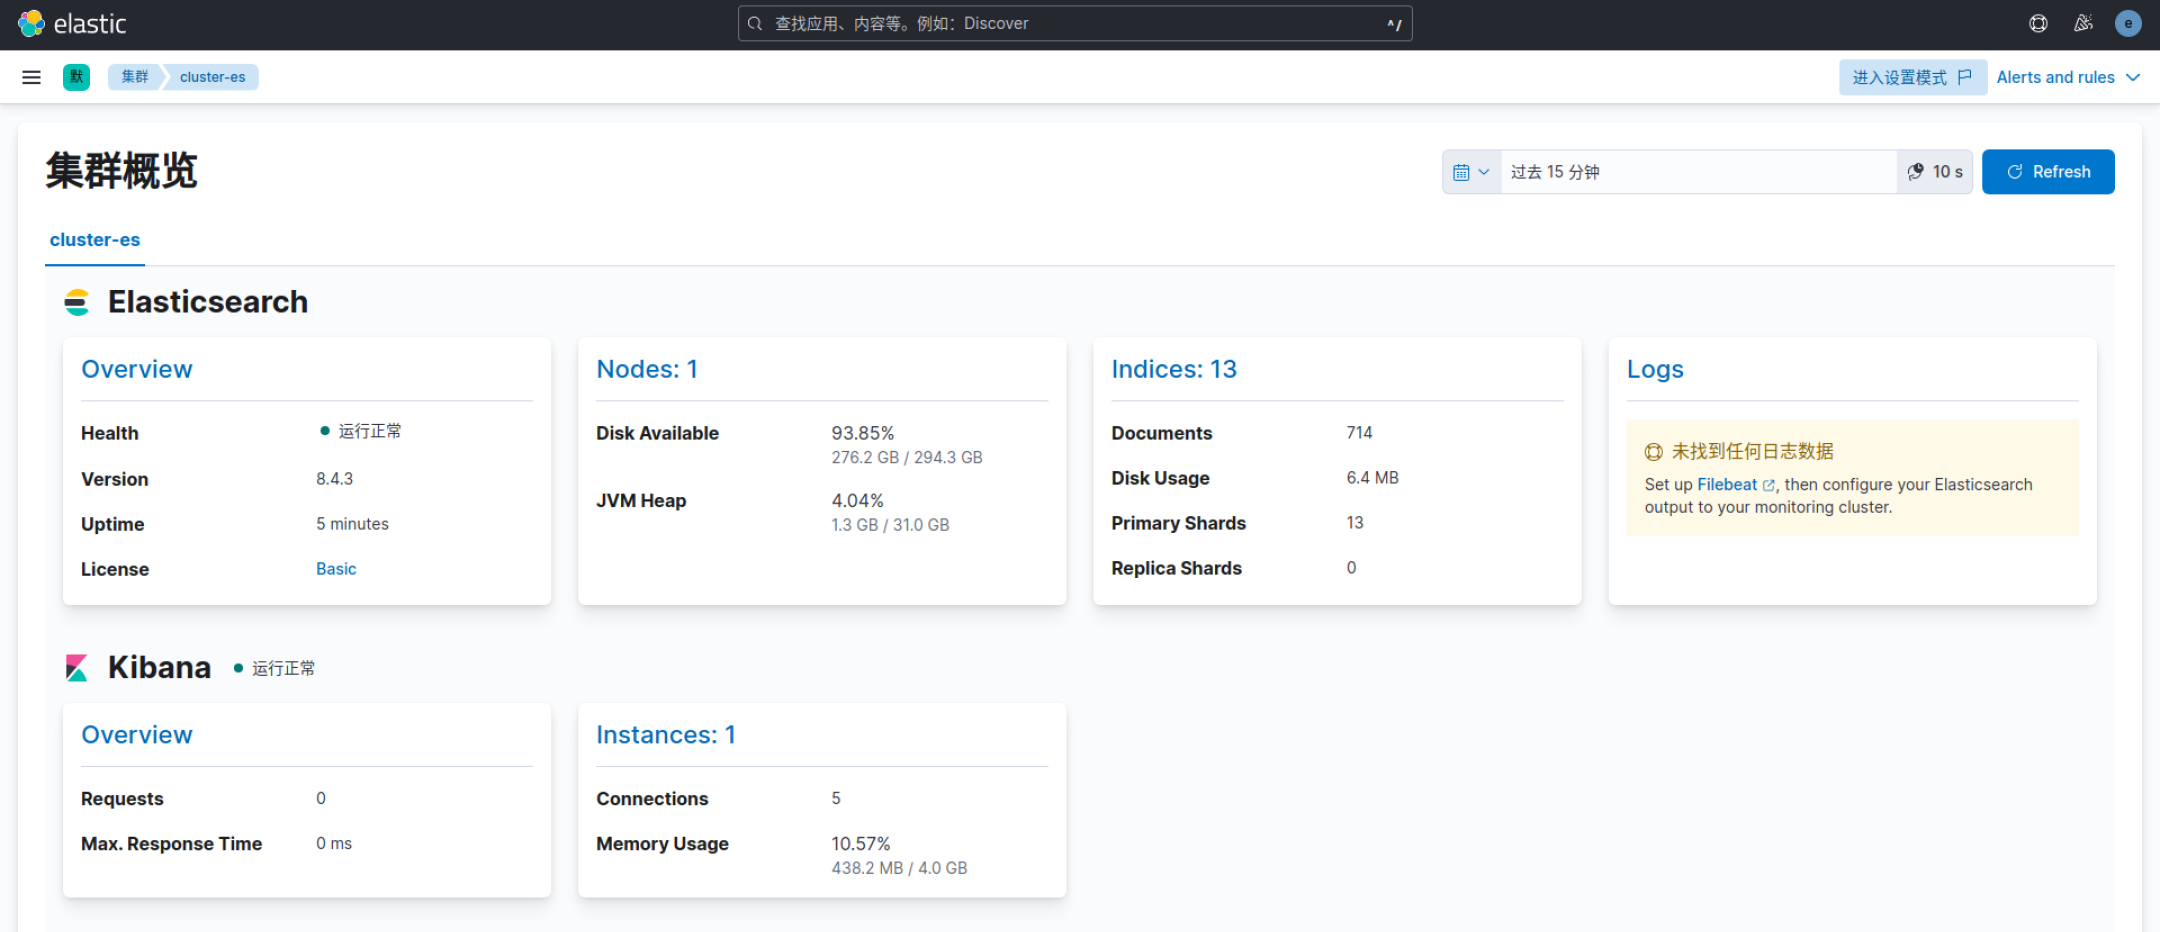
5. 配置es堆栈监测
- 登陆kibana后进入堆栈监测(Stack Monitoring)无法显示数据,需要在es中开启监测
# ES配置文件中添加下面一行,开启监测功能并重启服务xpack.monitoring.collection.enabled: true
4、Logstash
1. 解压
tar xf logstash-7.16.2-linux-x86_64.tar.gzmv logstash-7.16.2 logstash
2. 配置证书(如果需要使用https协议)
logstash 不能够直接使用 PKCS#12类型的证书! 所以我们需要 使用命令,去 logstash-node-1.p12 的证书中提取 pem证书
# 使用es命令获取logstash证书/data/elk/elasticsearch/bin/elasticsearch-certutil cert --ca /data/elk/elasticsearch/config/elastic-stack-ca.p12 --dns logstash-node-1 --name logstash-node-1# 使用logstash证书获取pem证书(生成ca.pem证书,回车即可)openssl pkcs12 -in /data/elk/logstash/config/logstash-node-1.p12 -clcerts -nokeys -chain -out ca.pem
- 将证书移动至logstash的config目录
3. 配置文件
# 配置文件grep -v '^#' logstash.ymlpipeline: # 管道配置batch:size: 125delay: 5http.enabled: truehttp.host: 192.168.6.5node.name: logstashapi.http.port: 9600-9700log.level: infopath.data: /data/elk/logstash/data/path.logs: /data/elk/logstash/logs/# path.config: /data/elk/logstash/conf.d/xpack.monitoring.enabled: truexpack.monitoring.elasticsearch.username: logstash_systemxpack.monitoring.elasticsearch.password: SE7AWZpxW8H6kVjW# 这里必须用 https(es使用了https这里也必须使用)xpack.monitoring.elasticsearch.hosts: ["http://192.168.6.5:9200"]# 如果使用https需要开启一下配置#xpack.monitoring.elasticsearch.hosts: ["https://192.168.6.5:9200"]##你的ca.pem 的所在路径#xpack.monitoring.elasticsearch.ssl.verification_mode: certificate#xpack.monitoring.elasticsearch.ssl.certificate_authority: "/data/elk/logstash/config/ca.pem"## 探嗅 es节点,设置为 false#xpack.monitoring.elasticsearch.sniffing: false
4. 启动测试
# 不能够直接启动,会报错,使用以下方法启动后输入hello./logstash -e "input {stdin {}} output {stdout {}}"...[2022-09-07T18:25:20,996][INFO ][logstash.javapipeline ][main] Pipeline started {"pipeline.id"=>"main"}The stdin plugin is now waiting for input:[2022-09-07T18:25:21,026][INFO ][logstash.agent ] Pipelines running {:count=>1, :running_pipelines=>[:main], :non_running_pipelines=>[]}hello # 输入返回一下值{"@version" => "1","host" => "02-0001.novalocal","message" => "hello","@timestamp" => 2022-09-07T10:25:59.146Z}# 使用配置文件启动
5. 采集kafka数据至 Elasticsearch
logstash可以通过命令行并使用 -e 参数传入配置字符串,指定了标准输入 stdin 插件和 stdout 插件,但在实际应用中,通常使用配置文件指定插件,配置文件的语法形式与命令行相同,要使用的插件使用过插件名称来指定,一般配置文件均放置到部署目录的config目录中,如下在配置中一个名为std_es.conf的文件,具体配置如下:
# 配置tomcat日志input {file {path => "/usr/share/tomcat/logs/*.log"start_position => beginning}}filter {}output {elasticsearch {hosts => "192.168.6.11:9200"}}# kafka配置input {kafka{bootstrap_servers => ["192.168.6.11:9092"]group_id => "es"topics => ["myTest"]codec => json {charset => "UTF-8"}}}output {# 处理后的日志落到本地文件file {path => "/data/logstash/kafka_test.log"flush_interval => 0}# 处理后的日志入eselasticsearch {hosts => ["192.168.6.11:9200"]index => "test"id => "my_plugin_id"document_id => "%{userid}"document_type => "mytype"user => "logstash_system"password => "SE7AWZpxW8H6kVjW"}}
线上
input {kafka {bootstrap_servers => "192.168.6.13:9092"group_id => "host_log1"client_id => "logstash1"auto_offset_reset => "earliest"topics => ["zdww-kafka"]codec => json { charset => "UTF-8" }type => "fromk"}}output {elasticsearch {hosts => ["http://192.168.6.12:9200"]index => "zdww-kafka-%{+YYYY.MM.dd}"}}
6. 启动
./bin/logstash -f config/*.conf# 后台启动nohup ./bin/logstash -f conf.d/kafka.conf &
5、elasticsearch-head
- 插件下载方式安装:https://github.com/mobz/elasticsearch-head下载ZIP包。
- 解压包中的所有内容(不包括elasticsearch-head-master目录)到elasticsearch安装目录下的
plugins/head/目录下- 重启Elasticsearch
- 访问:
IP:9200/_plugin/head
1. 安装nodejs
# 下载wget https://npm.taobao.org/mirrors/node/latest-v4.x/node-v4.4.7-linux-x64.tar.gz# 创建目录mkdir /usr/local/nodejs# 解压tar xf node-v4.4.7-linux-x64.tar.gz -C /usr/local/nodejs# 设置环境变量vim /etc/profile.d/my_env.shNODE_HOME=/usr/local/nodejs/node-v4.4.7-linux-x64PATH=$PATH:$NODE_HOME/binNODE_PATH=$NODE_HOME/lib/node_modulesexport NODE_HOME PATH NODE_PATH# 生效source /etc/profile# 版本
推荐的Elasticsearch可是化:
- ElasticHD
- cerebro
- elasticsearch-head
:::success 参考链接:
https://www.elastic.co/cn/support/matrix#matrix_compatibility
https://blog.csdn.net/LSY929981117/article/details/107793113
:::

若有收获,就点个赞吧
0 人点赞
