参考:https://mp.weixin.qq.com/s/c2SfPzGyjKZ3lPOdq6JVmg 注明:仅作为笔记,无任何商业用途。
介绍
有很多R主题包可以方便的进行图形主题修改,但是这里学习下如何自定义自己的绘图主题,下面关键一些主题函数已经进行了注释,可以复制代码跑一跑。
ggplot2主题
Components
Components指图上的y轴标题,x轴的ticks等,只要你能在图上看见的部分,其包括:
aspect.ratioaxis.title, axis.title.x, axis.title.x.top, axis.title.x.bottom,axis.title.y, axis.title.y.left, axis.title.y.right, axis.text,axis.text.x, axis.text.x.top, axis.text.x.bottom, axis.text.y,axis.text.y.left, axis.text.y.right, axis.ticks, axis.ticks.x,axis.ticks.x.top, axis.ticks.x.bottom, axis.ticks.y,axis.ticks.y.left, axis.ticks.y.right, axis.ticks.length,axis.line, axis.line.x, axis.line.x.top, axis.line.x.bottom,axis.line.y, axis.line.y.left, axis.line.y.rightlegend.background, legend.margin, legend.spacing, legend.spacing.x,legend.spacing.y, legend.key, legend.key.size, legend.key.height,legend.key.width, legend.text, legend.text.align, legend.title,legend.title.align, legend.position, legend.direction,legend.justification, legend.box, legend.box.just
Elements
Elements:各个Components有各种各样的Elements,理解为Components的样式,设定Components的展现形式,包括:
element_line(), element_rect()element_text(), element_blank()
实战
环境准备
# 环境准备install.packages("tidyverse")install.packages("gapminder")library(tidyverse)library(gapminder)
生成测试数据
# 示例数据构建gapminder %>%filter(year == 1992) %>%ggplot() +aes(x = gdpPercap, y = lifeExp) +geom_point(alpha = 0.8, shape = 21,fill = "white") +aes(col = continent, fill = continent) +geom_point(alpha = 0.3, shape = 21) +aes(size = pop) +scale_size(guide = F) +labs(title = "Wealth and expected longevity\n in 1992") +labs(subtitle = "Data from gapminder package in R") +labs(x = "GDP per Capita") +labs(y = "Life Expectency") + # a tag is also an optionlabs(col = "Continent", fill = "Continent") +labs(caption = "Vis: @EvaMaeRey with ggplot") ->g
Components在图形中的位置
# components在图形中的位置g +# 图形四周theme(rect = element_rect(fill = "snow3")) +# 字体theme(text = element_text(family = "Times New Roman")) +# x,y轴标题theme(axis.title = element_text(color = "slateblue4")) +# 标题theme(title = element_text(color = "seagreen")) +# x,y轴线条theme(axis.line = element_line(color = "orange")) +# 图例theme(legend.key = element_rect(fill = "violet")) +# x,y轴tickstheme(axis.ticks = element_line(color = "blue")) +# x轴tickstheme(axis.ticks.x = element_blank()) +# 图形背景theme(panel.background = element_rect(fill = "steelblue")) +# 图形网格线条theme(panel.grid = element_line(size = 3, color = "thistle1")) +# 图例背景theme(legend.background = element_rect(fill = "goldenrod1")) +# 图例字体theme(legend.text = element_text(size = 7)) +# 图例位置theme(legend.position = "bottom") +# 图例边缘theme(legend.margin = margin(t = 0, r = 20,b = 0, l = 40, unit = "pt")) +# 图形长宽比例theme(aspect.ratio = .5)
element_text调整字体
# elements_text调整字体g +# 大标题位置theme(plot.title.position = "plot") +# 大标题高度-lineheighttheme(plot.title = element_text(color = "plum4",size = 20,lineheight = 2.5)) +# 小标题颜色theme(plot.subtitle = element_text(color = "plum4")) +# y轴标题theme(axis.title.y = element_text(color = "plum4",size = 20 )) +# y轴上字体颜色theme(axis.text.y = element_text(color = "plum4")) +# 图例颜色theme(legend.title = element_text(color = "plum4",size = 22)) +# 图例字体颜色theme(legend.text = element_text(color = "plum4")) +# x轴标题颜色theme(axis.title.x = element_text(color = "plum4")) +# x轴字体颜色theme(axis.text.x = element_text(color = "plum4")) +# caption注释颜色theme(plot.caption = element_text(color = "plum4",size = 20)) +# 图形中所有字体,定义字体类型theme(text = element_text(family = "Times")) +# 所有字体样式theme(text = element_text(face = "bold.italic")) +# 所有字体间的间隔theme(text = element_text(margin = margin(t = 3, r = 3, b = 3, l = 3,unit = "pt"))) +# 字体旋转角度theme(text = element_text(angle = 2)) +# 大标题字体位置theme(plot.title = element_text(hjust = .5)) +# x轴标题字体位置theme(axis.title.x = element_text(hjust = 1))
element_rect调整图形背景
# element_rect调整图形背景g +# 图形四周背景颜色theme(plot.background = element_rect(fill = "purple",color = "darkolivegreen",size = 3)) +# 图形背景颜色theme(panel.background = element_rect(fill = "purple",color = "darkolivegreen",size = 3)) +# 图例背景颜色theme(legend.background = element_rect(fill = "purple",color = "darkolivegreen",size = 3)) +# 图例中的图形背景颜色theme(legend.key = element_rect(fill = "purple",color = "darkolivegreen",size = 3)) +# 图形边框颜色theme(panel.border = element_rect(color = "magenta",fill = NA, size = 4))
element_line调整线条
# element_line调整线条g +# y轴线体颜色theme(axis.ticks.y = element_line(size = 10,color = "blue")) +# x轴线体颜色theme(axis.ticks.x = element_line(size = 10,color = "blue")) +# 背景大横线颜色theme(panel.grid.major.y = element_line(size = 2,linetype = "dashed",color = "blue",lineend = "round")) +# 背景大竖线颜色theme(panel.grid.major.x = element_line(size = 2,arrow = arrow(),color = "blue",lineend = "round")) +# 背景小横线颜色theme(panel.grid.minor.y = element_line(size = 1,linetype = "dotted",color = "blue",lineend = "butt")) +# 背景网格线颜色theme(panel.grid = element_line(color = "blue")) +# unknowtheme(axis.line.x.top = element_line(size = 2,color = "blue")) +# 去除背景颜色theme(panel.ontop = TRUE,panel.background = element_blank()) # in front of the data
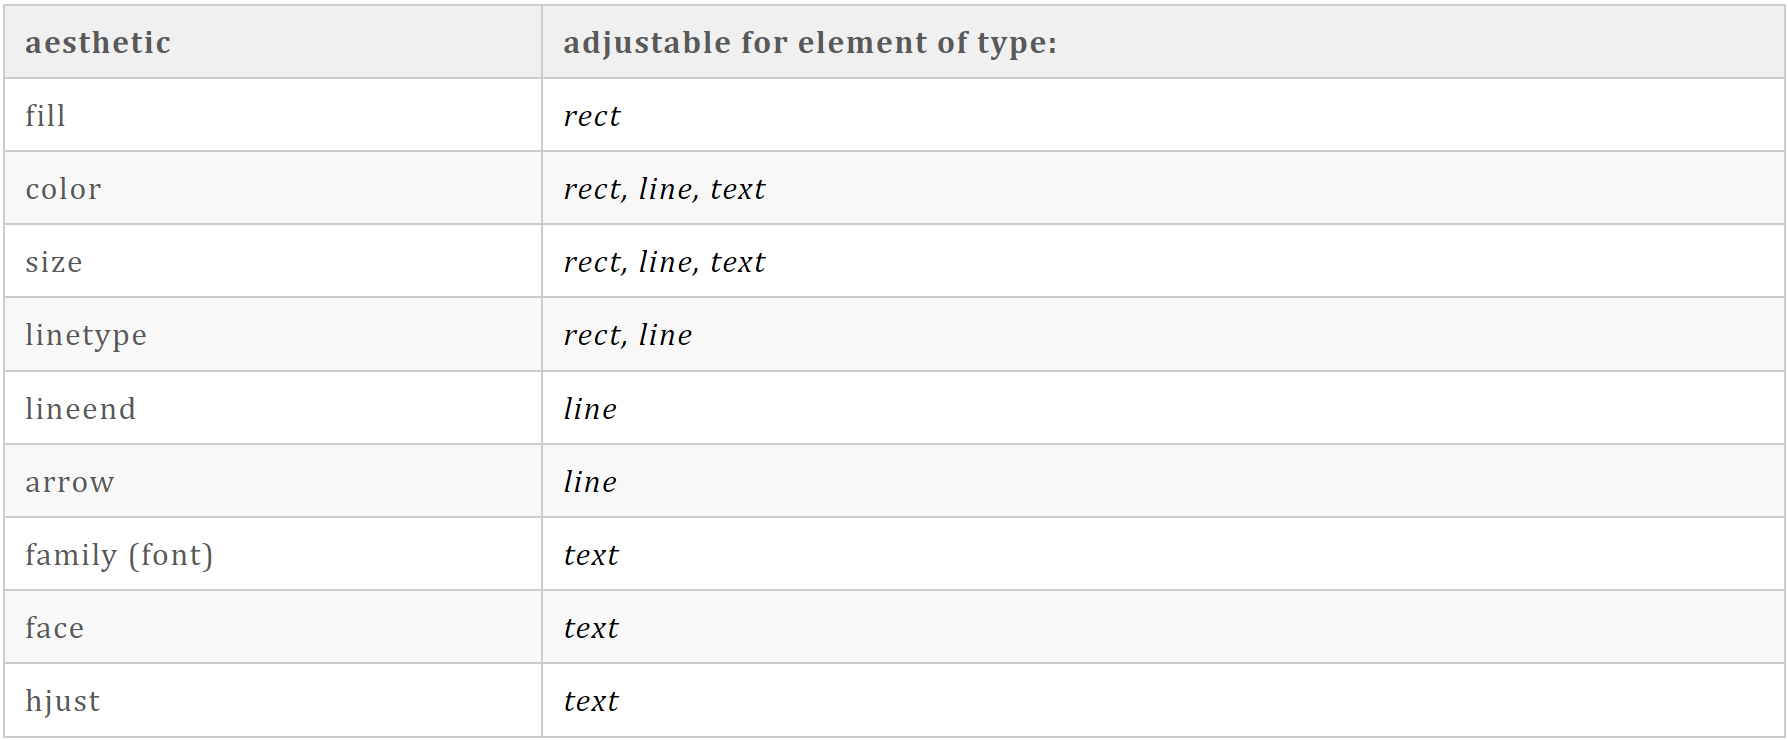
哪些aesthetics(图上映射的形状)的elements是可以调整的?
图例调整
# 图例调整g +# 图例位置:下theme(legend.position = "bottom") +# 图例:去除theme(legend.position = "none") +# 图例位置:x=0.8 y=0.25theme(legend.position = c(.8, .25)) +# 图例水平放置theme(legend.direction = "horizontal") +# 去除图例中的图形theme(legend.key = element_rect()) +guides(fill = guide_legend(size = 35))
其他修改
# 其它调整g +# unknowtheme(plot.tag.position = "topright") +# 去除颜色图例scale_color_discrete(guide = FALSE) +# 去除填充图例scale_fill_discrete(guide = FALSE) +# x轴放于上方scale_x_continuous(position = "top") +# y轴放于右侧scale_y_continuous(position = "right") +# 长宽比:0.5theme(aspect.ratio = .5)
分面的主题
# 分面主题g +# facet_wrap进行分面facet_wrap(~ continent,strip.position = "right") +# 分面的分组字体背景theme(strip.background =element_rect(fill = "pink")) +# 分面的分组字体颜色theme(strip.text.y =element_text(color = "snow", size = 12)) +# 分面的分组字体旋转角度theme(strip.text.y =element_text(angle = -80)) +# 各个分面在x轴方向的间隔theme(panel.spacing.x =unit(1.5, "lines")) +# 各个分面在y轴方向的间隔theme(panel.spacing.y =unit(2, "lines")) +theme(strip.switch.pad.grid =unit(0, "cm"))

若有收获,就点个赞吧
0 人点赞
