图形是数据的一种表现方式,任何精美的图都要有精美的数据做支撑。
常用的可视化R包
base满足基本的绘图要求,ggplot2和ggpubr可以做出精美的图片。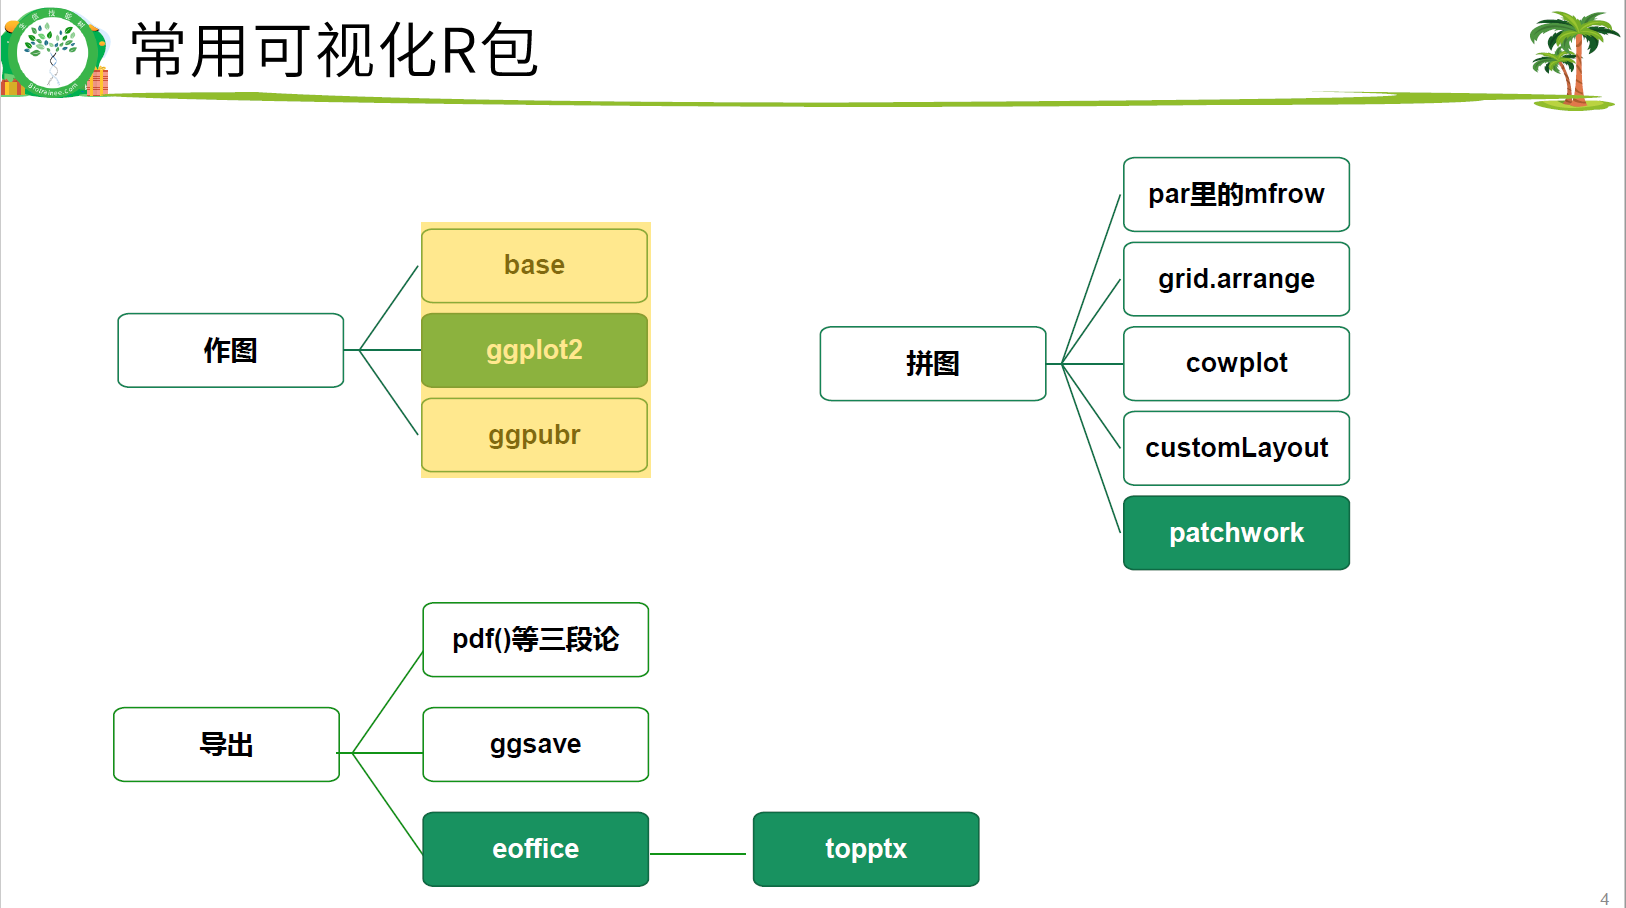
ggplot2
绘图代码模板
ggplot (data = <DATA>)+<GEOM_FUNCTION>(mapping = ase (<MAPPINGS>))
属性设置
常见属性参数
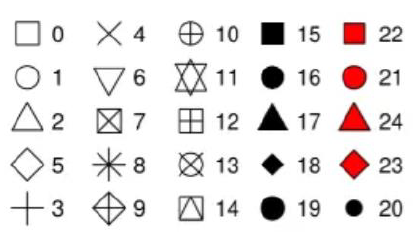
color ## 边框颜色,设置为字符串,如blue、十六位进制颜色代码等size ## 形状大小,单位是mmshape ## 形状,用具体的数字编号表示alpha ## 透明度fill ## 填充颜色
如:
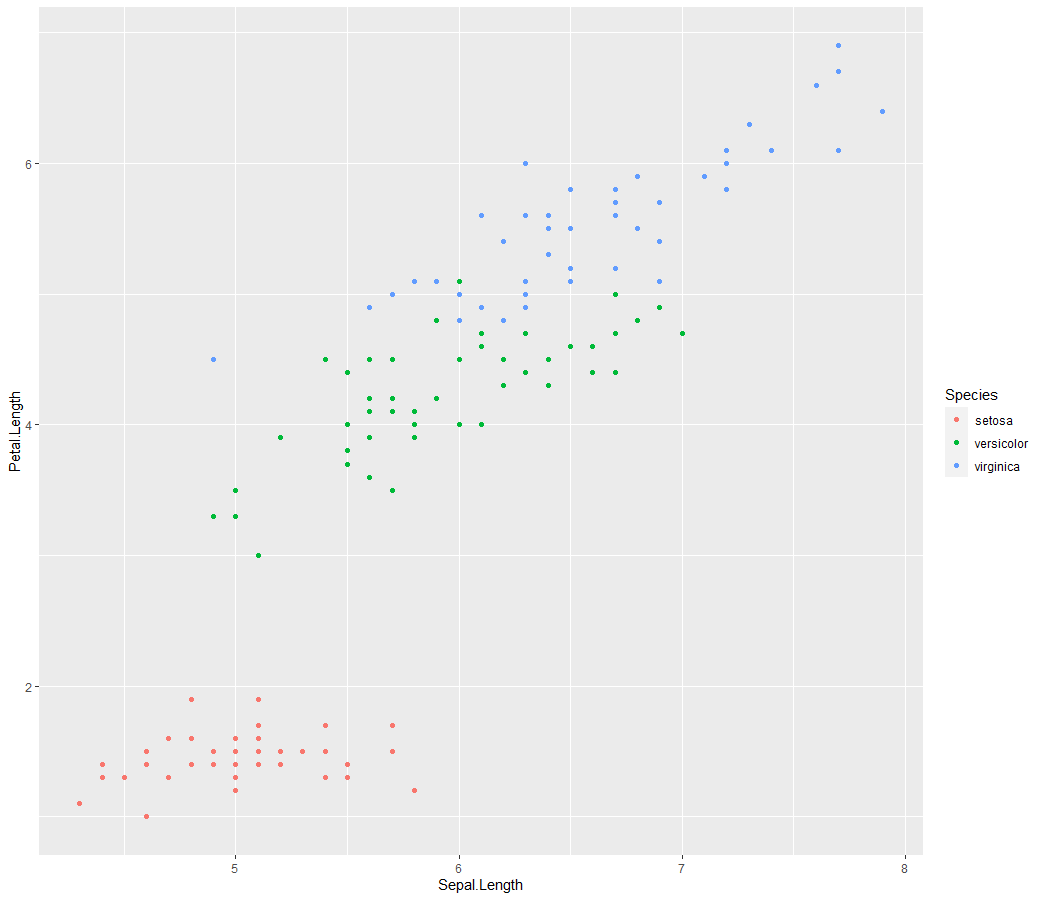
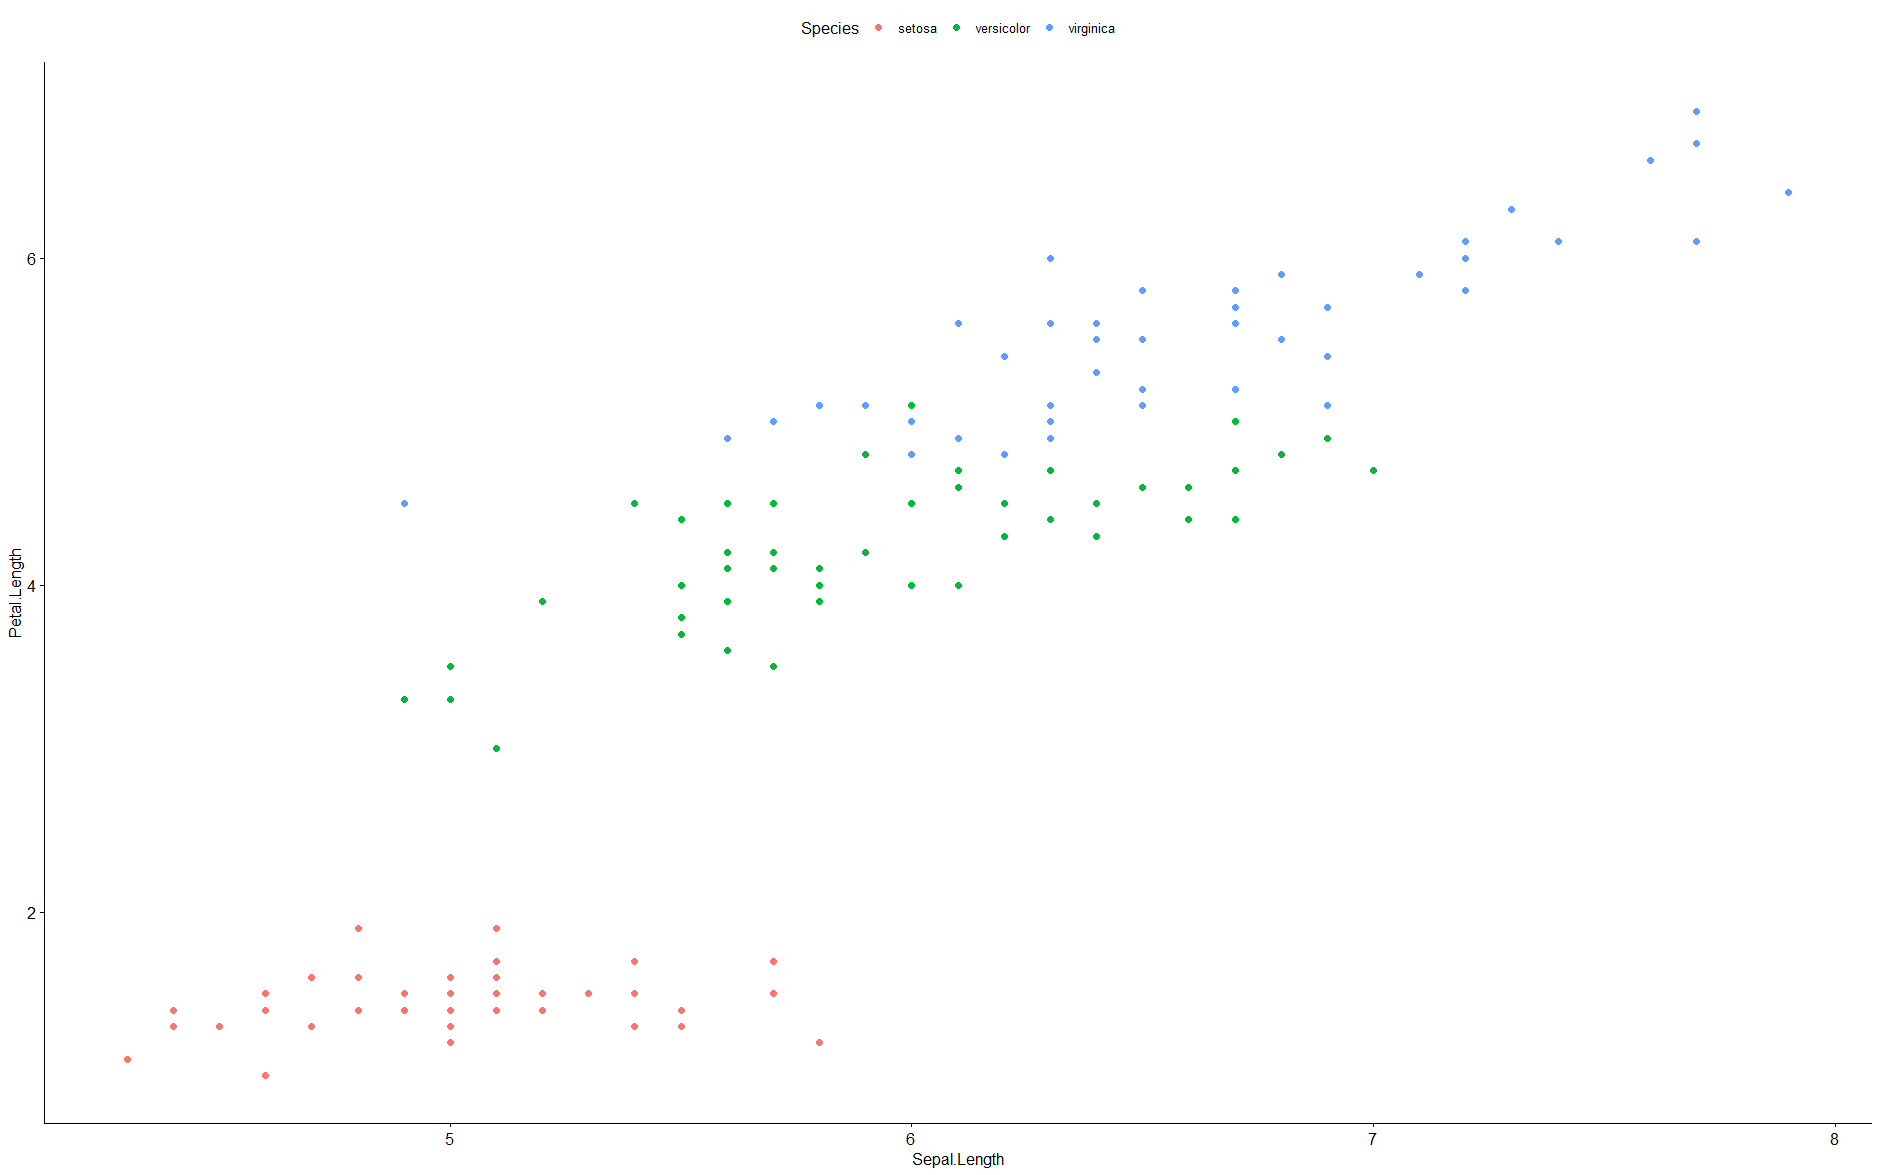
ggplot(data = iris)+geom_point(mapping = aes(x = Sepal.Length,y = Petal.Length,color = Species))
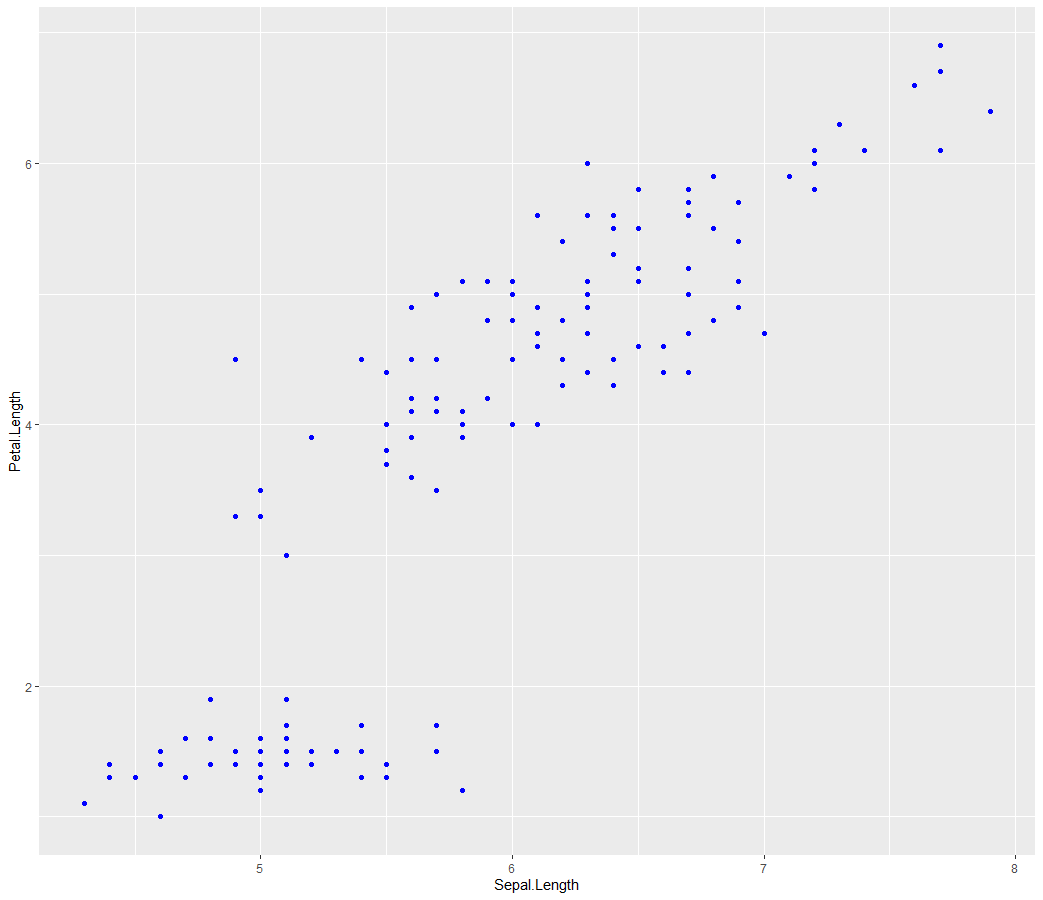
## 修改颜色,需要在全局改ggplot(data = iris)+geom_point(mapping = aes(x = Sepal.Length,y = Petal.Length),color = "blue")
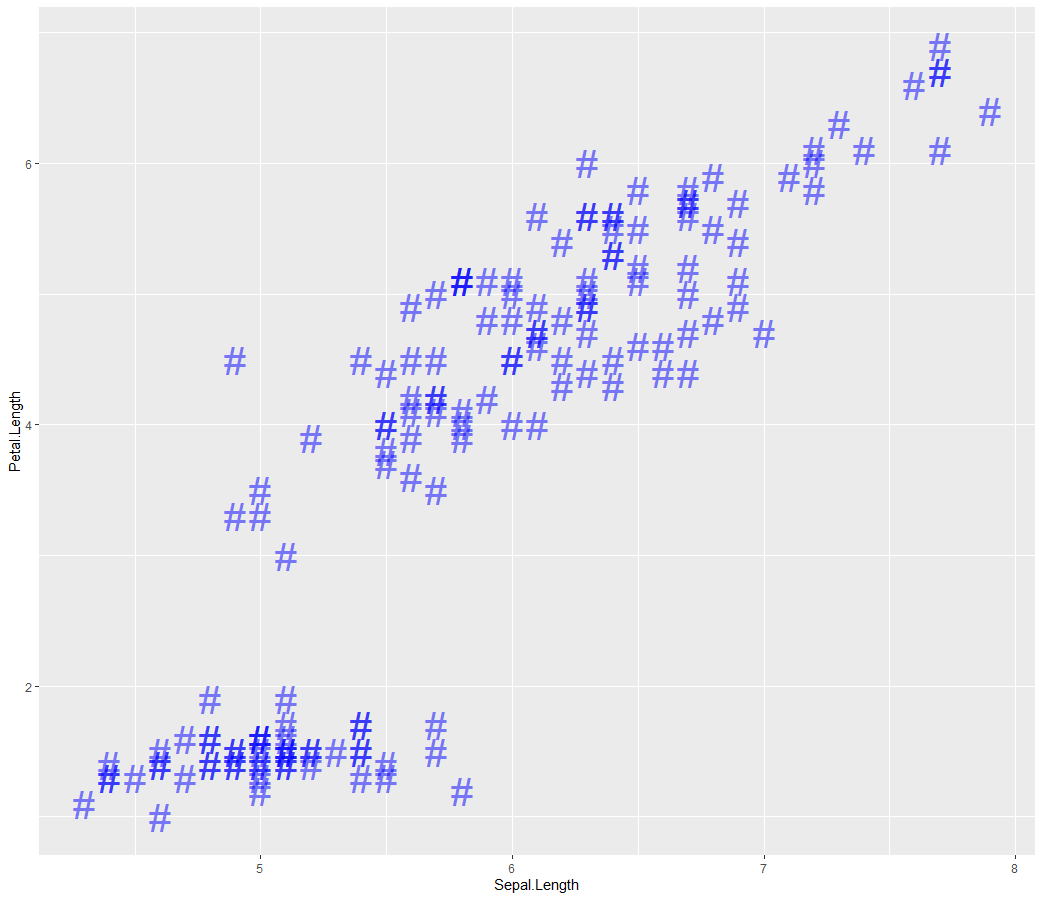
## 修改点的格式,需要在全局改ggplot(data = iris)+geom_point(mapping = aes(x = Sepal.Length,y = Petal.Length),color = "blue",size = 10,alpha = 0.5,shape = "#")
映射
按照数据框的某一列定义图的某个属性,是全局和个别的关系。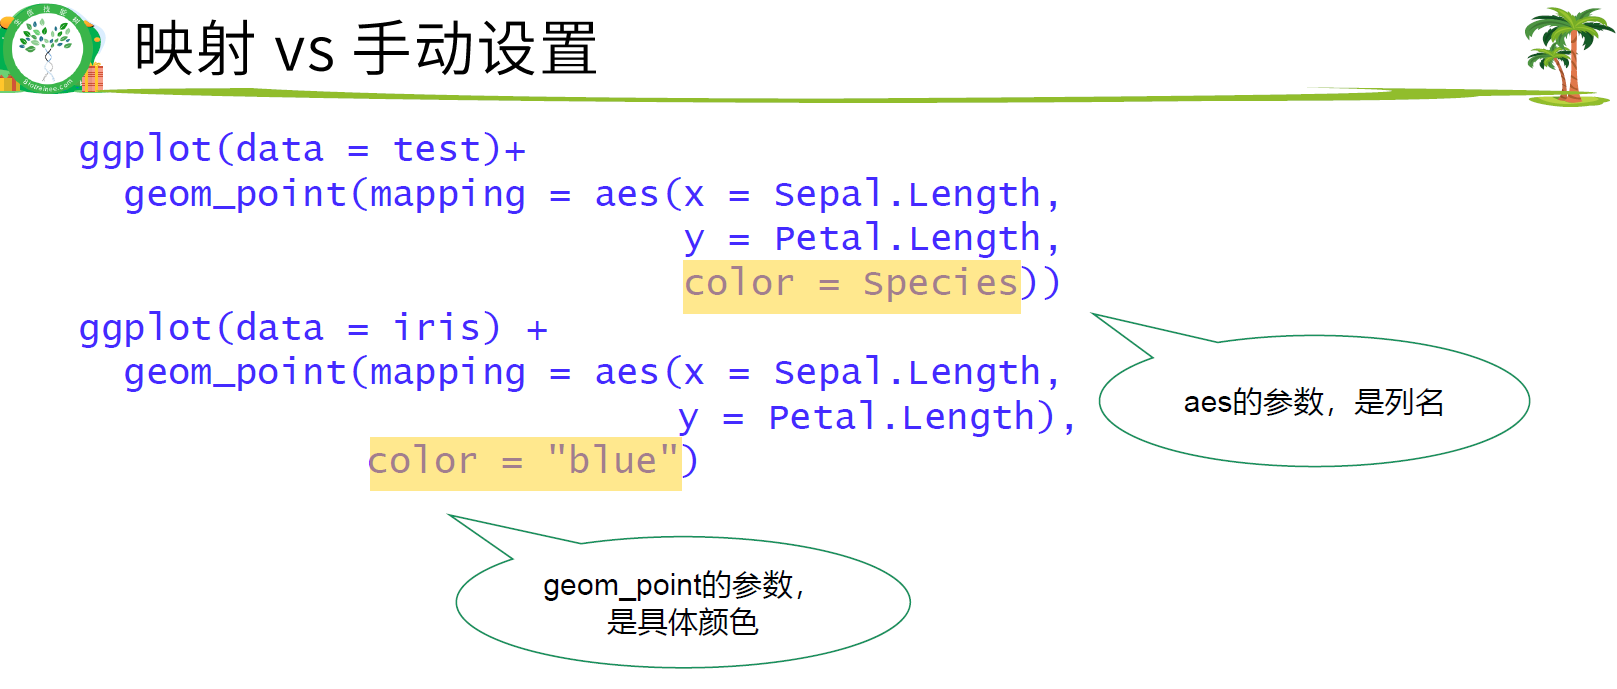
十六进制颜色代码表:
https://blog.csdn.net/TheLittlePython/article/details/79063779
区分color和fill两个属性
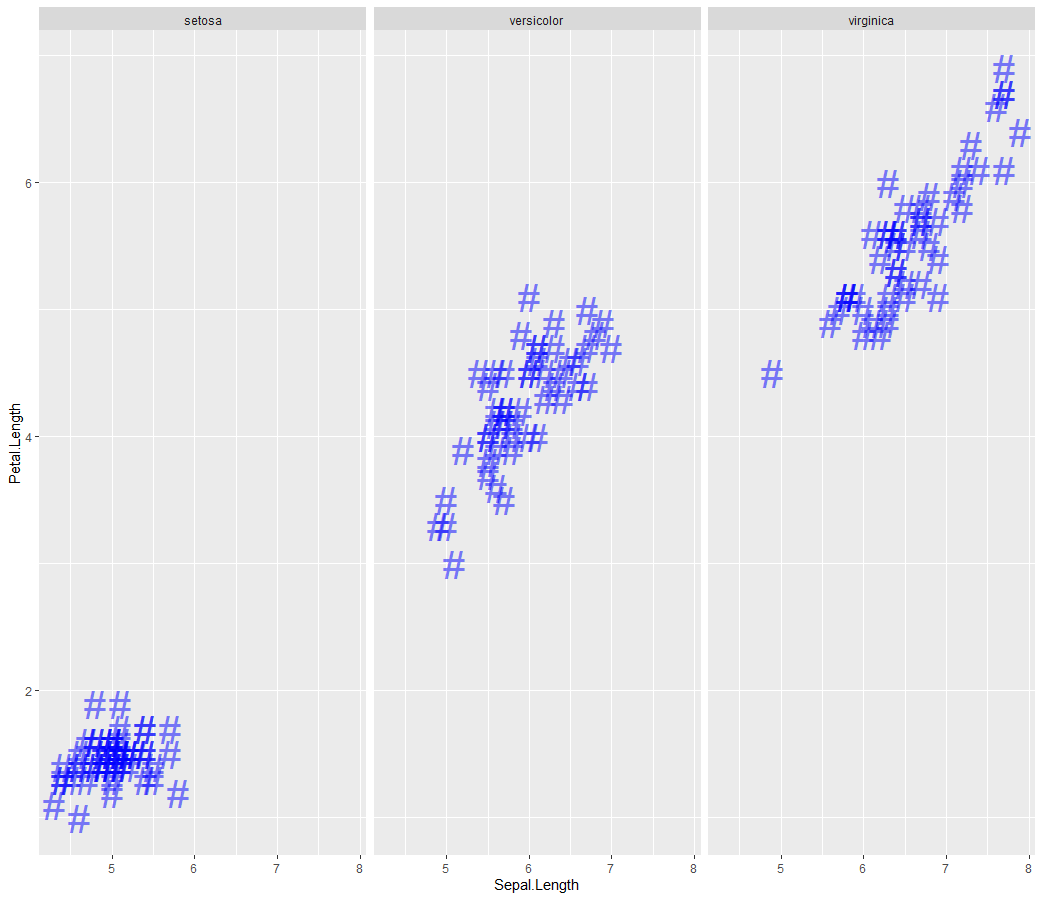
分面
分面
如:
ggplot(data = iris)+geom_point(mapping = aes(x = Sepal.Length,y = Petal.Length),color = "blue",size = 10,alpha = 0.5,shape = "#")

## 分面ggplot(data = iris)+geom_point(mapping = aes(x = Sepal.Length,y = Petal.Length),color = "blue",size = 10,alpha = 0.5,shape = "#")+facet_wrap(~Species)
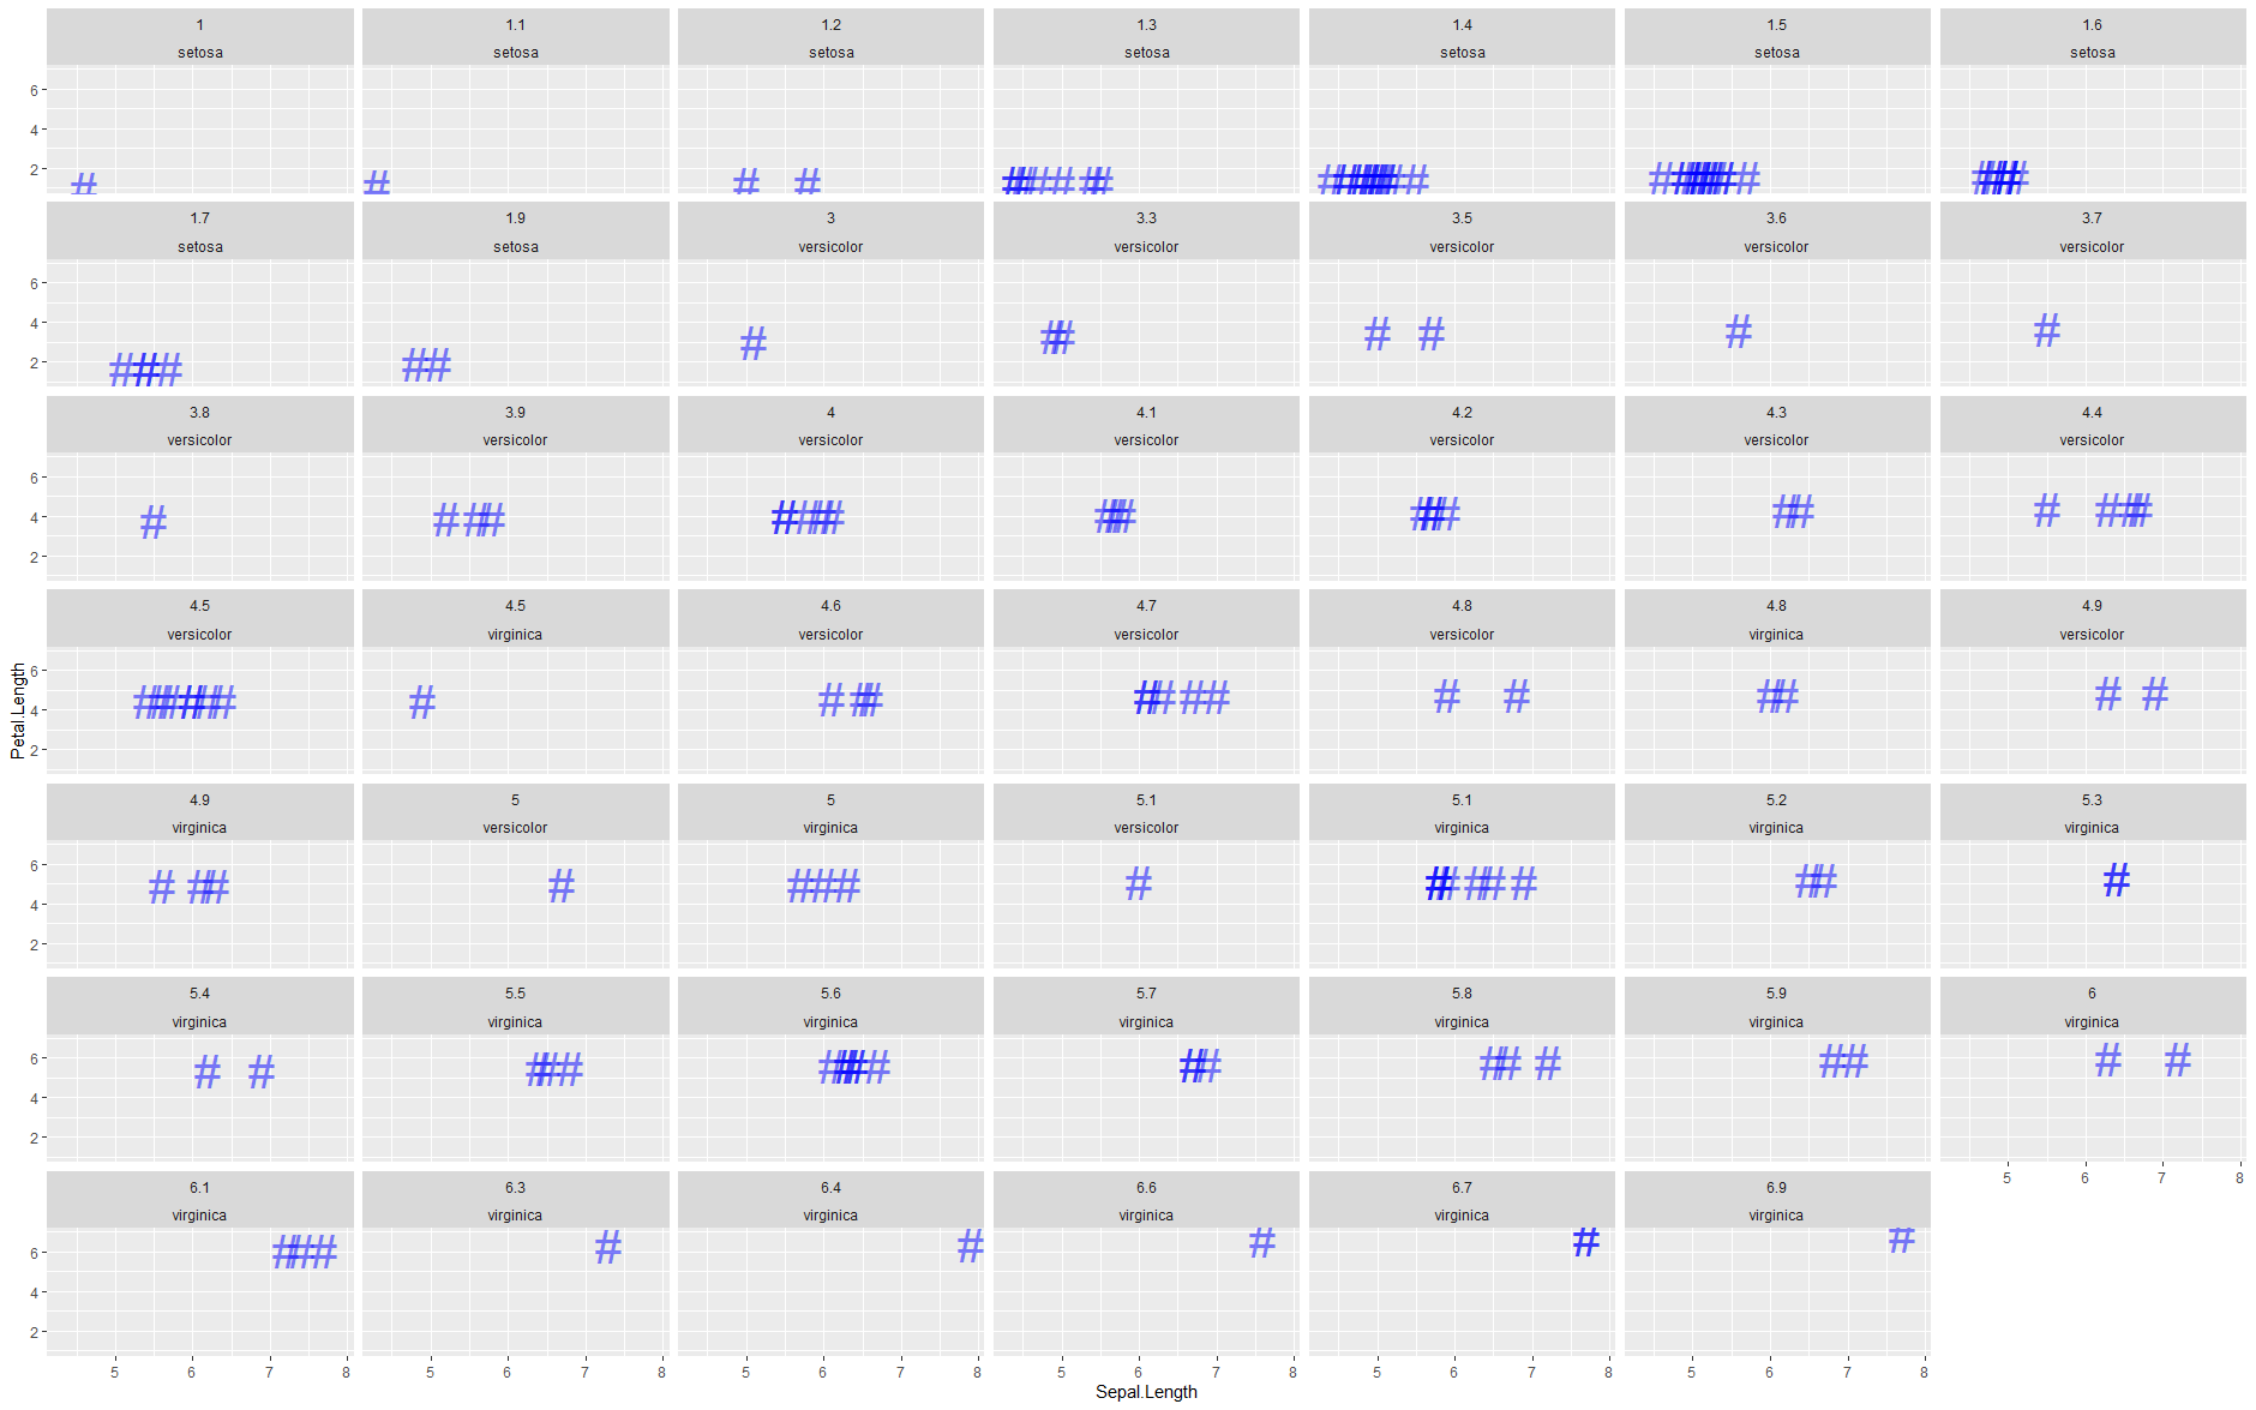
双分面
## 双分面ggplot(data = iris)+geom_point(mapping = aes(x = Sepal.Length,y = Petal.Length),color = "blue",size = 10,alpha = 0.5,shape = "#")+facet_wrap(Petal.Length ~ Species)
几何对象
具体指做的图层,可以叠加,需要注意图层上下顺序,以便点在最上层。
图层叠加
如:
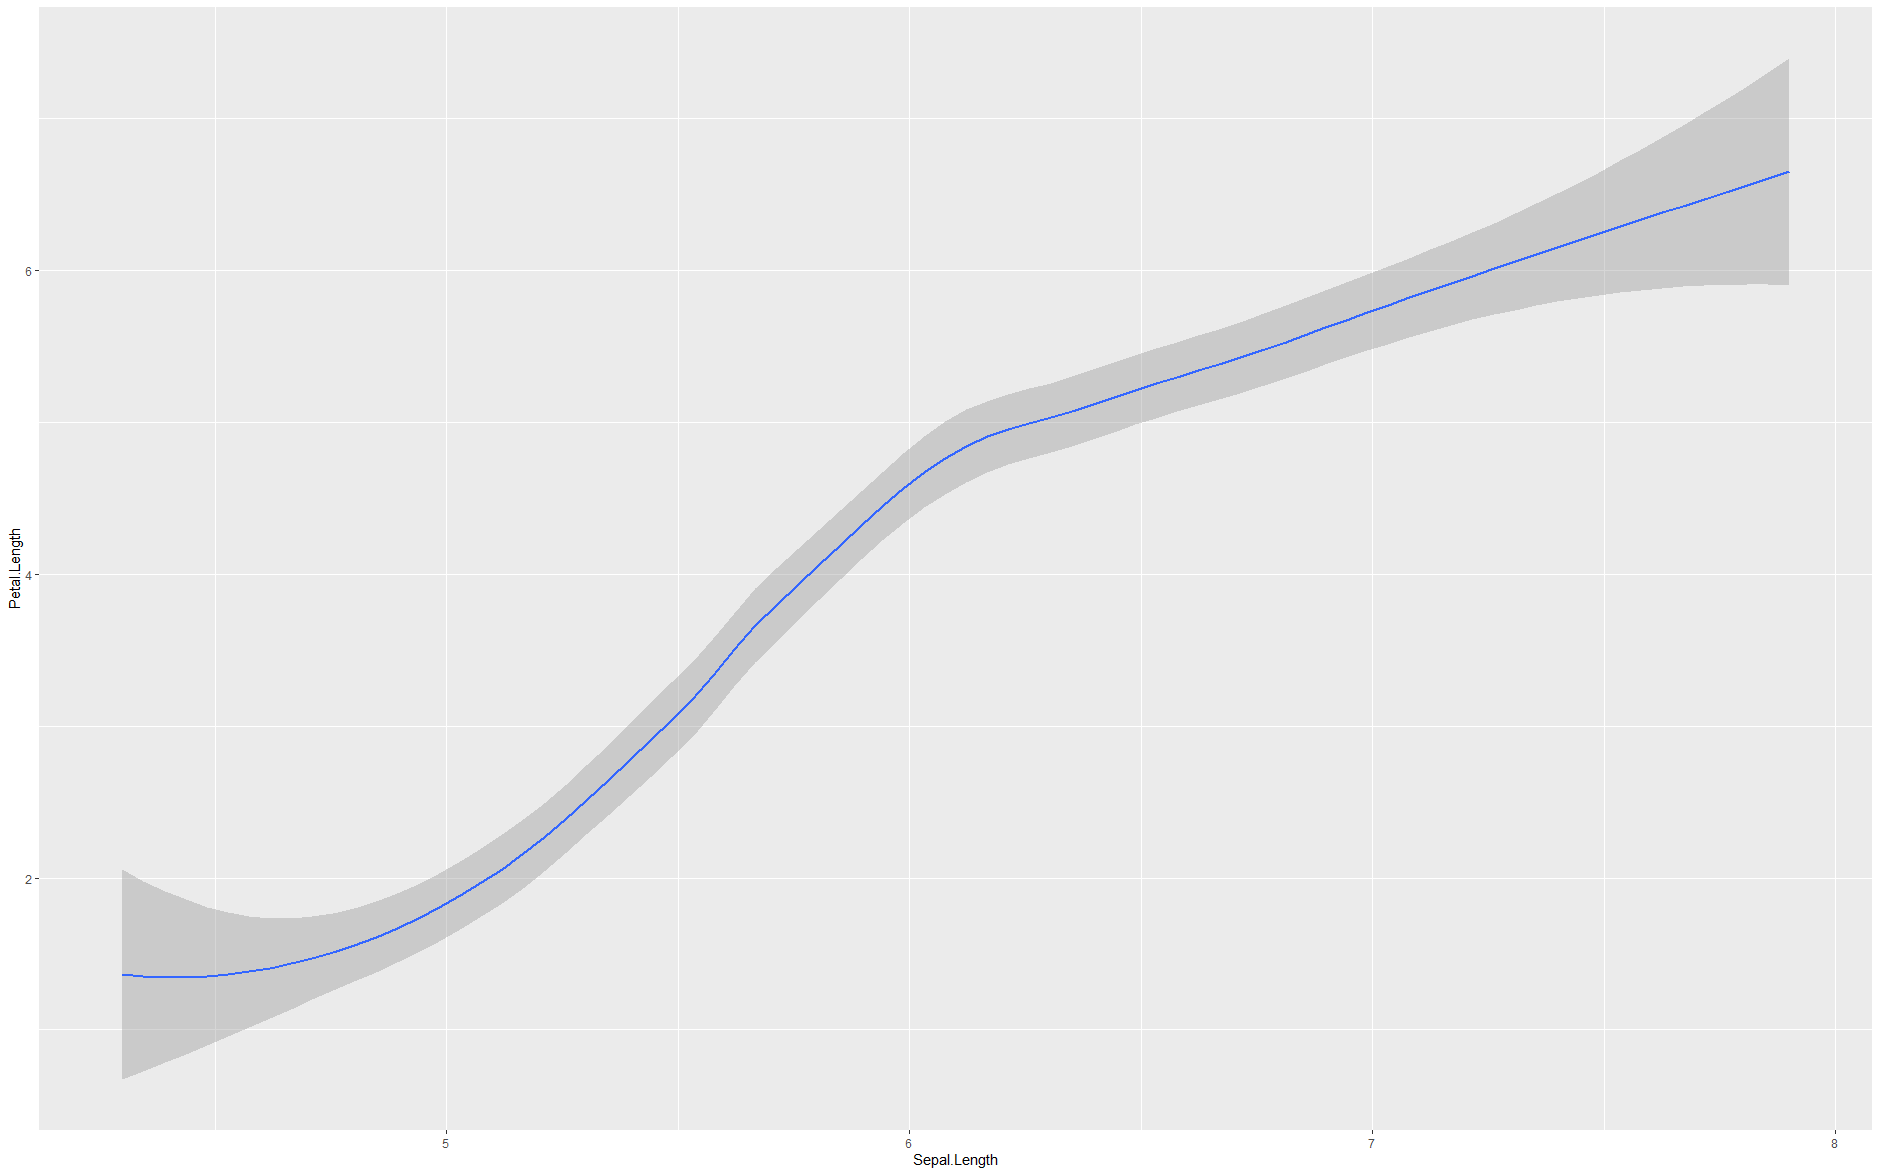
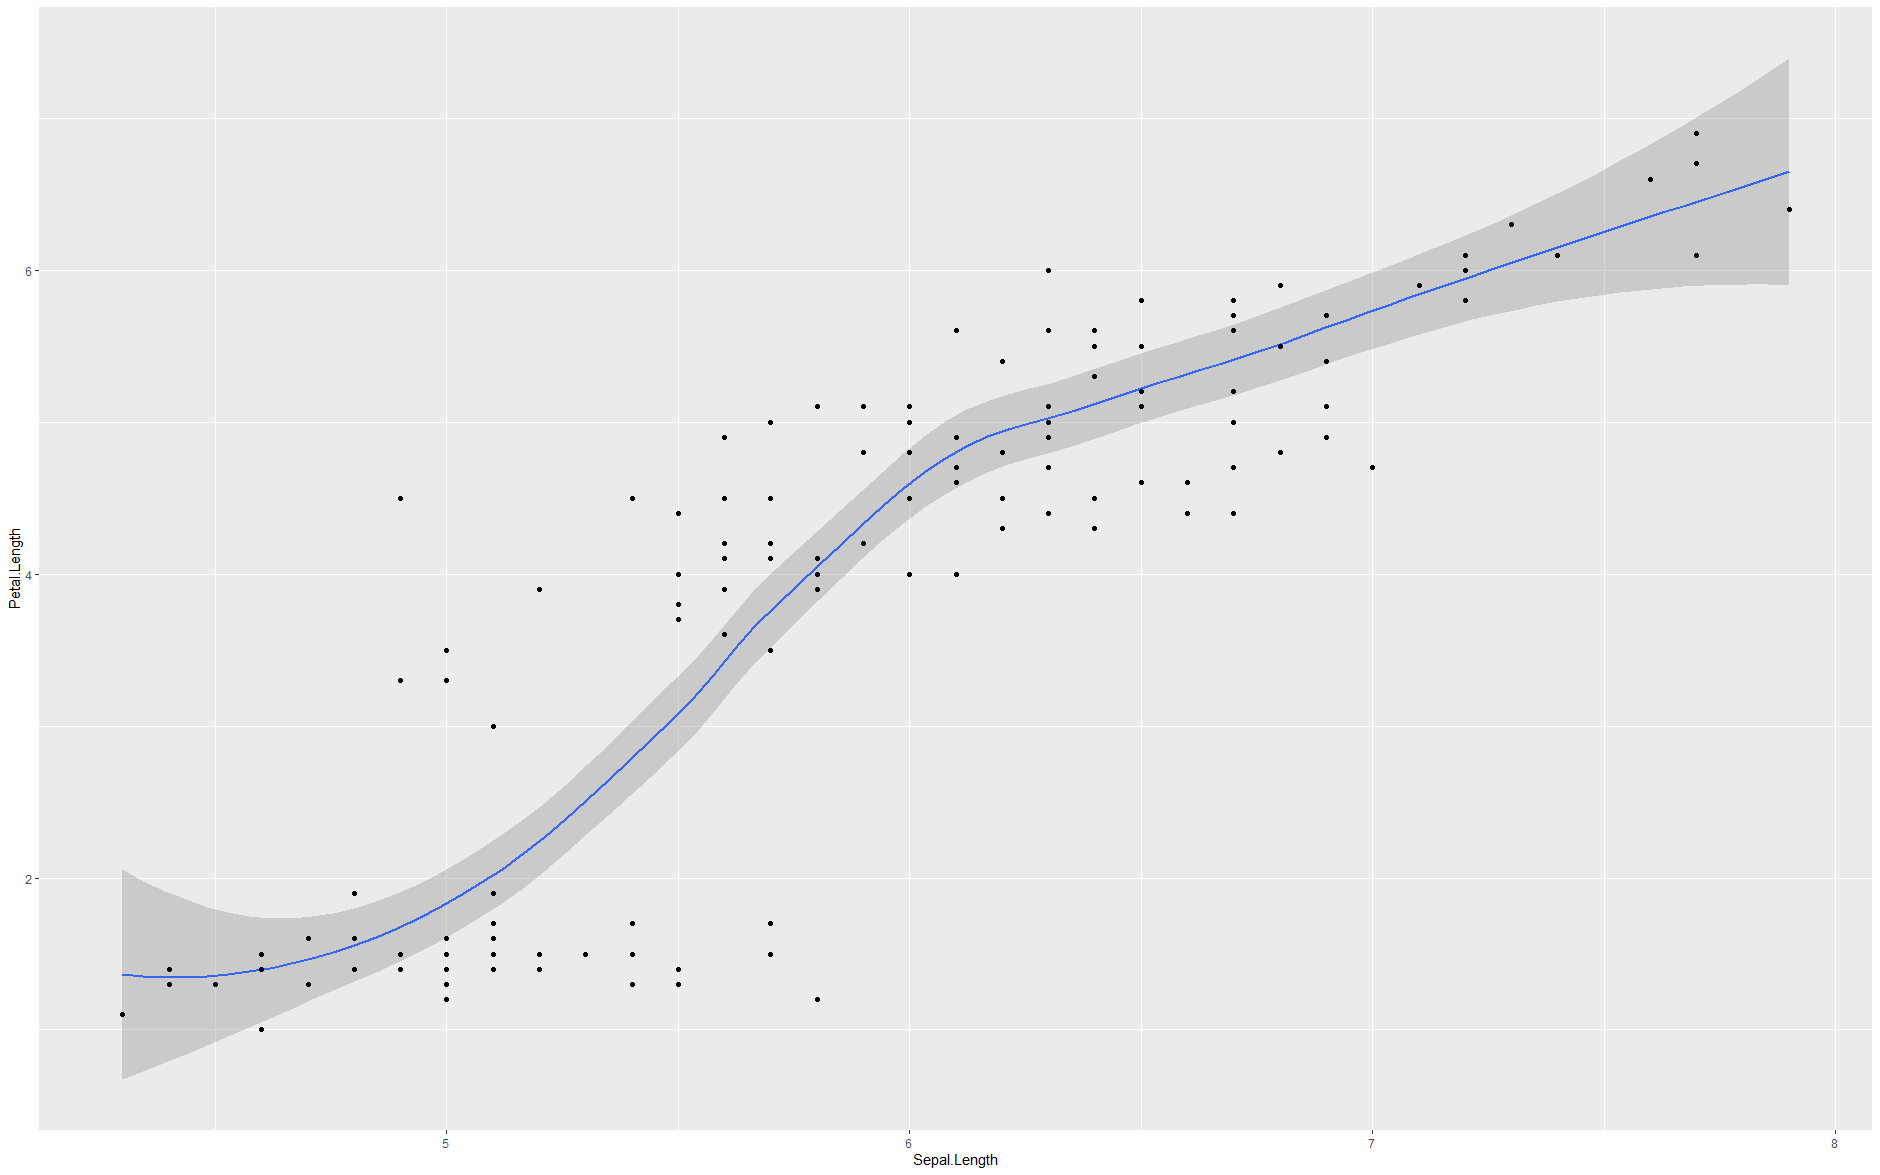
## 图层1ggplot(data = iris)+geom_smooth(mapping = aes(x = Sepal.Length, y = Petal.Length))
## 图层2ggplot(data = iris)+geom_point(mapping = aes(x = Sepal.Length, y = Petal.Length))
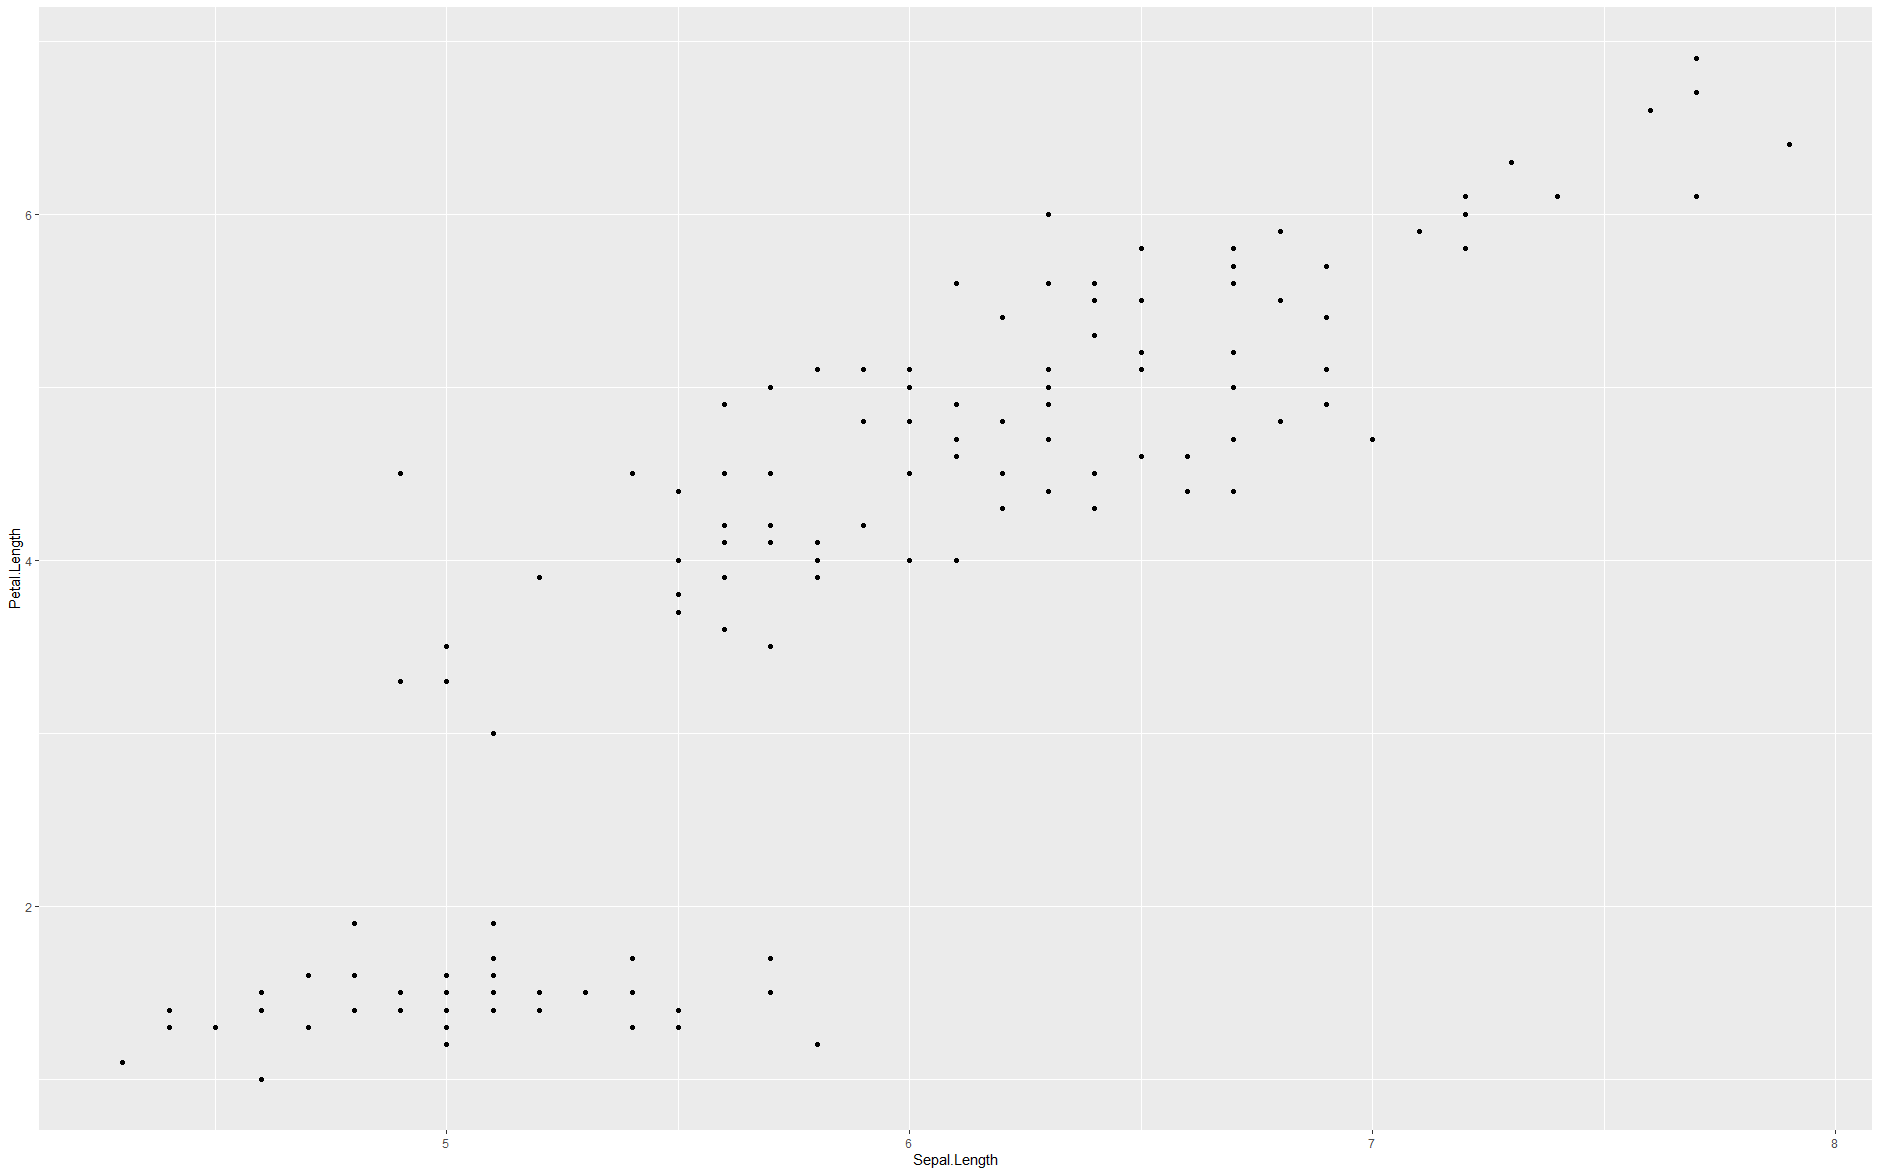
## 叠加ggplot(data = iris)+geom_smooth(mapping = aes(x = Sepal.Length, y = Petal.Length))+geom_point(mapping = aes(x = Sepal.Length, y = Petal.Length))

注意局部与全局的差别
函数内的是局部,改变仅限于函数内;外面则是全局。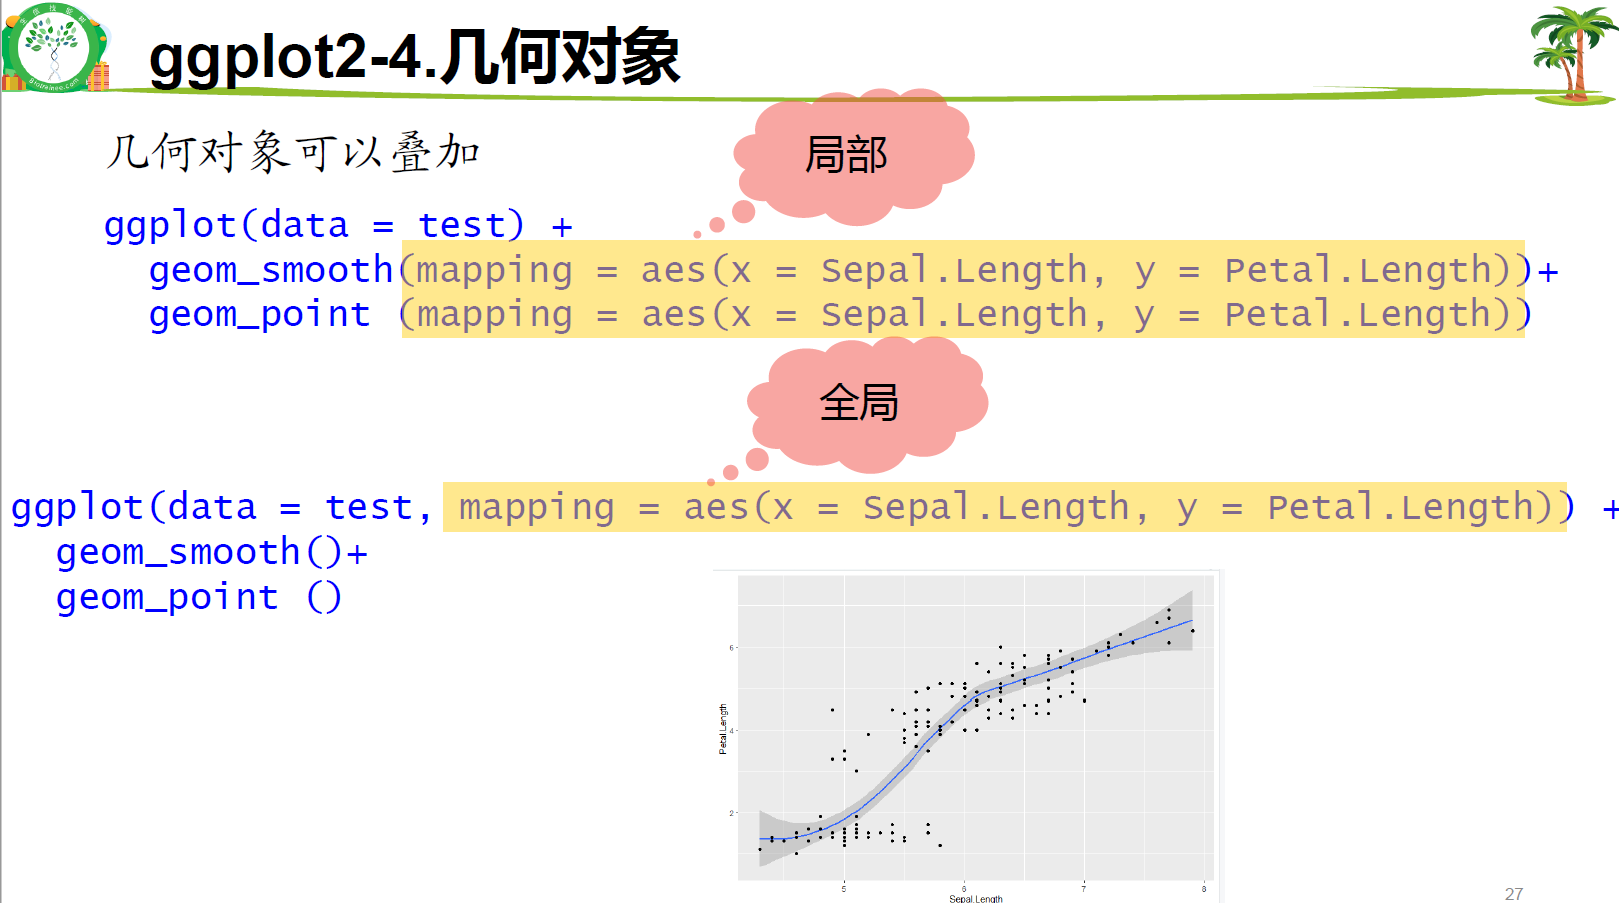
位置和坐标系
位置
主要理解geom_point()和geom_jitter()的区别。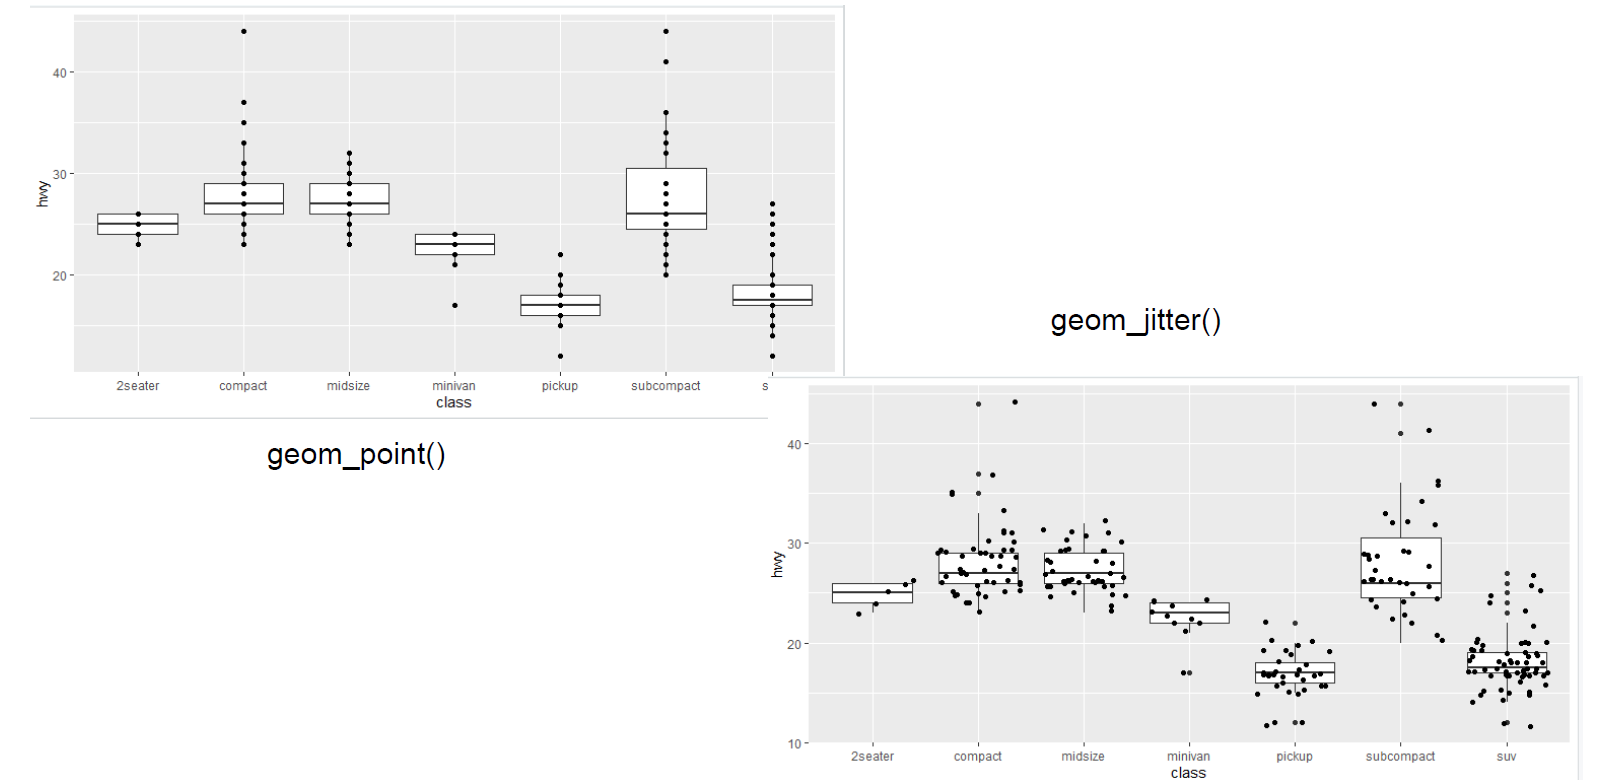
坐标系
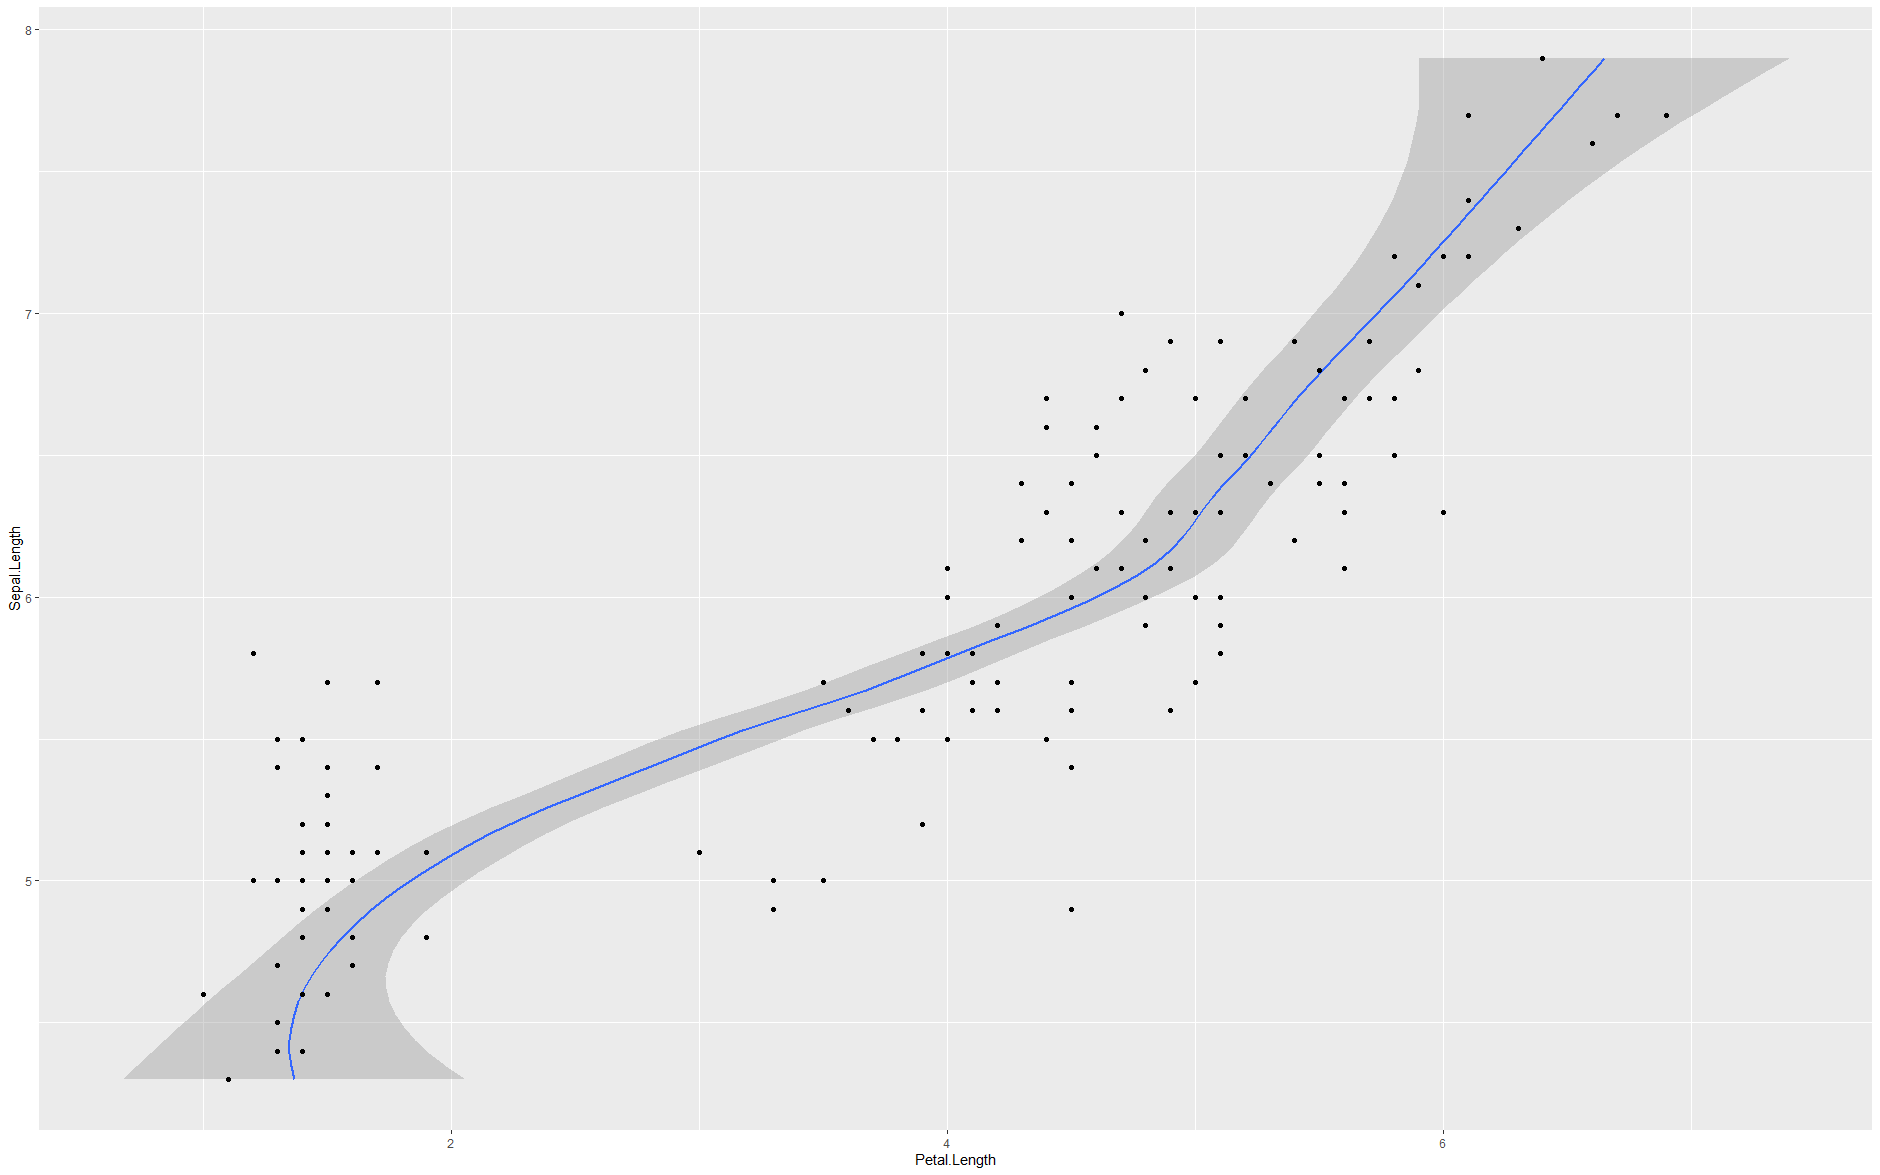
翻转坐标系
ggplot(data = iris)+geom_smooth(mapping = aes(x = Sepal.Length, y = Petal.Length))+geom_point(mapping = aes(x = Sepal.Length, y = Petal.Length))
## 反转坐标系ggplot(data = iris)+geom_smooth(mapping = aes(x = Sepal.Length, y = Petal.Length))+geom_point(mapping = aes(x = Sepal.Length, y = Petal.Length))+coord_flip()
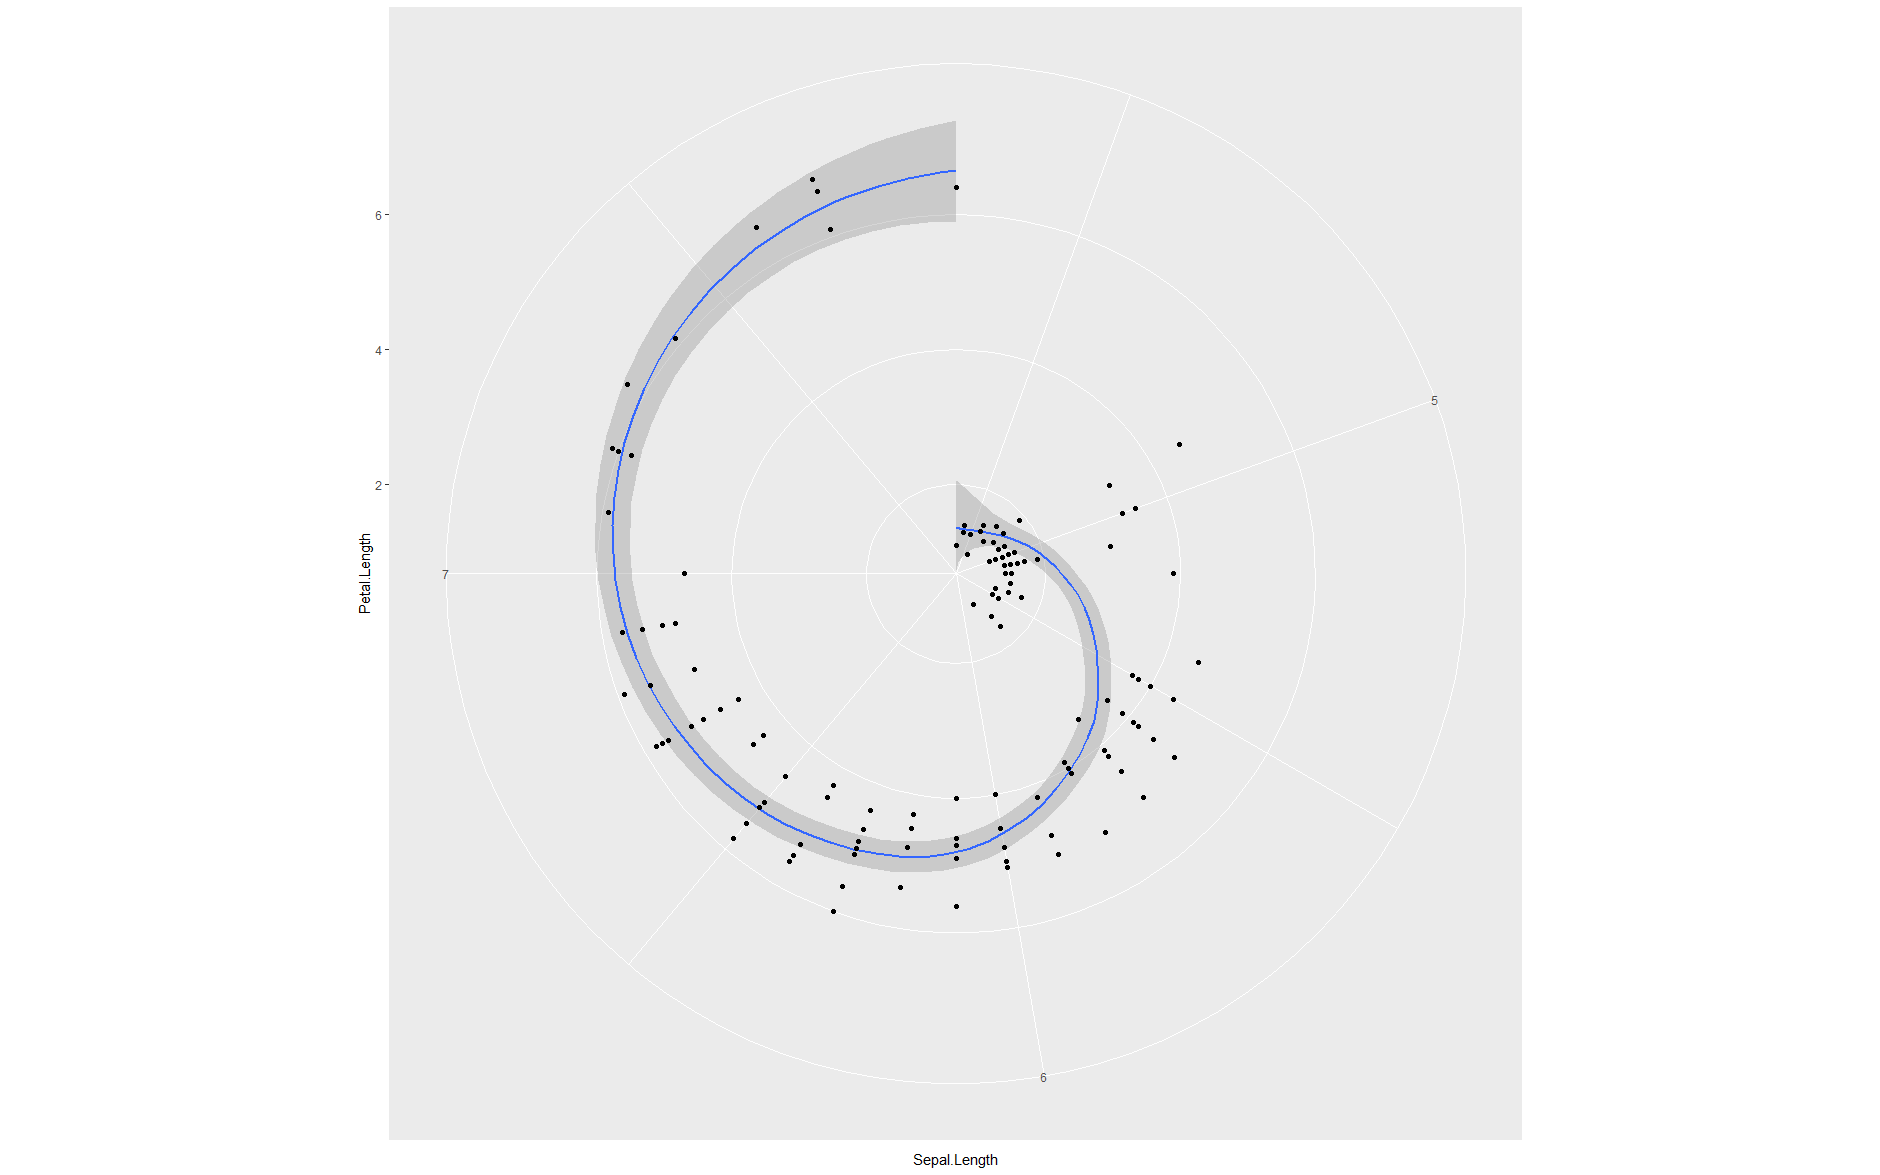
极坐标系
ggplot(data = iris)+geom_smooth(mapping = aes(x = Sepal.Length, y = Petal.Length))+geom_point(mapping = aes(x = Sepal.Length, y = Petal.Length))

## 极坐标系ggplot(data = iris)+geom_smooth(mapping = aes(x = Sepal.Length, y = Petal.Length))+geom_point(mapping = aes(x = Sepal.Length, y = Petal.Length))+coord_polar()
完整绘图模板
ggplot(data = <DATA>)+<GEOM_FUNCTION>(mapping = aes(<MAPPINGS>),sata = <STAT>,position = <POSITION>) +<COORDINATE_FUNCTION> +<FACET_FUNCTION>
ggbubr
图层叠加
如:
## 做点图ggscatter(iris,x="Sepal.Length",y="Petal.Length",color="Species")
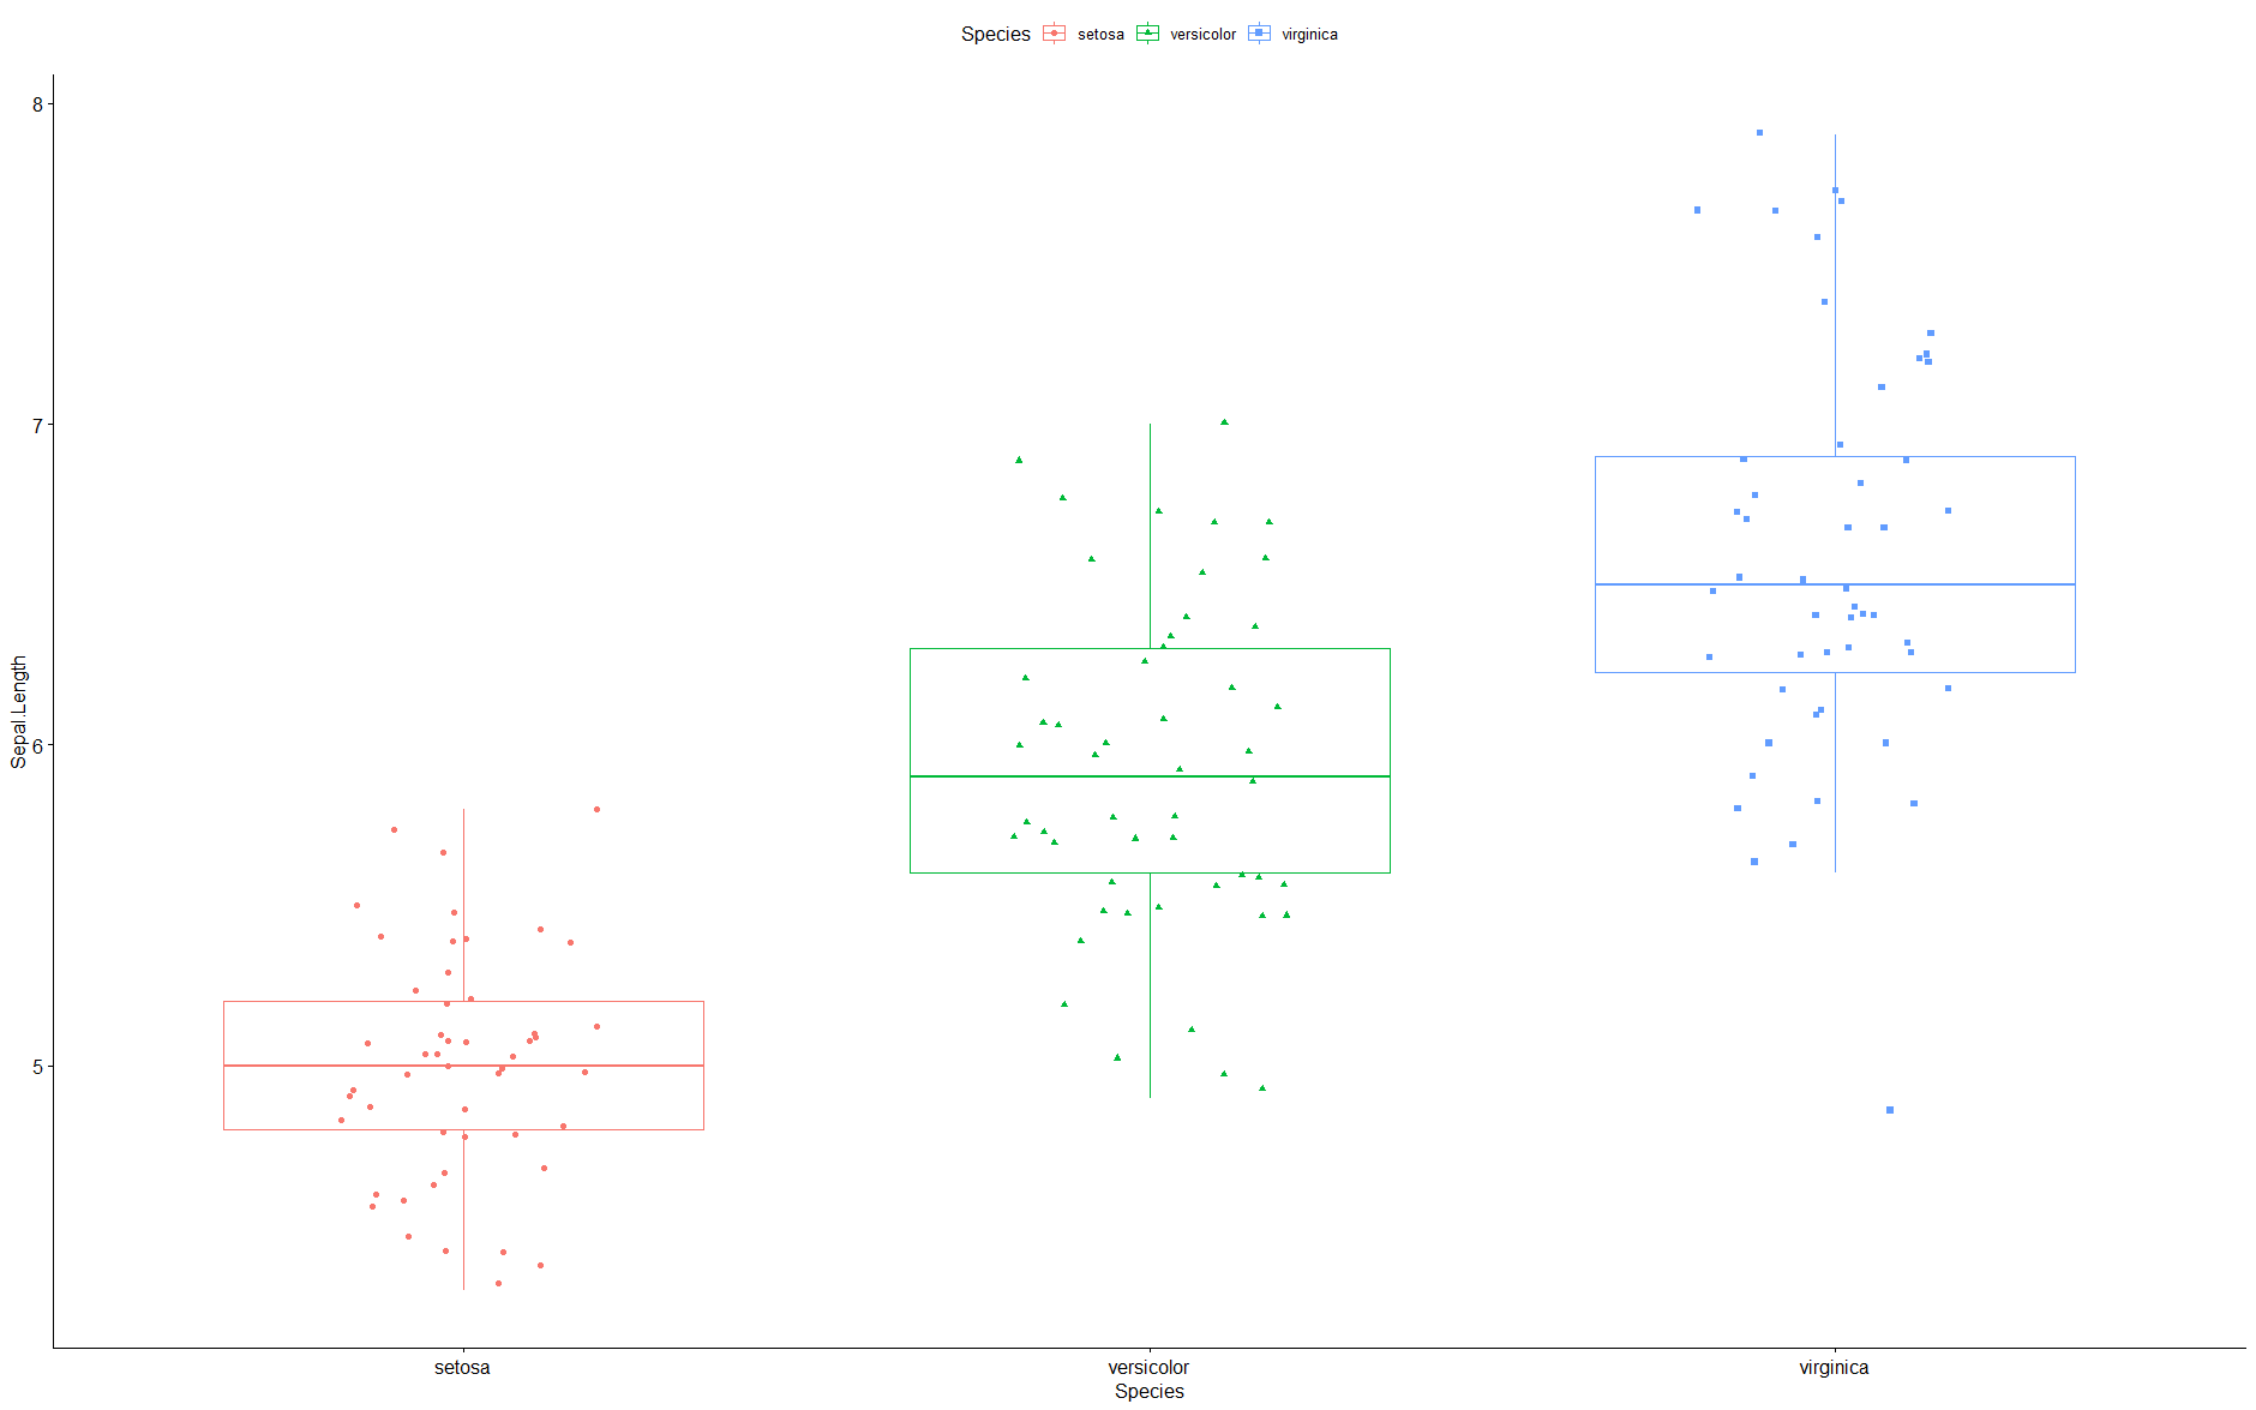
## 箱线图上增加点图ggboxplot(iris,x = "Species",y = "Sepal.Length",color = "Species",shape = "Species",add = "jitter")
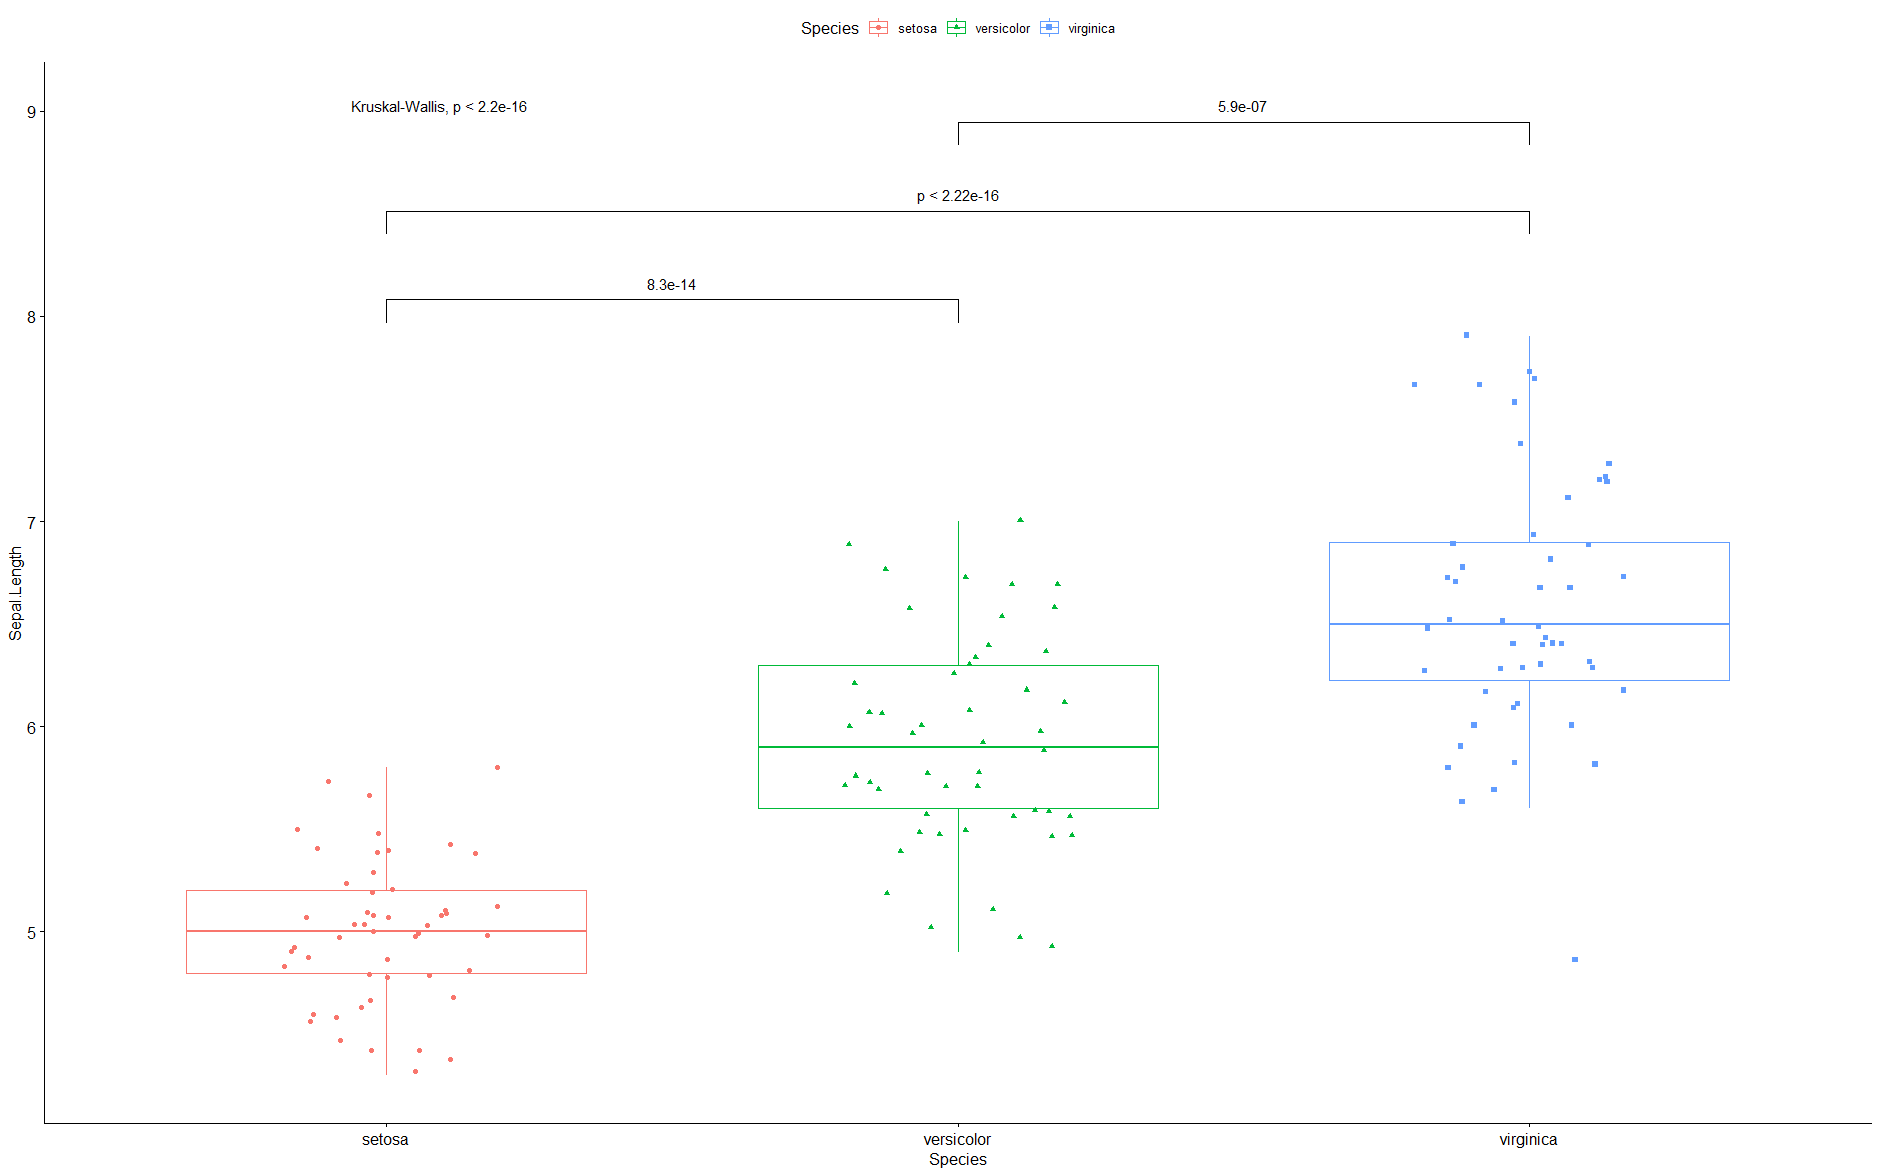
添加p值
分为三步:箱线图命名+设置比较组别+stat_compare_means()函数计算
p = ggboxplot(iris,x = "Species",y = "Sepal.Length",color = "Species",shape = "Species",add = "jitter")my_comparisons = list(c("setosa","versicolor"),c("setosa","virginica"),c("versicolor","virginica"))p + stat_compare_means(comparisons = my_comparisons)+stat_compare_means(label.y = 9)
图片的导出和保存
ggplot2系列
## 保存画板图片ggsave("iris_box_ggpubr.png")## 命名图片保存ggsave(p, filename = "iris_box_ggpubr2.png")
pdf系列
三段论格式
pdf(test.pdf) ##新建pdf... ##绘图代码dev.off ##关闭画板
eoffice
topptx(p, "iris_box_ggpubr.pptx")
拼图
patchwork
详见
https://mp.weixin.qq.com/s/p7LLLvzR5LPgHhuRGhYQBQ
参考材料:

若有收获,就点个赞吧
0 人点赞
