1.使用sklearn构建完整的回归项目
1.1 收集数据集并选择合适的特征
1.2 选择度量模型性能的指标
1.3 选择具体的模型并进行训练
1.4 优化基础模型
1.5 对模型超参数进行调优(Hyper Parameter Tuning)
2. 使用sklearn构建完整的分类项目
2.1 收集数据集并选择合适的特征
2.2 选择度量模型性能的指标
2.3 选择具体的模型进行训练
2.4 评估模型的性能并调参
更详细的可以查看笔者的知乎:https://zhuanlan.zhihu.com/p/140040705
from sklearn import datasetsimport pandas as pdiris = datasets.load_iris()X = iris.datay = iris.targetfeature = iris.feature_namesdata = pd.DataFrame(X,columns=feature)data['target'] = y
2.4.1 使用网格搜索进行超参数调优
方式1:网格搜索GridSearchCV()
from sklearn.pipeline import make_pipelinefrom sklearn.preprocessing import StandardScalerfrom sklearn.model_selection import GridSearchCVfrom sklearn.svm import SVCimport timestart_time = time.time()pipe_svc = make_pipeline(StandardScaler(),SVC(random_state=1))param_range = [0.0001,0.001,0.01,0.1,1.0,10.0,100.0,1000.0]param_grid = [{'svc__C':param_range,'svc__kernel':['linear']},{'svc__C':param_range,'svc__gamma':param_range,'svc__kernel':['rbf']}]gs = GridSearchCV(estimator=pipe_svc,param_grid=param_grid,scoring='accuracy',cv=10,n_jobs=-1)gs = gs.fit(X,y)end_time = time.time()print("网格搜索经历时间:%.3f S" % float(end_time-start_time))print(gs.best_score_)print(gs.best_params_)
网格搜索经历时间:4.282 S 0.98 {‘svcC’: 1.0, ‘svcgamma’: 0.1, ‘svc__kernel’: ‘rbf’}
方式2:随机网格搜索RandomizedSearchCV()
from sklearn.model_selection import RandomizedSearchCVfrom sklearn.svm import SVCimport timestart_time = time.time()pipe_svc = make_pipeline(StandardScaler(),SVC(random_state=1))param_range = [0.0001,0.001,0.01,0.1,1.0,10.0,100.0,1000.0]param_grid = [{'svc__C':param_range,'svc__kernel':['linear']},{'svc__C':param_range,'svc__gamma':param_range,'svc__kernel':['rbf']}]# param_grid = [{'svc__C':param_range,'svc__kernel':['linear','rbf'],'svc__gamma':param_range}]gs = RandomizedSearchCV(estimator=pipe_svc, param_distributions=param_grid,scoring='accuracy',cv=10,n_jobs=-1)gs = gs.fit(X,y)end_time = time.time()print("随机网格搜索经历时间:%.3f S" % float(end_time-start_time))print(gs.best_score_)print(gs.best_params_)
随机网格搜索经历时间:0.315 S 0.9600000000000002 {‘svckernel’: ‘rbf’, ‘svcgamma’: 0.1, ‘svc__C’: 100.0}
这里遇到一个小坑,在使用scikit-learn的v0.21版本时,RandomizedSearchCV的param_distributions只支持dict类型,如果传入上面的list of dicts的数据会报错。在更新到v0.24.1后解决了。
!pip install --upgrade scikit-learn
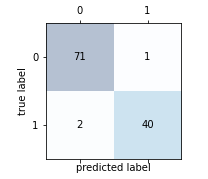
绘制混淆矩阵
# 加载数据df = pd.read_csv("http://archive.ics.uci.edu/ml/machine-learning-databases/breast-cancer-wisconsin/wdbc.data",header=None)'''乳腺癌数据集:569个恶性和良性肿瘤细胞的样本,M为恶性,B为良性'''# 做基本的数据预处理from sklearn.preprocessing import LabelEncoderimport matplotlib.pyplot as plt%matplotlib inlineX = df.iloc[:,2:].valuesy = df.iloc[:,1].valuesle = LabelEncoder() #将M-B等字符串编码成计算机能识别的0-1y = le.fit_transform(y)le.transform(['M','B'])# 数据切分8:2from sklearn.model_selection import train_test_splitX_train,X_test,y_train,y_test = train_test_split(X,y,test_size=0.2,stratify=y,random_state=1)from sklearn.svm import SVCpipe_svc = make_pipeline(StandardScaler(),SVC(random_state=1))from sklearn.metrics import confusion_matrixpipe_svc.fit(X_train,y_train)y_pred = pipe_svc.predict(X_test)confmat = confusion_matrix(y_true=y_test,y_pred=y_pred)fig,ax = plt.subplots(figsize=(2.5,2.5))ax.matshow(confmat, cmap=plt.cm.Blues,alpha=0.3)for i in range(confmat.shape[0]):for j in range(confmat.shape[1]):ax.text(x=j,y=i,s=confmat[i,j],va='center',ha='center')plt.xlabel('predicted label')plt.ylabel('true label')plt.show()
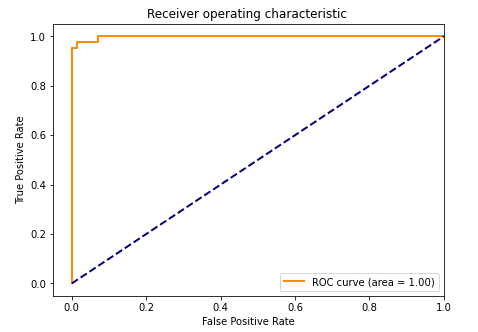
绘制ROC曲线:
from sklearn.metrics import roc_curve,auc
from sklearn.metrics import make_scorer,f1_score


scorer = make_scorer(f1_score,pos_label=0)
gs = GridSearchCV(estimator=pipe_svc,param_grid=param_grid,scoring=scorer,cv=10)
y_pred = gs.fit(X_train,y_train).decision_function(X_test)
#y_pred = gs.predict(X_test)
fpr,tpr,threshold = roc_curve(y_test, y_pred)  # 计算真阳率和假阳率
roc_auc = auc(fpr,tpr)  # 计算auc的值
plt.figure()
lw = 2
plt.figure(figsize=(7,5))
plt.plot(fpr, tpr, color='darkorange',
         lw=lw, label='ROC curve (area = %0.2f)' % roc_auc) ###假阳率为横坐标,真阳率为纵坐标做曲线
plt.plot([0, 1], [0, 1], color='navy', lw=lw, linestyle='--')
plt.xlim([-0.05, 1.0])
plt.ylim([-0.05, 1.05])
plt.xlabel('False Positive Rate')
plt.ylabel('True Positive Rate')
plt.title('Receiver operating characteristic ')
plt.legend(loc="lower right")
plt.show()
3. 结语
本章中,我们重点讨论了各种回归和分类算法的具体推导与简单应用,并且给出了如何使用sklearn这个强大的python工具库进行简单的机器学习模型的建模代码。本章的重点是各个基础算法的掌握,包括回归和分类(重点是分类)算法以及怎么用网格搜索以及其他搜索方式进行调参。简单模型在进行复杂项目的时候往往显得力不从心,那么在下一章中,我们将开始本次开源项目的主题——集成学习,我们着重讨论如何将本章所学的基础模型进行集成,变成功能更加强大的集成模型。
为了巩固本章的理解,在这里给个小任务,大家结合sklearn的fetch_lfw_people数据集,进行一次实战。fetch_lfw_people数据集是一个图像数据集,详细内容可以参照:
https://scikit-learn.org/stable/modules/generated/sklearn.datasets.fetch_lfw_people.html
案例的内容是对图像进行识别并分类。
参考资料:
https://blog.csdn.net/cwlseu/article/details/52356665
https://blog.csdn.net/jasonzhoujx/article/details/81905923
本笔记基于Datawhale开源内容整理 https://github.com/datawhalechina/team-learning-data-mining/tree/master/EnsembleLearning
4. 在sklearn中使用人脸识别数据集进行预测的实例
4.1 准备数据集
参考文档:
(1)调用 fetch_lfw_people() 函数下载
from sklearn import datasets


faces =  datasets.fetch_lfw_people()
EOFError Traceback (most recent call last)
in 1 from sklearn import datasets 2
——> 3 faces = datasets.fetch_lfw_people() … … EOFError: Compressed file ended before the end-of-stream marker was reached
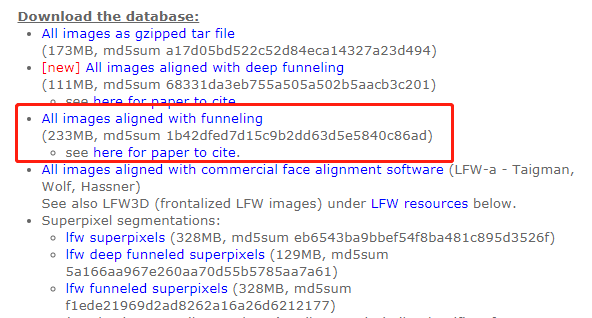
(2)如果下载出现上面的 EOFError 报错,可以手动下载数据包,再进行解压。
用于人脸识别的fetch_lfw_people数据集下载链接:
步骤①: 先检查系统盘的用户目录下,有没有 scikit_learn_data 文件夹,以及该文件夹里面有这几个文件。如果没有该文件夹的话,重新运行(1)的代码,或者使用文件搜索功能,搜索一下是否在其他路径里。
路径为:C:\Users\你的用户名\scikit_learn_data\lfw_home
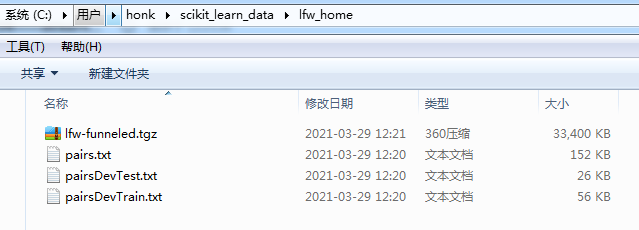
如果没有找到这个文件夹的话,也可以使用参数 data_home 将文件下载到指定存放的目录。运行以下代码十几秒后再强制停止。
faces = datasets.fetch_lfw_people(data_home="E:\\scikit_learn_data\\")
同样查看目录下面是不是有这几个文件
步骤②:将目录中的 原来的lfw-funneled.tgz 删除,拷贝前面手动下载的 lfw-funneled.tgz 数据集放到目录中。
步骤③:再运行步骤①的代码,进行解压。
faces = datasets.fetch_lfw_people(data_home="E:\\scikit_learn_data\\")

特别注意:如果你是通过sklearn默认的路径(如:“C:\Users\你的用户名\scikit_learn_data\lfw_home”)解压文件的话,直接使用 `datasets.fetch_lfw_people()` 命令就可以读取数据;如果你是手动指定目录(如:“E:\scikit_learn_data\”下载解压的话,下次读取数据集时,也需要手动指定的目录解压的目录。
from sklearn import datasets
import pandas as pd


faces =  datasets.fetch_lfw_people(data_home="E:\\scikit_learn_data\\")  # 指定上面解压的路径

X = faces.data
y = faces.target
# Each row corresponds to a ravelled face image of original size 62 x 47 pixels
# 每行样本是62 x 47像素人脸图像摊平开的数据。
# 即data数据集每个样本有62x47=2914个特征。一共有13233个样本。
X.shape
(13233, 2914)
# images 则表示没有摊平开的 62 x 47像素人脸图像数据
faces.images.shape
(13233, 62, 47)
n_features = X.shape[1]
n_samples, h, w = faces.images.shape

# 人脸id作为待预测标签
target_names = faces.target_names
n_classes = target_names.shape[0]
print("Total dataset size:")
print("n_samples: %d" % n_samples)
print("n_features: %d" % n_features)
print("n_classes: %d" % n_classes)
Total dataset size: n_samples: 13233 n_features: 2914 n_classes: 5749
2种在matplotlib上显示图片的方式
方式①:
from PIL import Image
import numpy as np
import matplotlib.pyplot as plt


plt.gray()  # 只有黑白两色,没有中间的渐进色
plt.matshow(faces.images[0])
# plt.savefig('sample01.jpg')
plt.show()
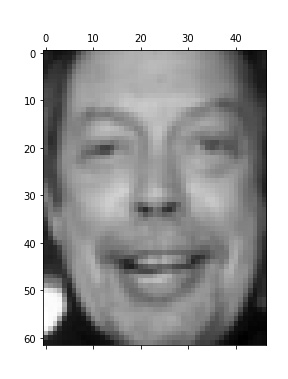
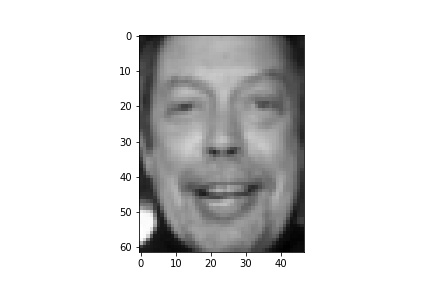
方式②:
plt.imshow(faces.images[0])
# plt.savefig('sample02.jpg')
plt.show()
以下展示4x4共16张人脸图像
fig = plt.figure(figsize=(10, 10))
fig.subplots_adjust(hspace=0.3)
for i in range(16):
    ax = fig.add_subplot(4, 4, i+1, xticks=[], yticks=[])  # 关闭坐标刻度
    ax.imshow(faces.images[i])
    ax.set_title(target_names[i])
# plt.savefig('sample03.jpg')
plt.show()

把数据拆分成训练集和测试集
from sklearn.model_selection import train_test_split


X_train, X_test, y_train, y_test = train_test_split(X, y, test_size=0.25, random_state=2021)
4.2 选择合适的特征
数据集有2914个特征,这里我们使用PCA对齐进行降维,降维后为150个特征。
from sklearn.decomposition import PCA
from time import time

n_components = 150

print("Extracting the top %d eigenfaces from %d faces"
      % (n_components, X_train.shape[0]))
t0 = time()
pca = PCA(n_components=n_components, svd_solver='randomized',
          whiten=True).fit(X_train)
print("done in %0.3fs" % (time() - t0))

eigenfaces = pca.components_.reshape((n_components, h, w))

print("Projecting the input data on the eigenfaces orthonormal basis")
t0 = time()
X_train_pca = pca.transform(X_train)
X_test_pca = pca.transform(X_test)
print("done in %0.3fs" % (time() - t0))
Extracting the top 150 eigenfaces from 9924 faces done in 6.506s Projecting the input data on the eigenfaces orthonormal basis done in 0.628s
4.3 选择模型和超参数调优
这里选用SVM模型,并使用网格搜索对SVM模型进行调优。
由于降维后的数据集仍然比较大,跑下面的网格搜索,需要花费很多时间,对于配置较低的设备,可能跑4个小时也跑不出来结果。可以减少一下数据量,先用少量数据调完参,再用全量数据跑模型。
faces40 = datasets.fetch_lfw_people(min_faces_per_person=40)
X = faces40.data
y = faces40.target
n_features = X.shape[1]
n_samples, h, w = faces40.images.shape

# 人脸id作为待预测标签
target_names = faces40.target_names
n_classes = target_names.shape[0]
print("Total dataset size:")
print("n_samples: %d" % n_samples)
print("n_features: %d" % n_features)
print("n_classes: %d" % n_classes)
Total dataset size: n_samples: 1867 n_features: 2914 n_classes: 19
X_train, X_test, y_train, y_test = train_test_split(X, y, test_size=0.25, random_state=2021)

n_components = 150

print("Extracting the top %d eigenfaces from %d faces"
      % (n_components, X_train.shape[0]))
t0 = time()
pca = PCA(n_components=n_components, svd_solver='randomized',
          whiten=True).fit(X_train)
print("done in %0.3fs" % (time() - t0))

eigenfaces = pca.components_.reshape((n_components, h, w))

print("Projecting the input data on the eigenfaces orthonormal basis")
t0 = time()
X_train_pca = pca.transform(X_train)
X_test_pca = pca.transform(X_test)
print("done in %0.3fs" % (time() - t0))
Extracting the top 150 eigenfaces from 1400 faces done in 1.158s Projecting the input data on the eigenfaces orthonormal basis done in 0.161s
from sklearn.model_selection import GridSearchCV
from sklearn.svm import SVC


# svm
print("Fitting the classifier to the training set")
t0 = time()
param_grid = {'C': [1e3, 5e3, 1e4, 5e4, 1e5],
              'gamma': [0.0001, 0.0005, 0.001, 0.005, 0.01, 0.1], }
clf = GridSearchCV(
    SVC(kernel='rbf', class_weight='balanced'), param_grid
)
clf = clf.fit(X_train_pca, y_train)
print("done in %0.3fs" % (time() - t0))
print("Best estimator found by grid search:")
print(clf.best_estimator_)
Fitting the classifier to the training set starting…. 1617026276.4015145 done in 24.326s Best estimator found by grid search:
SVC(C=1000.0, class_weight=’balanced’, gamma=0.001)
对测试集进行预测
print("Predicting people's names on the test set")
t0 = time()
y_pred = clf.predict(X_test_pca)
print("done in %0.3fs" % (time() - t0))

print(classification_report(y_test, y_pred, target_names=target_names))
print(confusion_matrix(y_test, y_pred, labels=range(n_classes)))
Predicting people’s names on the test set
done in 0.129s precision recall f1-score support Ariel Sharon 0.60 0.56 0.58 16 Arnold Schwarzenegger 0.50 0.36 0.42 11 Colin Powell 0.65 0.81 0.72 57 Donald Rumsfeld 0.79 0.71 0.75 31 George W Bush 0.75 0.88 0.81 128 Gerhard Schroeder 0.76 0.85 0.80 26 Gloria Macapagal Arroyo 0.91 0.83 0.87 12 Hugo Chavez 0.65 0.62 0.63 21
       Jacques Chirac       0.85      0.69      0.76        16

        Jean Chretien       0.91      0.62      0.74        16

    Jennifer Capriati       0.86      0.55      0.67        11

        John Ashcroft       0.75      0.56      0.64        16

    Junichiro Koizumi       0.88      0.64      0.74        11

           Laura Bush       0.91      0.91      0.91        11

       Lleyton Hewitt       1.00      0.60      0.75        10
Luiz Inacio Lula da Silva 0.75 0.75 0.75 12
      Serena Williams       0.75      0.55      0.63        11

           Tony Blair       0.81      0.73      0.77        41

       Vladimir Putin       0.30      0.30      0.30        10

             accuracy                           0.74       467

            macro avg       0.76      0.66      0.70       467

         weighted avg       0.75      0.74      0.74       467
[[ 9 0 5 0 2 0 0 0 0 0 0 0 0 0 0 0 0 0 0]
[ 1 4 0 0 2 3 0 0 0 0 0 0 0 0 0 0 0 1 0]
[ 1 1 46 1 3 0 0 2 0 0 0 0 0 0 0 0 0 0 3]
[ 0 0 3 22 3 0 0 1 0 0 0 0 0 0 0 0 0 2 0]
[ 2 0 6 1 112 2 0 1 0 0 0 0 0 0 0 2 0 1 1]
[ 0 0 0 1 1 22 1 0 0 0 0 0 0 0 0 0 0 1 0]
[ 0 0 0 0 1 0 10 1 0 0 0 0 0 0 0 0 0 0 0]
[ 0 0 0 0 4 1 0 13 1 0 0 0 0 0 0 1 0 1 0]
[ 1 0 0 1 2 0 0 0 11 0 0 0 0 0 0 0 0 1 0]
[ 0 0 1 2 1 0 0 0 0 10 0 1 0 0 0 0 0 0 1]
[ 0 0 1 0 3 0 0 0 0 0 6 0 0 1 0 0 0 0 0]
[ 0 1 0 0 4 0 0 0 0 1 0 9 1 0 0 0 0 0 0]
[ 0 0 2 0 0 0 0 0 1 0 0 1 7 0 0 0 0 0 0]
[ 0 0 0 0 0 0 0 1 0 0 0 0 0 10 0 0 0 0 0]
[ 0 0 2 0 1 0 0 0 0 0 1 0 0 0 6 0 0 0 0]
[ 0 0 2 0 0 0 0 0 0 0 0 0 0 0 0 9 1 0 0]
[ 0 0 1 0 3 0 0 1 0 0 0 0 0 0 0 0 6 0 0]
[ 1 2 1 0 3 1 0 0 0 0 0 0 0 0 0 0 1 30 2]
[ 0 0 1 0 5 0 0 0 0 0 0 1 0 0 0 0 0 0 3]]
通过可视化,将原标签和预测结果标签进行对比
def plot_gallery(images, titles, h, w, n_row=3, n_col=4):
    """Helper function to plot a gallery of portraits"""
    plt.figure(figsize=(1.8 * n_col, 2.4 * n_row))
    plt.subplots_adjust(bottom=0, left=.01, right=.99, top=.90, hspace=.35)
    for i in range(n_row * n_col):
        plt.subplot(n_row, n_col, i + 1)
        plt.imshow(images[i].reshape((h, w)), cmap=plt.cm.gray)
        plt.title(titles[i], size=12)
        plt.xticks(())
        plt.yticks(())

def title(y_pred, y_test, target_names, i):
    """拼接原标签和预测结果标签 """
    pred_name = target_names[y_pred[i]].rsplit(' ', 1)[-1]
    true_name = target_names[y_test[i]].rsplit(' ', 1)[-1]
    return 'predicted: %s\ntrue:      %s' % (pred_name, true_name)
prediction_titles = [title(y_pred, y_test, target_names, i)
                     for i in range(y_pred.shape[0])]

plot_gallery(X_test, prediction_titles, h, w)  # 原始数据

# plot the gallery of the most significative eigenfaces

eigenface_titles = ["eigenface %d" % i for i in range(eigenfaces.shape[0])]
plot_gallery(eigenfaces, eigenface_titles, h, w)  # 降维后的数据

plt.show()

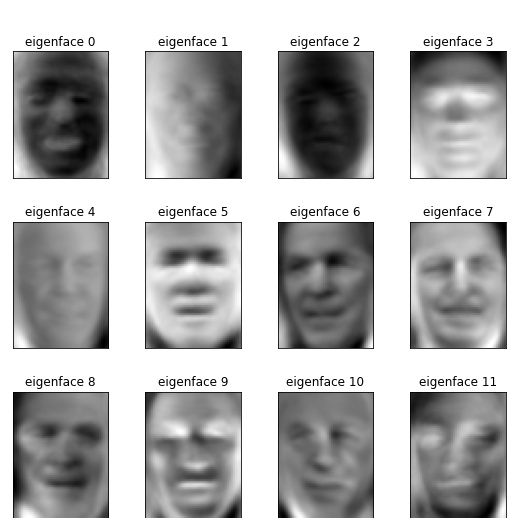
将模型保存到本地。
import pickle


with open('facesModel_%0.3f.pkl'% time(), 'wb') as pkl:
    pickle.dump(clf, pkl, pickle.HIGHEST_PROTOCOL)
    print('Save!')

