1.1 下载mysqld_exporter
[root@mysql-38 src]# cd /usr/local/src/[root@mysql-38 src]# wget https://github.com/prometheus/mysqld_exporter/releases/download/v0.12.1/mysqld_exporter-0.12.1.linux-amd64.tar.gz[root@mysql-38 src]# lsmysqld_exporter-0.12.1.linux-amd64.tar.gz
1.2 解压exporter
[root@mysql-38 src]# tar xf mysqld_exporter-0.12.1.linux-amd64.tar.gz[root@mysql-38 src]# mv mysqld_exporter-0.12.1.linux-amd64 ../[root@mysql-38 src]# cd ..[root@mysql-38 local]# mv mysqld_exporter-0.12.1.linux-amd64/ mysqld_exporter
1.3 创建mysql用户,并授予权限
因为mysql_exporter需要连接到mysql,所以需要创建mysql用户监控mysql数据库,并赋予权限
# mysql -uroot -p123456> create user 'exporter'@'%' identified by '123456';> GRANT REPLICATION CLIENT, PROCESS ON *.* TO 'exporter'@'%';> GRANT SELECT ON performance_schema.* TO 'exporter'@'%';> ALTER USER exporter@'%' IDENTIFIED WITH mysql_native_password BY '123456';> flush privileges;
1.4 创建.my.cnf
[root@mysql-38 mysqld_exporter]# vim .my.cnf[client]user=exporter #创建的mysql用户password=123456 #用户密码
1.5 把exporter设置为系统程序
[root@mysql-38 local]# vim /etc/systemd/system/mysqld_exporter.service[Unit]Description=mysqld_exporterDocumentation=https://prometheus.io/After=network.target[Service]Type=simpleExecStart=/usr/local/mysqld_exporter/mysqld_exporter --config.my-cnf=/usr/local/mysqld_exporter/.my.cnfRestart=on-failure[Install]WantedBy=multi-user.target[root@mysql-38 local]# systemctl daemon-reload[root@mysql-38 local]# systemctl enable mysqld_exporter[root@mysql-38 local]# systemctl start mysqld_exporter[root@mysql-38 mysqld_exporter]# ss -lntp|grep 9104LISTEN 0 128 :::9104 :::* users:(("mysqld_exporter",pid=28564,fd=3))
1.6 配置prometheus
[root@prometheus prometheus]# cd /usr/local/prometheus/[root@prometheus prometheus]# vim prometheus.yml# my global configglobal:scrape_interval: 15s # Set the scrape interval to every 15 seconds. Default is every 1 minute.evaluation_interval: 15s # Evaluate rules every 15 seconds. The default is every 1 minute.# scrape_timeout is set to the global default (10s).# Alertmanager configurationalerting:alertmanagers:- static_configs:- targets:# - alertmanager:9093# Load rules once and periodically evaluate them according to the global 'evaluation_interval'.rule_files:# - "first_rules.yml"# - "second_rules.yml"# A scrape configuration containing exactly one endpoint to scrape:# Here it's Prometheus itself.scrape_configs:# The job name is added as a label `job=<job_name>` to any timeseries scraped from this config.- job_name: 'prometheus'# metrics_path defaults to '/metrics'# scheme defaults to 'http'.static_configs:- targets: ['localhost:9090']- job_name: 'Linux'static_configs:- targets: ['10.4.7.58:9100']#添加下面三行- job_name: 'Mysql'static_configs:- targets: ['10.4.7.38:9104'][root@prometheus prometheus]# systemctl restart prometheus
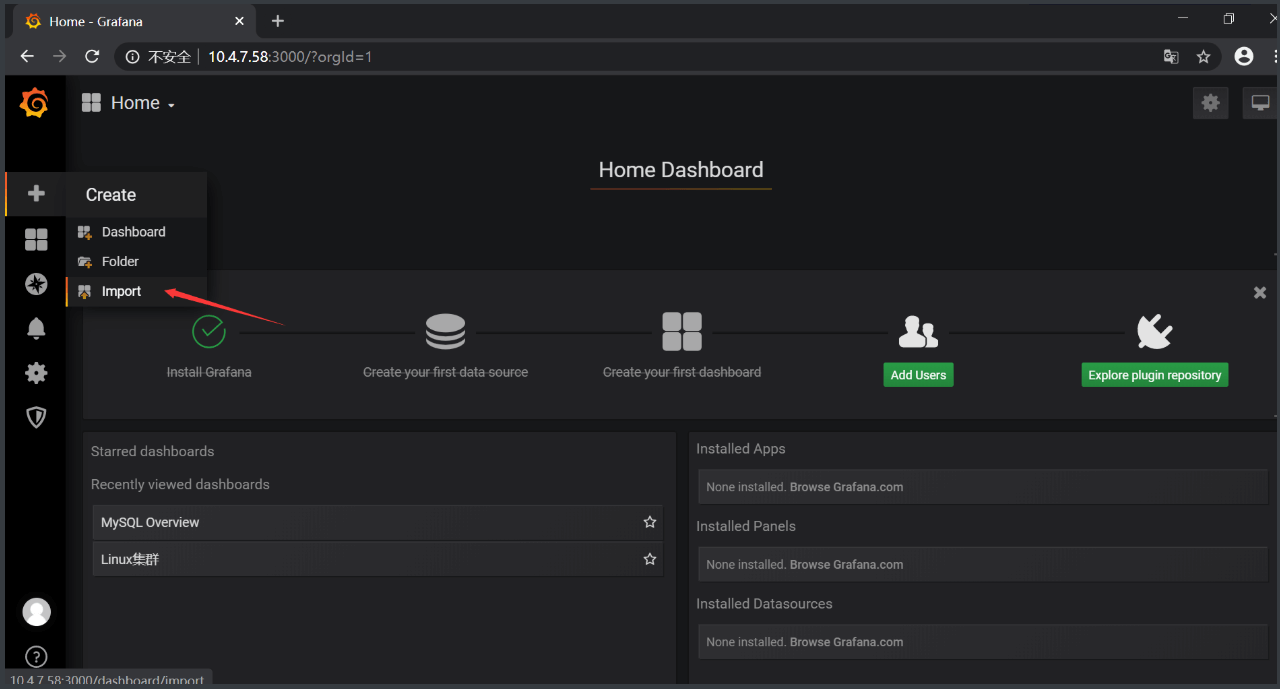
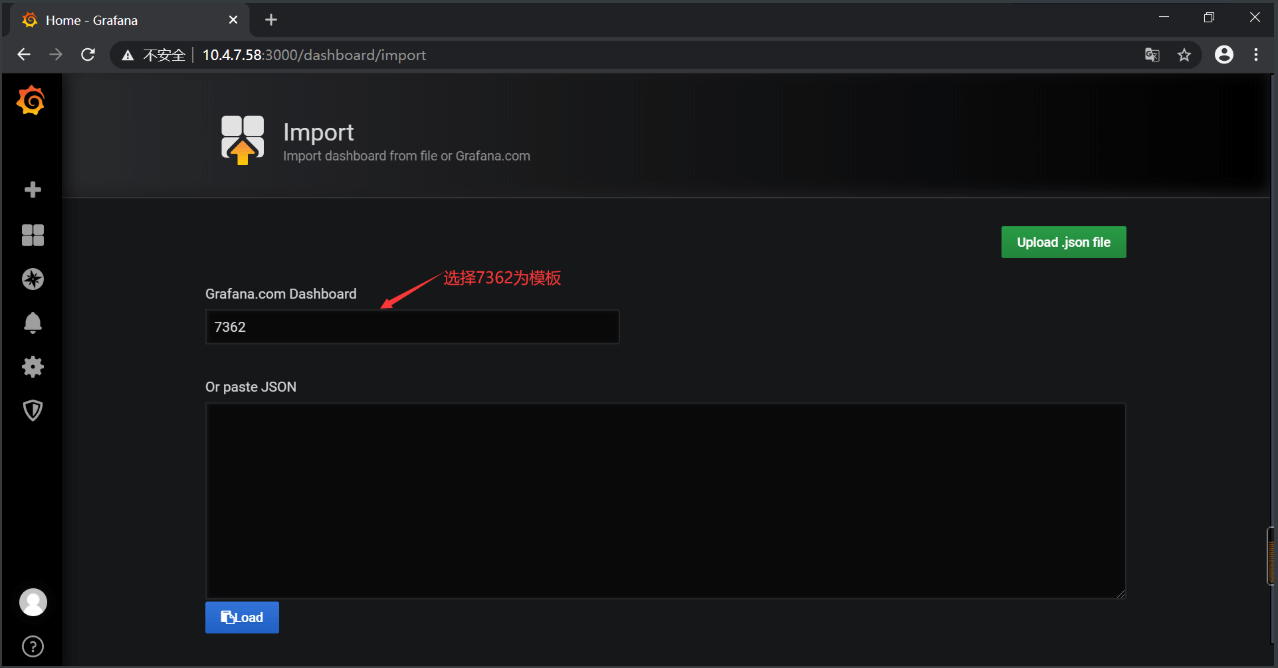
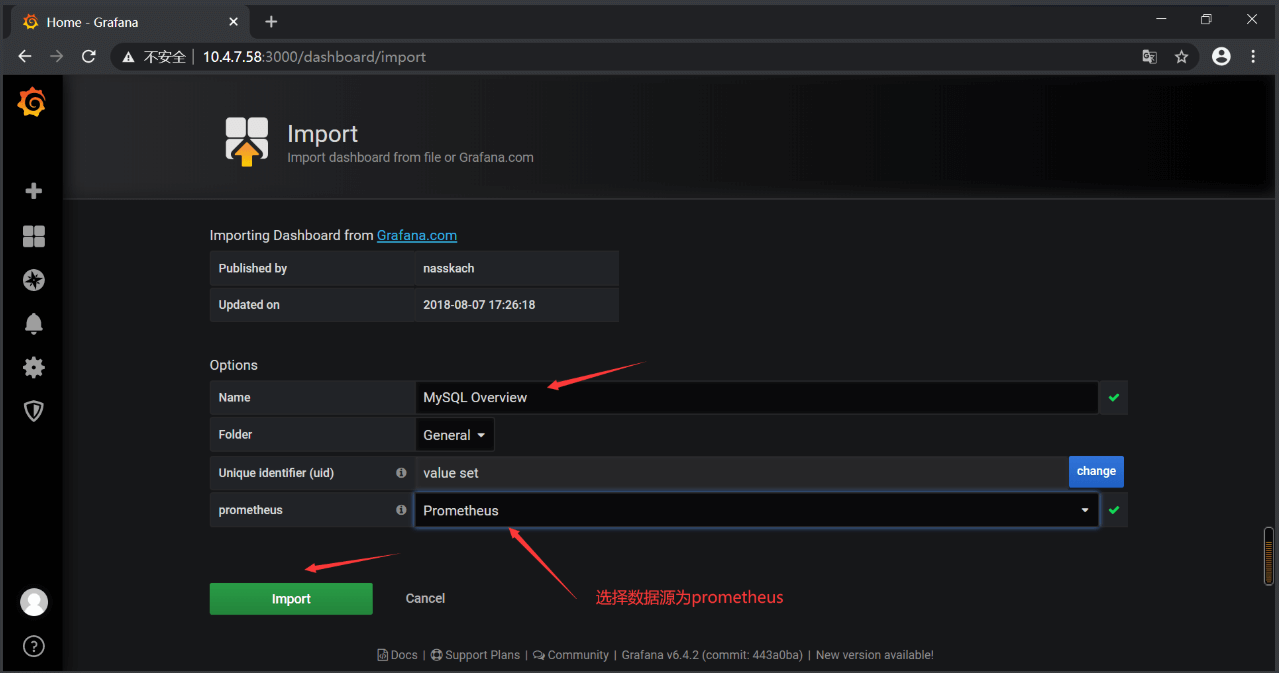
1.7 Grafana监控mysql
最后的结果图: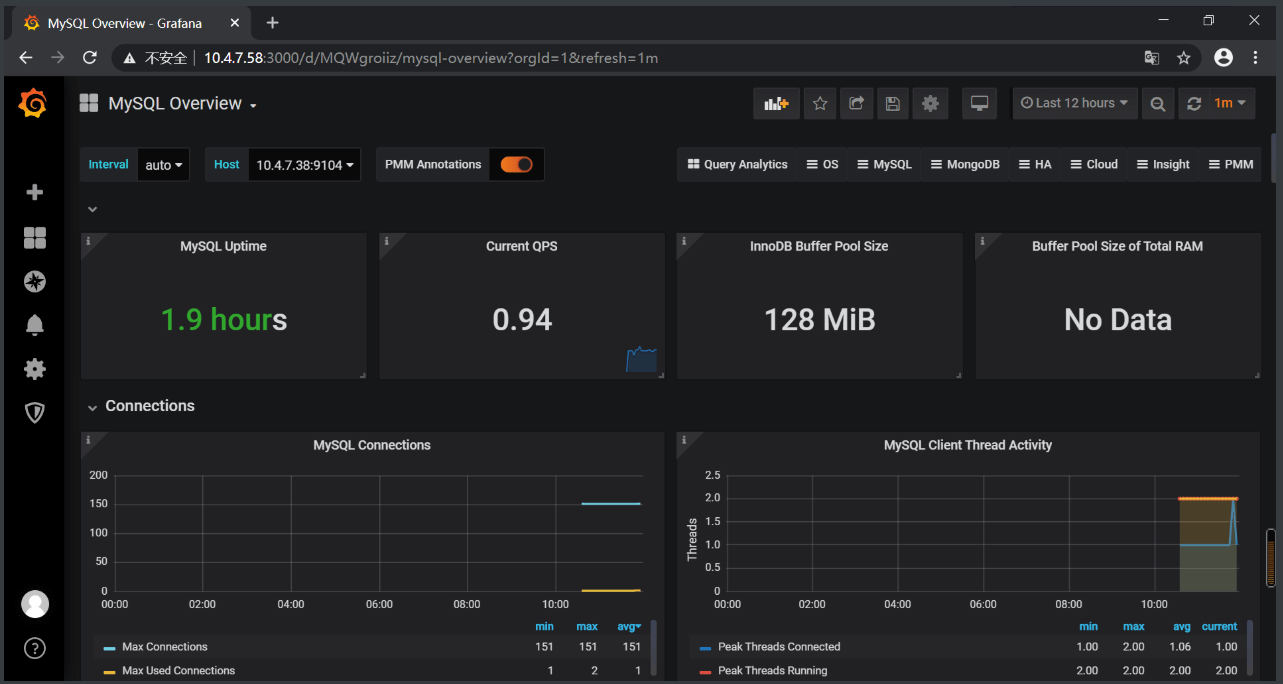

若有收获,就点个赞吧
0 人点赞
