官方版
Examine Web Traffic
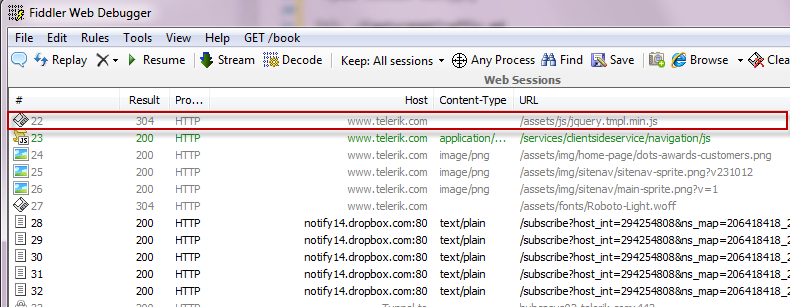
View Web Session Summary
To view the Fiddler ID Number, result code, protocol, hostname, content type, URL, body size, caching value, origin process, custom comments, and any custom columns for a web session:
- Capture web traffic.
Find the web session in the Web Sessions List.
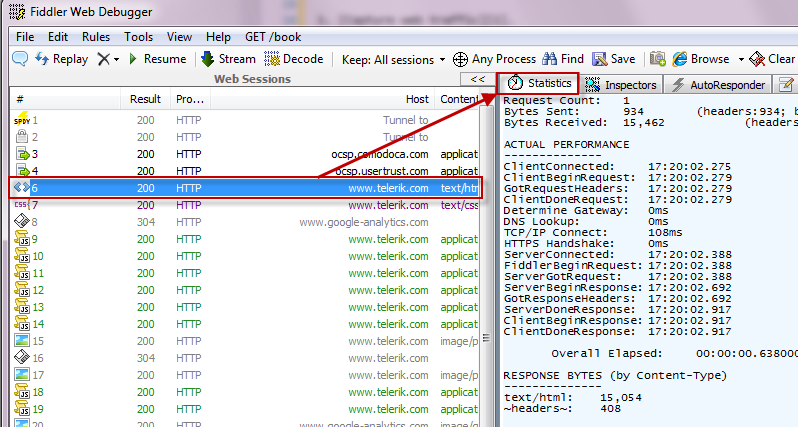
View Web Session Statistics
To view performance statistics for a web sesion:
Click on a web session in the Web Sessions List.
-
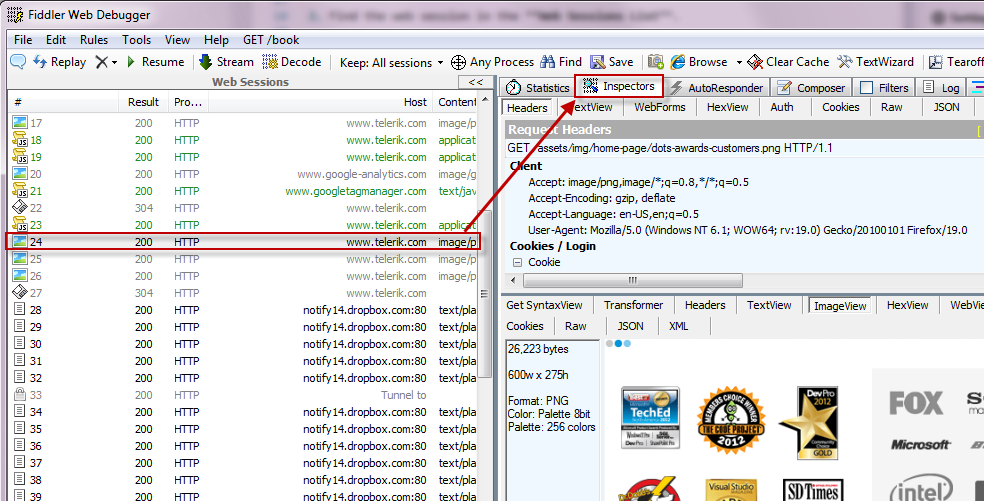
View Web Session Content
To view the content of a web session in a variety of formats:
Click on a web session in the Web Sessions List.
-
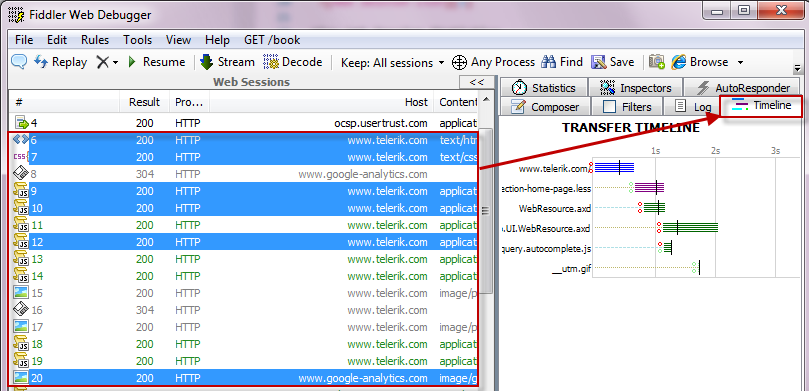
Visualize Sessions Transfer Timeline
To view a waterfall diagram of the transfer timeline for one or more web sessions:
Select one or more web sessions in the Web Sessions List. Hold down the CTRL key and click sessions in the Web Sessions List to select more than one session.
- Click the Timeline tab.
谷歌翻译版
检查Web流量
显示Web会话摘要
要查看Fiddler ID号,状态码,协议,主机名,内容类型,URL,正文大小,缓存值,原始进程,自定义注释以及Web会话的任何自定义列:
- 捕获web流量。
-
显示Web会话统计信息
要查看网络会话的性能统计信息:
在Web会话列表中点击Web会话。
-
显示Web会话内容
要以各种格式查看Web会话的内容:
单击 Web会话列表中的Web会话
-
可视化会话传输时间线
要查看一个或多个Web会话的传输时间轴的瀑布图:
在Web会话列表中选择一个或多个Web会话。 按住CTRL键,然后在Web会话列表中单击会话以选择多个会话。
- 点击 Timeline 标签。

若有收获,就点个赞吧
0 人点赞
