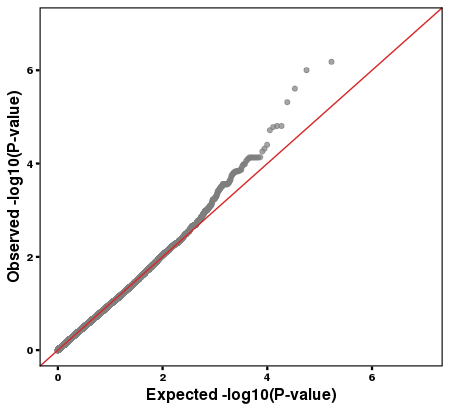
qq plot 是为了检验实际分布与假设分布是否相同。
我的数据来自于plink处理后生成的p值,所以不同的分布根据实际情况修改。
下面函数来自于 qqman 包,可定制性太差,就改下用ggplot2画。
qq = function(pvector, ...) {# Check for sensible inputif (!is.numeric(pvector)) stop("Input must be numeric.")# limit to not missing, not nan, not null, not infinite, between 0 and 1pvector <- pvector[!is.na(pvector) & !is.nan(pvector) & !is.null(pvector) & is.finite(pvector) & pvector<1 & pvector>0]# Observed and expectedo = -log10(sort(pvector,decreasing=FALSE))e = -log10( ppoints(length(pvector) ))# # The old way# plot(e, o, pch=20,# xlab=expression(Expected~~-log[10](italic(p))),# ylab=expression(Observed~~-log[10](italic(p))),# ...)# The new way to initialize the plot.## See http://stackoverflow.com/q/23922130/654296## First, define your default argumentsdef_args <- list(pch=20, xlim=c(0, max(e)), ylim=c(0, max(o)),xlab=expression(Expected~~-log[10](italic(p))),ylab=expression(Observed~~-log[10](italic(p))))## Next, get a list of ... arguments#dotargs <- as.list(match.call())[-1L]dotargs <- list(...)## And call the plot function passing NA, your ... arguments, and the default## arguments that were not defined in the ... arguments.tryCatch(do.call("plot", c(list(x=e, y=o), def_args[!names(def_args) %in% names(dotargs)], dotargs)), warn=stop)# Add diagonalabline(0,1,col="red")}
使用 ggplot2 作图
qq_dat <- data.frame(obs=-log10(sort(pd_dat$P,decreasing=FALSE)),exp=-log10( ppoints(length(pd_dat$P))))pd_qq <- ggplot(data=qq_dat,aes(exp,obs))+geom_point(alpha=0.7,color="#7F7F7FFF")+geom_abline(color="#D62728FF")+xlab("Expected -log10(P-value)")+ylab("Observed -log10(P-value)")+scale_x_continuous(limits = c(0,7))+scale_y_continuous(limits = c(0,7))+theme(axis.title = element_text(size=12,face="bold"),axis.text = element_text(face="bold",size=8,color = "black"),#axis.line = element_line(size=0.8,color="black"),axis.ticks= element_line(size=0.8,colour = "black"),panel.grid =element_blank(),panel.border = element_rect(fill=NA,size = 0.8),panel.background = element_blank())


