写在前面
数据分析中遇到一些问题,将样本根据某些条件分成不同的组,不同组中样本的某两个变量之间相关性发生改变,这时就需要分析相关性的改变是因为分组导致的还是仅仅因为样本量的改变导致的。大家应该遇到过样本量越少,相关性越容易高得情况。所以需要一种统计方法来比较不同组的不同相关性之间有没有差异。当然还有其他需要比较相关性的需求。
参考
https://journals.plos.org/plosone/article?id=10.1371/journal.pone.0121945
情况分类
(1) The correlations were measured in two independent groups A and B. This case applies, for example, if a researcher wants to compare the correlations between anxiety and extraversion in two different groups A and B (ρA = ρB). If the two groups are dependent, the relationship between them needs further differentiation: (2) The two correlations can be overlapping (ρA12 = ρA23), i.e., the correlations have one variable in common. ρA12 and ρA23 refer to the population correlations in group A between variables 1 and 2 and variables 2 and 3, respectively. For instance, a researcher may be interested in determining whether the correlation between anxiety and extraversion is smaller than between anxiety and diligence within the same group A. (3) In the case of two dependent correlations, the two correlations can also be nonoverlapping (ρA12 = ρA34), i.e., they have no variable in common. This case applies, for example, if a researcher wants to determine whether the correlation between anxiety and extraversion is higher than the correlation between intelligence and creativity within the same group. A researcher also faces nonoverlapping dependent correlations when investigating whether the correlation between two variables is higher before rather than after a treatment provided to the same group.
- 样本互相独立。比如A组为成年人身高和体重的相关性 r1,B组为儿童身高与体重之间的相关性 r2 。比较r1 和 r2 。
- 样本依赖情况一。比如还是A组成年人,身高与体重的相关性 r1,身高与臂长的相关性 r2 。这里还有一个共有的身高变量重叠。
- 样本依赖情况二。比如还是A组成年人,身高和体重的相关性 r1,智力与年龄的相关性 r2 。变量非重叠。
直接在网页中分析
http://comparingcorrelations.org/
使用R包 cocor
安装
install.packages(“cocor”)library(cocor)
分情况分析
- 样本非依赖的情况。使用数据 aptitude 示例,数据格式如下图,是个列表,包含两个数据框。
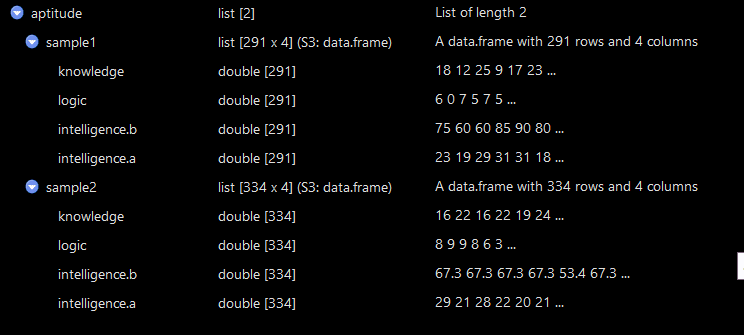
require("cocor")data("aptitude")cocor(~logic + intelligence.a | logic + intelligence.a, aptitude)
下面是输出结果,r1.jk 和 r2.hm 没有显著差异,不能拒绝原假设。
#Results of a comparison of two correlations based on independent groups#Comparison between r1.jk (logic, intelligence.a) = 0.3213 and #r2.hm (logic, intelligence.a) = 0.2024#Difference: r1.jk - r2.hm = 0.1189#Data: sample1: j = logic, k = intelligence.a; sample2: h = logic, m = #intelligence.a#Group sizes: n1 = 291, n2 = 334#Null hypothesis: r1.jk is equal to r2.hm#Alternative hypothesis: r1.jk is not equal to r2.hm (two-sided)#Alpha: 0.05#fisher1925: Fisher's z (1925)# z = 1.5869, p-value = 0.1125# Null hypothesis retained#zou2007: Zou's (2007) confidence interval# 95% confidence interval for r1.jk - r2.hm: -0.0281 0.2637# Null hypothesis retained (Interval includes 0)
在没有原始数据的也可以使用下面方法
cocor.indep.groups(r1.jk = 0.3213, r2.hm = 0.2024, n1 = 291, n2 = 334)
- 第二种情况,样本依赖,相关性变量有重叠
cocor(~knowledge + intelligence.a | logic + intelligence.a,aptitude[["sample1"]])
或者
cocor.dep.groups.overlap(r.jk = 0.1038, r.jh = 0.3213, r.kh = 0.0257, n = 291)
- 第三种情况,样本依赖,变量不重叠
cocor(~ knowledge + intelligence.a | logic + intelligence.b, aptitude[["sample1"]])
或者
cocor.dep.groups.nonoverlap(r.jk = 0.1038, r.hm = 0.2679, r.jh = 0.0257,r.jm = 0.1713, r.kh = 0.3213, r.km = 0.4731, n = 291)

若有收获,就点个赞吧
0 人点赞
